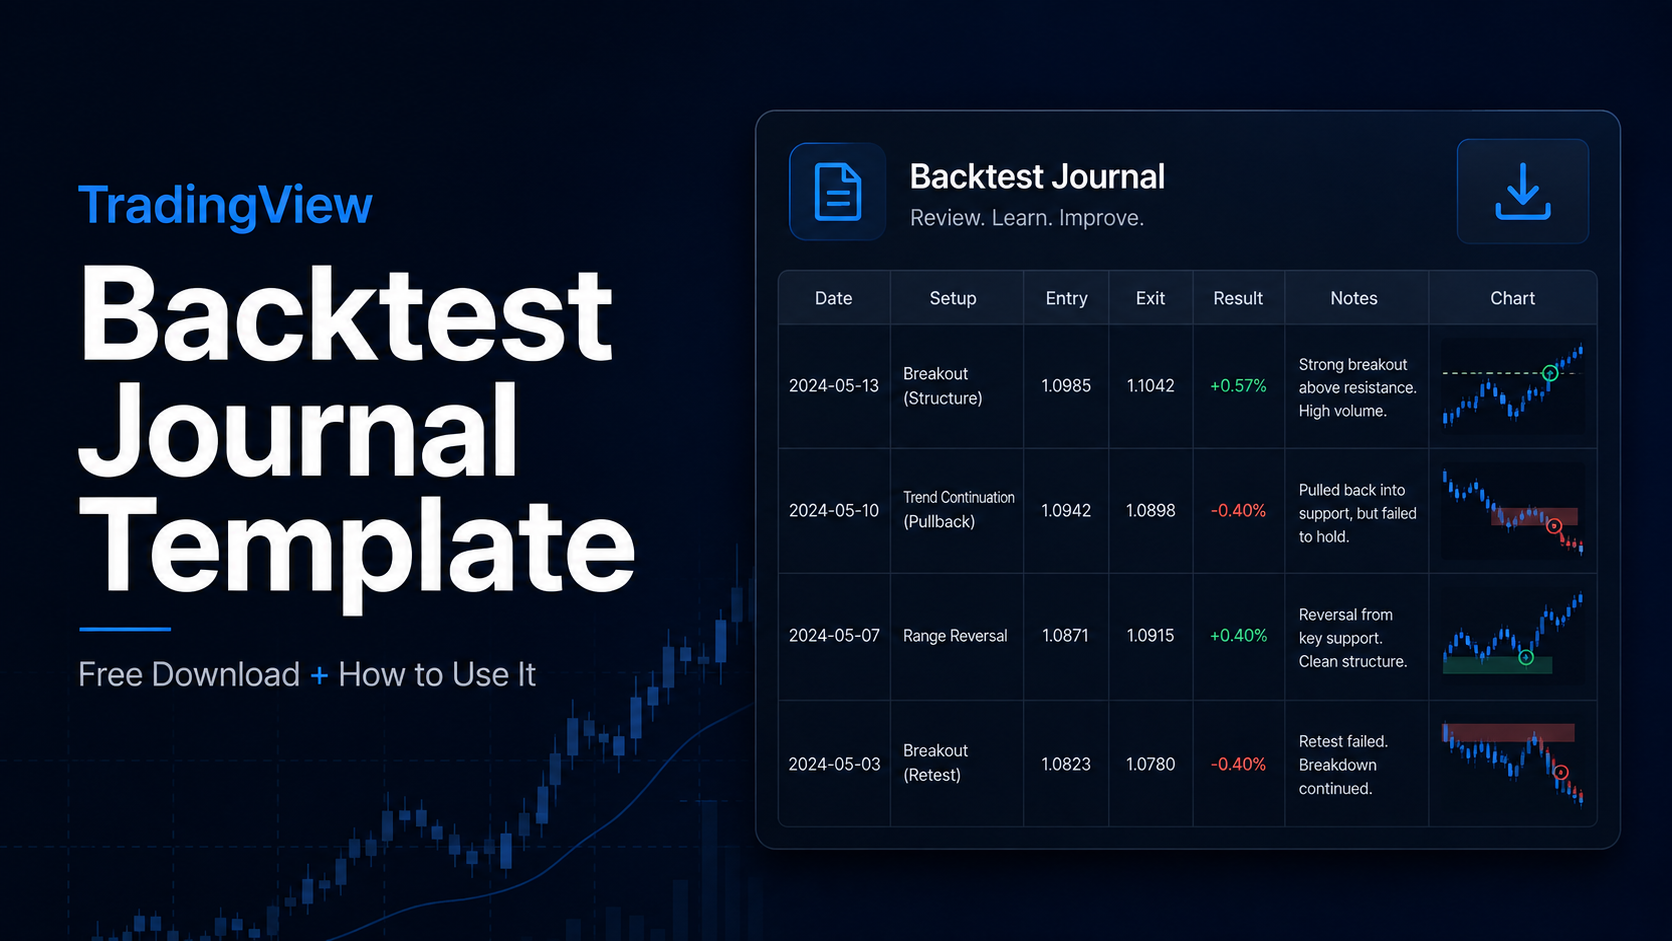
After nearly a decade of trading, one thing I’ve learned is that you leave a lot of value on the table if you don’t record what you actually saw on the charts, decided, and executed during a test setup. It becomes especially obvious with manual backtesting and tools like TradingView Bar Replay.
You might remember that a breakout setup worked well last week. But do you remember:
- What the broader market looked like?
- Where you originally planned the stop?
- Whether you entered exactly according to your rules?
- Whether that 2R target was really part of the plan, or something that looked obvious after seeing the outcome?
That is where a backtesting journal becomes useful. Instead of treating every historical trade as an isolated win or loss, you build a record of the entire decision-making process. Over time, that makes it much easier to separate strategy problems from execution problems.
1. Download the TradingView Backtest Journal Template
We created a free backtesting journal specifically for traders manually testing strategies on TradingView.
DOWNLOAD: TradingView Backtest Journal TemplateThe workbook contains four sheets:
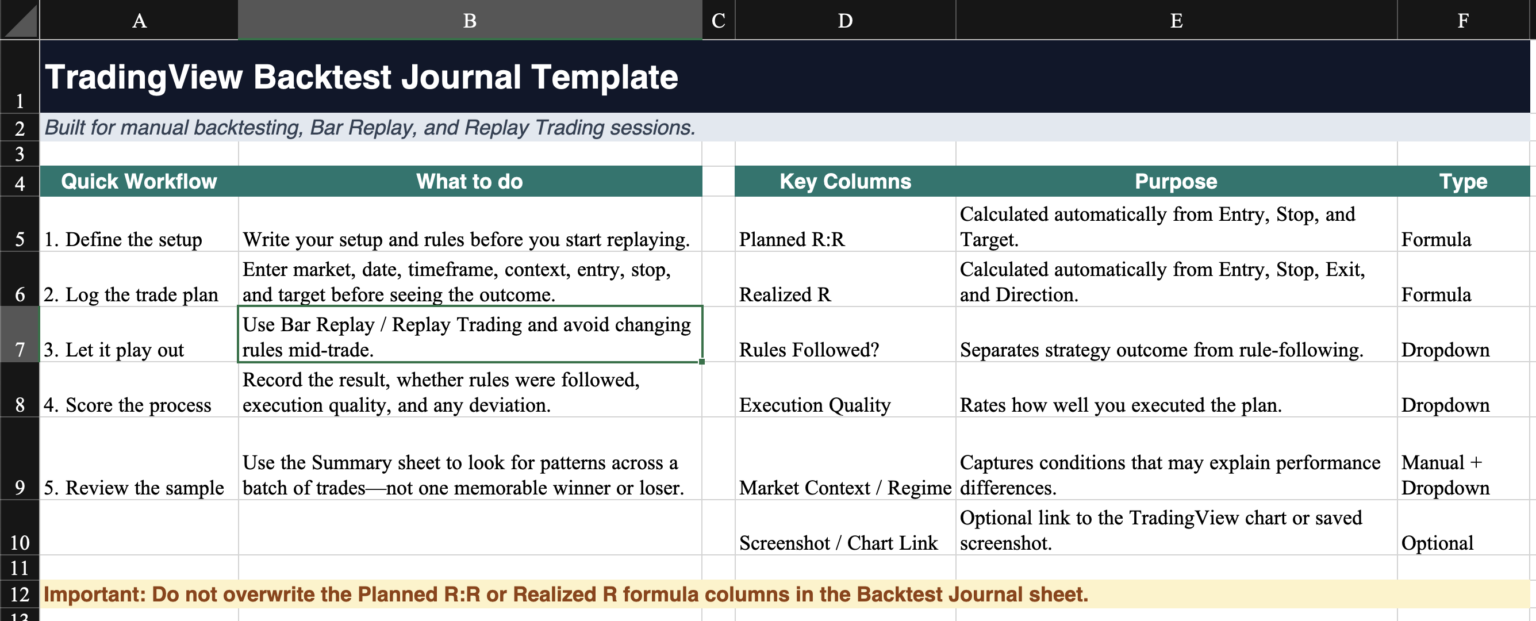
A. Backtest Journal
This is the main database where you record each test. It includes fields for:
- Date
- Market
- Timeframe
- Direction
- Setup
- Market context and regime
- Entry
- Stop
- Target
- Exit
- Planned risk-to-reward
- Realized R
- Result
- Rules followed
- Execution quality
- Mistakes or deviations
- Notes
- Screenshot/chart link
- Testing method
Some fields use dropdowns to keep your entries consistent, while Planned R:R and Realized R are calculated automatically.
B. Summary
The Summary sheet makes your journal easier to review. It automatically tracks metrics including:
- Total trades
- Wins and losses
- Win rate
- Total and average Realized R
- Average Planned R:R
- Rule-follow rate
- Execution quality
- Trades containing deviations
The idea is not to turn the journal into another automated backtester. It is to summarize the information you manually collected so recurring patterns are easier to spot.
C. Example Trade
We have also included completed examples showing what a properly logged backtest might look like. That is useful if you are unsure how detailed fields such as Market Context, Execution Quality, or Mistake / Deviation should be.
D. Start Here
Finally, the Start Here sheet gives you a quick overview of the workflow and the most important fields. You can technically begin logging trades immediately, but I would spend a few minutes first understanding what each column is meant to capture. Consistent entries become much more valuable once you start comparing dozens of trades later.
2. What Should You Record in a Backtesting Journal?
A useful backtesting journal needs enough information to explain why a trade happened, not just whether it won or lost. Start with the basics: date, market, timeframe, direction, setup.
Those fields tell you what you actually tested and make later filtering much easier. If one setup performs well on BTC but struggles on EURUSD, or works on the 1-hour chart but not the 5-minute, you need that information recorded consistently to see it.
The next layer is context. Our template separates this into Market Context and Market Regime. Market Context is free-form. You might write something like: “Higher-timeframe uptrend, price pulling back into previous resistance turned support.” Market Regime keeps things more standardized:
- Trending
- Ranging
- High volatility
- Low volatility
- Event-driven
- Mixed
A breakout strategy might look excellent overall, but once you separate the trades by regime, you may discover that most of its losses came from sideways markets. That is exactly the kind of information a simple win/loss column cannot give you.
The most crucial habit you can learn is to record the trade plan before seeing the outcome. Before you reveal what price does next, record entry, stop, and target. The template automatically calculates your planned risk-to-reward ratio using those values. If you record the trade after seeing the outcome, hindsight starts creeping in almost immediately.
Imagine you originally planned a 2R target. Price reaches 1R, reverses, and stops you out. Looking at the completed chart afterward, it becomes very easy to think: “I probably would have taken profit around there anyway.” Perhaps you would have, but perhaps not.
The journal removes that ambiguity because the original plan was already written down. This is especially useful with TradingView Bar Replay. Pause when the setup becomes valid, record the trade plan, and only then reveal the next candle.
📌 Editor’s Advice: Remember the idea here is not to predict the past perfectly but to test your plan for future, unknowable setups.
3. How to Record the Outcome in the Backtesting Journal?
Once the trade is finished, record the outcome separately from the original plan. The template asks for: Exit, Result, and Realized R. This would become an important distinction later on because the trade you planned and the trade you actually ended up taking are not always the same.

You may have planned a 2R target but exited early at 1.2R. You may have widened the stop. You may have been stopped out exactly as planned. All of those differences are valuable information. The template calculates Realized R from your entry, stop, exit, and trade direction. That gives you a standardized way to compare trades without getting distracted by account size.
For example:
- +2R means you made twice the amount you originally risked
- -1R means the full planned risk was lost
- +0.5R means you made half of the initial risk
This is usually much more useful during strategy testing than recording only dollar profit or loss. A $500 winner tells you almost nothing by itself. If you risked $100, that is a very different trade from risking $1,000 to make the same amount.
Read: Manual Backtesting vs Automated Backtesting vs Paper Trading4. Separate Strategy Performance From Execution Quality
One of the biggest reasons to keep a proper backtesting journal is that trade outcome and trade quality are not the same thing. Consider these two trades:
Trade A
- Result: Loss
- Rules followed: Yes
- Execution quality: Excellent
Trade B
- Result: Win
- Rules followed: No
- Execution quality: Poor
Trade B made money, but from a testing perspective, Trade A may actually tell you more about whether the strategy works. If you broke your own rules and still won, the market may simply have bailed you out. Treating that trade as evidence for the strategy can distort your results.
That is why the template includes separate fields for Rules Followed?, Execution Quality, Mistake / Deviation, and Notes / Lesson. Over a larger sample size, these fields will help you ask better questions.
Any basic spreadsheet can tell you whether you won or lost.A proper journal should help explain why.
5. Use Screenshots With Your Backtests
Numbers tell you what happened. Screenshots help preserve what the chart actually looked like when you made the decision. That is especially useful for discretionary setups where things like structure, momentum, liquidity, or indicator context are difficult to reduce to spreadsheet fields.
The template includes a Screenshot / Chart Link column for that reason. At minimum, I would save a screenshot at the point where the trade becomes valid. Depending on the setup, you may also want:
- A pre-entry screenshot
- The entry itself
- The final chart after exit
Do not only save the finished chart after the outcome is obvious. If possible, capture the setup before revealing what happens next. That gives you a cleaner record of the information you genuinely had when making the decision.
Later, when reviewing ten similar losing trades, those screenshots may reveal something the numbers missed entirely: perhaps most entries came after extended moves, during poor structure, or when the setup looked noticeably weaker than your winners.
6. Example: Logging One Bar Replay Trade
Let’s take a simple AAPL 15-minute breakout retest as an example. You are using TradingView Bar Replay and price breaks through a resistance level, then pulls back to retest it. Before advancing the chart, record:
- Market: AAPL
- Timeframe: 15m
- Direction: Long
- Setup: Breakout Retest
- Market Context: Bullish structure with previous resistance being retested as support
- Entry: Planned entry price
- Stop: Below the invalidation level
- Target: Planned profit target
The template calculates your planned R:R from those prices. Now continue the Replay. Once the trade closes, add the Exit, Result, and any notes about how the trade actually developed. Realized R is calculated automatically. Finally, score the process:
- Did you follow the rules?
- How good was the execution?
- Did you make any deviations?
- What did the trade teach you?
The goal is not to write an essay about every setup. A few consistent fields and one useful observation are enough.
7. How to Use the Summary Dashboard
Once you have logged enough trades, the individual rows become harder to interpret on their own. The Summary sheet gives you a quick overview of the sample by automatically tracking:
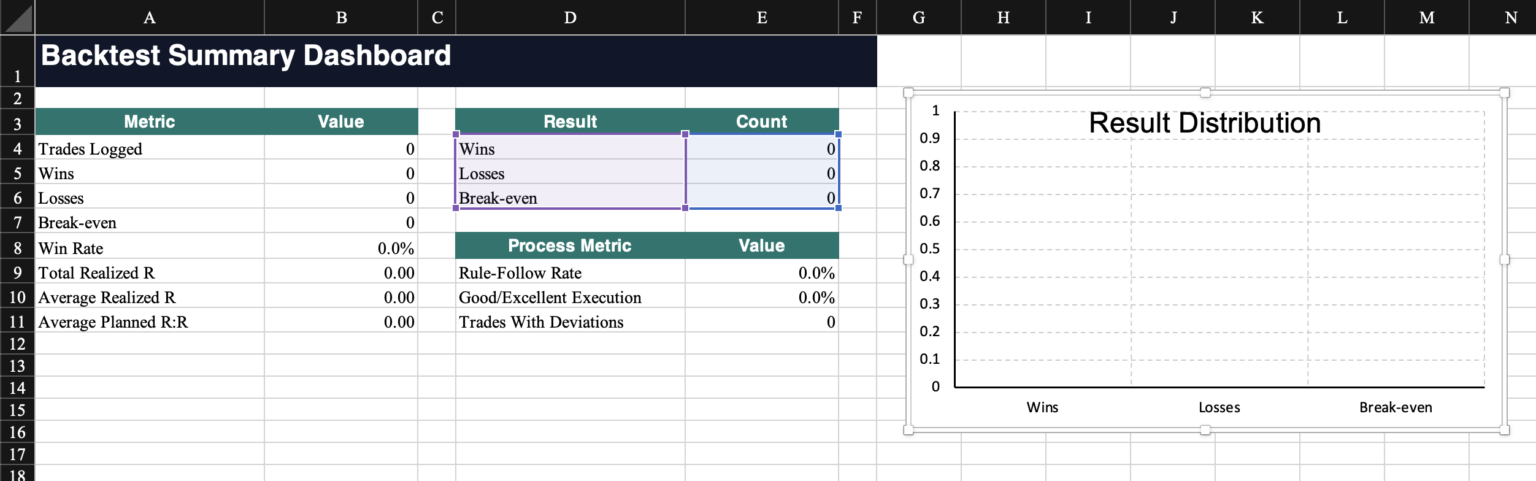
- Trades logged
- Wins and losses
- Break-even trades
- Win rate
- Total Realized R
- Average Realized R
- Average Planned R:R
- Rule-follow rate
- Good/Excellent execution rate
- Trades containing deviations
I would resist the temptation to make win rate the headline number. Suppose your win rate falls from 60% to 48%, but your average winner increases enough that total Realized R improves. That does not necessarily mean the strategy got worse.
Likewise, a profitable backtest with poor rule adherence should make you cautious. If many of the winning trades came from decisions that violated the strategy, you may not be testing the strategy consistently at all.
8. How to Review Your Backtest Journal
The journal becomes more valuable once you stop looking at individual trades and start looking for patterns across the sample. Instead of asking only, “Was the strategy profitable?”, look deeper:
- Does one setup consistently outperform another?
- Are most losses occurring in ranging markets?
- Does performance change by timeframe or asset?
- Are your losing trades concentrated around late entries?
- Do trades where every rule was followed perform better?
- Is your realized R consistently lower than your planned R:R?
- Which mistakes keep appearing?
For example, poor overall results could mean the strategy itself needs work. But if most losses also show Rules Followed: No, then the bigger problem may be execution rather than the underlying setup. Likewise, a profitable sample can hide weaknesses if a large percentage of trades contain deviations.
Try to separate two questions: Does the strategy have a problem? and Am I applying the strategy poorly?
A well-kept backtesting journal would give you a much better chance of answering both.
9. How to Use the Template With TradingView Bar Replay
The template works especially well with TradingView Bar Replay because Replay lets you hide future price action and move through historical markets progressively. A simple workflow looks like this:
Define the setup → Start Bar Replay → Record the trade plan → Reveal the next bars → Complete the journal → Review the sample
Read: TradingView Bar Replay Plans, Data Limits & Timeframes: How Far Back Can You Replay?When the setup becomes valid, pause Replay and enter the market, timeframe, setup, context, entry, stop, and target into the journal. Then continue the Replay and let the trade develop according to the rules you already defined.
Once the trade finishes, complete the result, Realized R, execution quality, deviations, and notes. This makes Bar Replay much more useful than simply scrolling through historical charts and deciding afterward where you “would have” entered.
10. How Many Backtests Should You Record?
Unfortunately, there is no universal answer. Three or five beautiful historical trades obviously tell you very little. But blindly deciding that every strategy needs exactly 100, 500, or 1,000 trades is not much better. The amount of evidence you need depends on things like:
- How frequently the setup occurs
- How variable the results are
- How many markets and conditions you are testing
- Whether trades are genuinely independent
- How many strategy variations you tried before finding the current version
A strategy tested across 100 nearly identical market conditions may tell you less than a smaller but more diverse sample. The important point is that sample size should be large enough to expose the strategy to different outcomes and market regimes, not just enough to produce a nice-looking win rate.
DOWNLOAD: TradingView Backtest Journal Template
Zeiierman
With over 16 years in the market, Zeiierman has extensive experience as a full-time trader and risk advisory consultant for hedge funds. He has developed many profitable trading strategies, drawing on his background in risk management and strategy execution.
More from Zeiierman