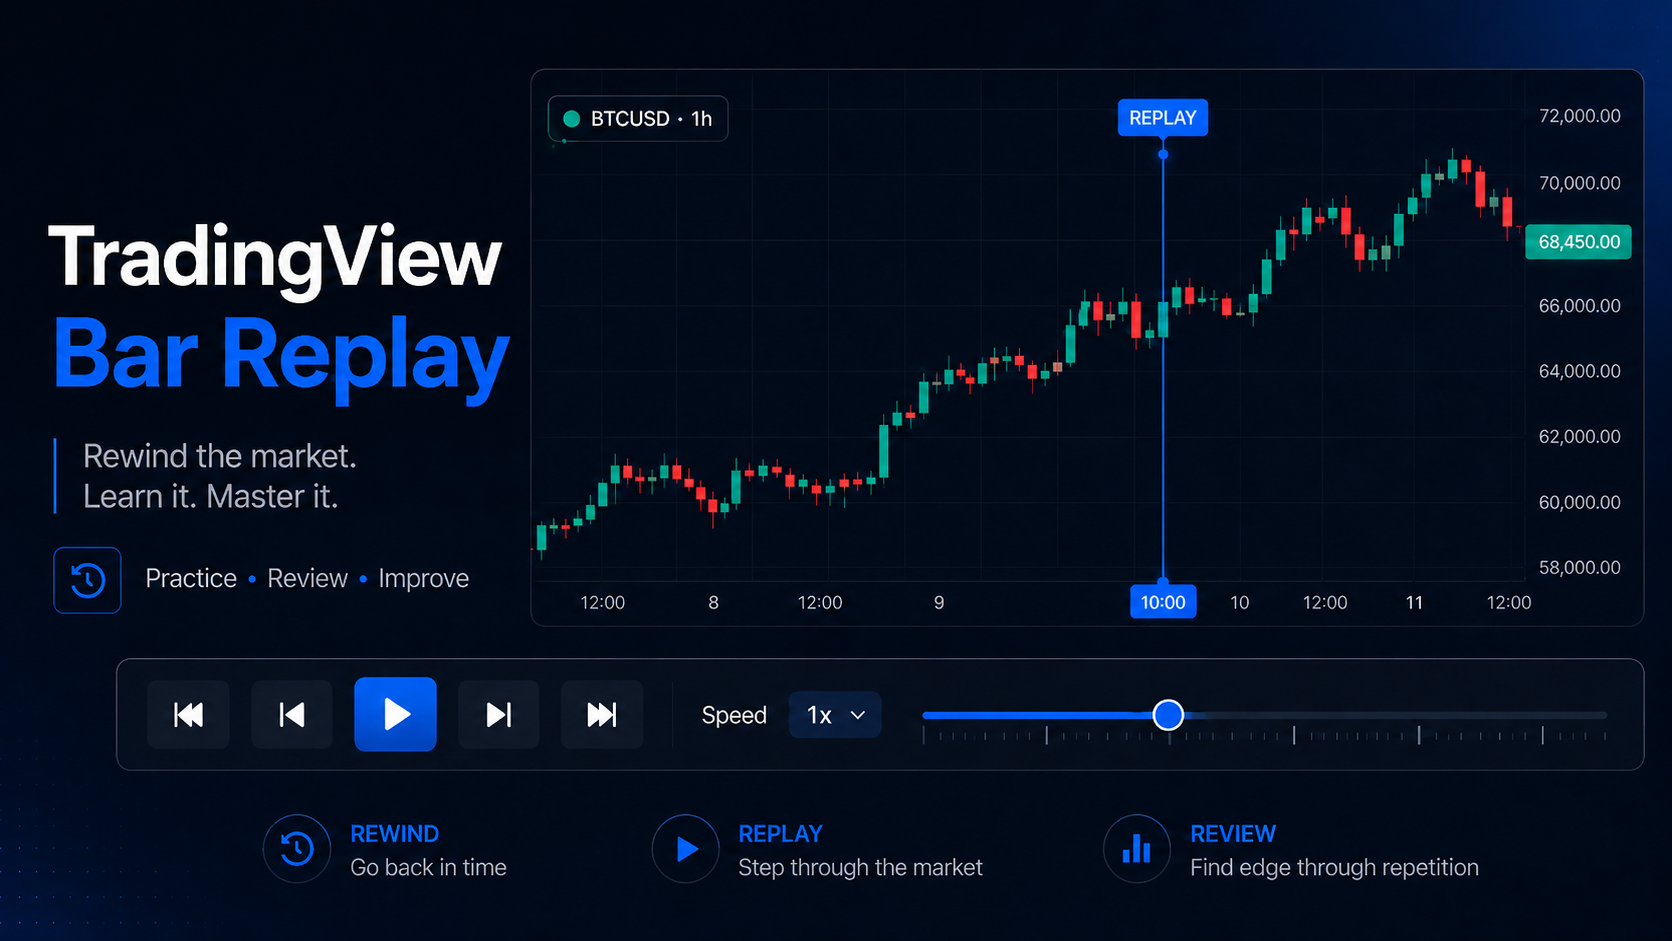
There is no single historical limit for TradingView Bar Replay. How far back you can replay depends on your TradingView plan, chart interval, symbol, and the amount of historical data TradingView actually stores for that market. Let’s put the numbers together. The table below shows TradingView’s current standard Bar Replay limits for time-based charts.
| TradingView Plan | Daily & Higher | 1-Minute | 2-Minute | 3-Minute | 5-Minute | 15-Minute | Seconds-Based | Tick Replay |
|---|---|---|---|---|---|---|---|---|
| Basic | All available | Not included | Not included | Not included | Not included | Not included | Not included | Not included |
| Essential | All available | 6 months | 12 months | 18 months | 30 months | 90 months | Not included | Not included |
| Plus | All available | 1 year | 2 years | 3 years | 5 years | 15 years | Not included | Not included |
| Premium | All available | All stored | All stored | All stored | All stored | All stored | All stored | Not included |
| Expert | All available | All stored | All stored | All stored | All stored | All stored | All stored | Not included |
| Ultimate | All available | All stored | All stored | All stored | All stored | All stored | All stored | Up to 7 days |
Important: These are maximum plan allowances. Actual history can be shorter depending on how much data TradingView stores for the symbol and interval.
There are also separate rules for continuous futures and some synthetic futures series, which we’ll cover later because their intraday Replay limits are substantially different from the standard table above.
1. Why Bar Replay Limits Change by Timeframe and Symbol
For Essential and Plus users, TradingView scales the available intraday Replay history with the chart interval. From what we know, the formulas are:
- Essential: 6 months × interval in minutes
- Plus: 1 year × interval in minutes
So on Essential, a 1-minute chart gives you 6 months of history, while a 5-minute chart gives you 30 months. On Plus, the same 5-minute chart can go back 5 years.
Read: TradingView Bar Replay: Complete Guide for Beginners, What It Is, How to Use and Best Practices for Practical SetupsThis makes the selected timeframe surprisingly important when planning a backtest. And I will mention this again: increasing the interval does not produce data that TradingView does not already have. A 15-minute Plus account may theoretically allow 15 years of Replay, but if TradingView only stores 10 years of 15-minute data for that symbol, 10 years is all you can use. Think of the plan allowance as the maximum window, not guaranteed history.
The available starting point can vary dramatically. TradingView’s documentation uses NASDAQ:AAPL as an example:
- Daily data begins on December 12, 1980
- 1-minute data begins on January 3, 2000
- 1-second Replay data begins on August 17, 2022
Other markets have completely different histories. Bitcoin’s 1-minute history on BITSTAMP:BTCUSD, for example, begins in 2011, while some other symbols have substantially less intraday data. TradingView also states that its stored seconds-based history currently begins no earlier than August 17, 2022.
2. Continuous Futures and Synthetic Symbols Have Different Limits
Continuous futures such as ES1! or BANKNIFTY1! do not follow the normal Premium+ “all stored intraday data” rule. TradingView treats these as synthetic series and applies separate limits.
For Premium, Expert, and Ultimate users:
- Seconds-based Replay: 30 days
- 1-minute Replay: 1 year
- 2-minute Replay: 2 years
- 3-minute Replay: 3 years
- Higher minute intervals continue scaling in the same way
Plus users receive the usual 1 year × interval in minutes, while Essential users receive 6 months × interval in minutes. These special limits also apply to futures contracts using TradingView’s “Use settlement as close on daily interval” setting.
This creates an important exception for futures traders: a premium or higher does not automatically grant access to every stored intraday bar on continuous futures.
3. How to Find the Exact Earliest Bar You Can Replay
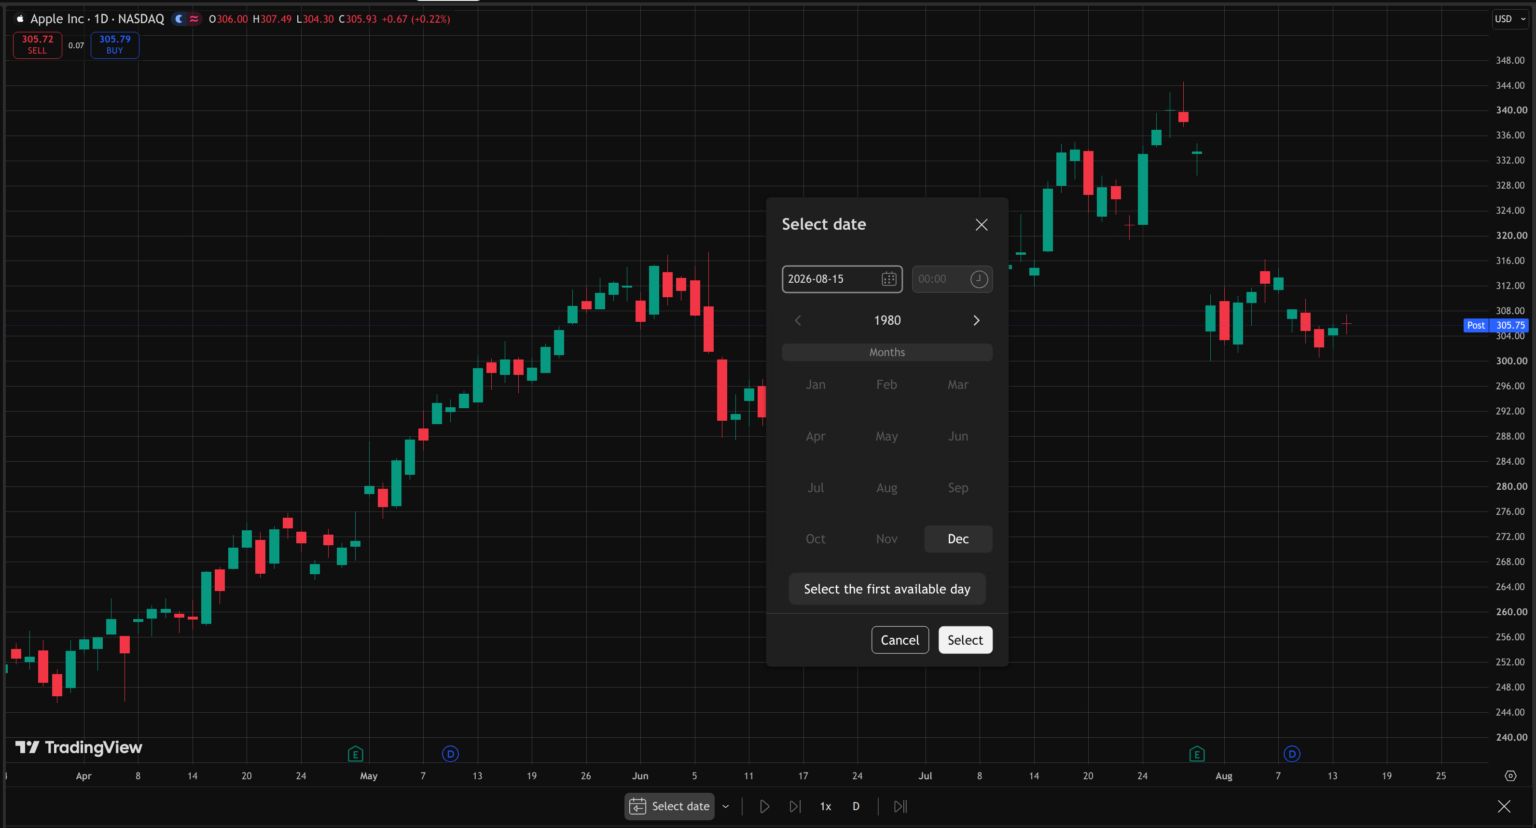
The plan tables are useful, but the fastest way to find your actual Bar Replay limit is inside TradingView itself. Open Bar Replay, then go to: Select date → Select the first available day
TradingView will move you to the earliest replayable point available for that specific combination of symbol, chart interval, subscription, and available historical data. This is more reliable than trying to calculate the date yourself, since the underlying dataset can vary across markets.
If you choose a starting point that is too far back, TradingView may automatically move you forward to the earliest available bar instead. You may also encounter “Data point unavailable.” This usually happens when the higher timeframe has data for that date, but the lower timeframe you are trying to open does not.
So before assuming Bar Replay is broken, select the first available day to confirm where the current chart can genuinely start.
Read: TradingView Bar Replay Not Working: Missing Button, Toolbar & Fixes4. Can You Start on a Higher Timeframe and Switch Lower?
Yes. TradingView specifically supports this workflow. For example, if you want to replay older 1-minute data:
- Switch to a higher timeframe such as the daily chart.
- Start Bar Replay and select an older starting point.
- Switch back to the 1-minute chart.
- Continue the Replay.
This can make it much easier to navigate deep intraday history. But it does not bypass your data limits. The lower timeframe still needs to exist for that date and fall within your plan’s available Replay history. If it does not, TradingView keeps you on the existing timeframe and shows “Data point unavailable.”
If the lower interval is unavailable, use Select the first available day as described above to find where that timeframe begins.
5. Bar Replay Limits vs Normal Chart History
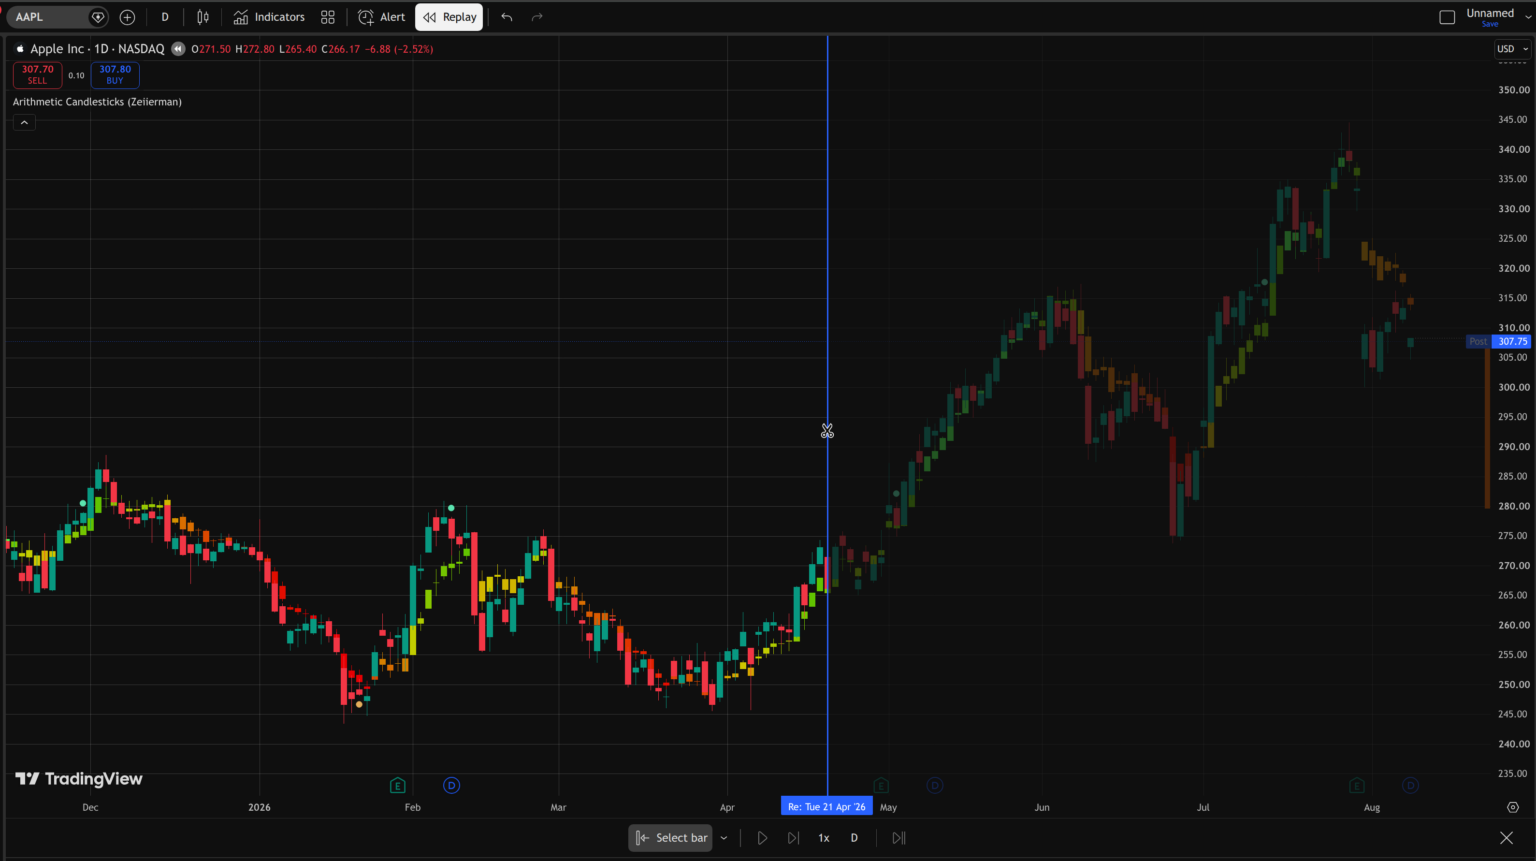
TradingView actually has different historical limits for different tools, and they should not be treated as interchangeable.
| Feature | What the Limit Controls |
|---|---|
| Normal chart history | How many historical intraday bars TradingView loads on the chart |
| Bar Replay | How far back you can start a manual Replay session |
| Deep Backtesting | How much historical data a Pine Script strategy can process in Strategy Tester |
For normal intraday charts, TradingView currently loads at least:
- 5,000 bars on Basic
- 10,000 bars on Essential and Plus
- 20,000 bars on Premium
- 25,000 bars on Expert
- 40,000 bars on Ultimate
Bar Replay works differently because its intraday limits are primarily expressed by date range and interval, as we covered above. Deep Backtesting is different again. Premium and higher users can run Pine Script strategies on historical data beyond what is loaded on the visible chart, with TradingView currently allowing up to 2 million bars per calculation.
So if you can only scroll so far back on a normal chart, that does not necessarily tell you how far Bar Replay or Deep Backtesting can go.
6. Which TradingView Plan Do You Need for Bar Replay?
There is no universally best TradingView plan for Replay. It depends mainly on the timeframe you trade and how much historical testing you actually intend to do.
| Use Case | Suggested Plans |
|---|---|
| Daily / swing trading | Basic may already provide enough history |
| Occasional intraday Replay | Essential |
| Longer 1-minute and intraday samples | Plus |
| Deep historical minute testing | Premium or higher |
| Seconds-based Replay | Premium or higher |
| Tick Replay | Ultimate, where supported |
I would not upgrade purely because a higher plan advertises access to more historical data. First open your actual symbol and timeframe and use: Bar Replay → Select date → Select the first available day
That tells you what you can currently access and helps answer the more useful question: Is my existing Replay history actually too short for the testing I want to do? For a swing trader using daily charts, the answer may be no. For someone manually testing a 1-minute strategy across several market regimes, deeper intraday access can make a much bigger difference.

SM_Trader
SM_Trader is a highly experienced coder and strategy developer who brings the most complex algorithms to life. As a member of MENSA, the prestigious organization for individuals with intelligence scores in the top 2% of the world, he combines exceptional analytical skills with a keen eye for numbers and statistics, empowering businesses to grow at the right pace and in the right direction.
More from SM_Trader