The first question many traders ask about a signal service is simple: “What’s the win rate?” It makes sense. If one provider claims a 75% win rate while another sits closer to 50%, one of them certainly sounds more reliable. But that number alone can be extremely misleading.
A signal service can win most of its trades and still lose money if the losing trades are much larger than the winners. This is also why I would be careful whenever a provider leads with claims such as “90% accurate signals” without showing what sits behind that number. Ninety percent over how many trades? How large were the winners and losers? Were open losses included? Did those results come from one particularly favorable month or several different market environments?
None of this means trading signals cannot be reliable. They absolutely can be. I make, send, and use them myself. But you have to judge reliability at the system level, not by the headline number or the result of the latest trade. A reliable signal process should produce behavior you can measure and evaluate over time. That means looking beyond accuracy to understand what happens when the system wins, what happens when it loses, and whether those results hold up across enough trades to actually mean something.
1. What Does “Reliable” Actually Mean for Trading Signals?
In trading, reliable does not mean predictable. If a car starts every morning, we call it reliable because we expect the same outcome each time. Trading does not work like that. Even a profitable strategy operates in probabilities, which means a completely valid setup can still lose. A reliable signal system can therefore send you a losing trade today, another tomorrow, and potentially several more after that without necessarily becoming unreliable. What matters is whether those results remain consistent with how the strategy is expected to behave over time.
This is where win rate needs context. Win rate tells you how often the signals succeed. Average win and average loss tell you what those outcomes are worth. A system that wins frequently but gives back several winners whenever it loses can have worse economics than one that loses more often but keeps those losses small. One useful way to combine those numbers is expectancy:
Expectancy = (Win Rate × Average Win) − (Loss Rate × Average Loss)
Suppose a strategy wins 50% of its trades, averages 2R on winners, and loses 1R on losing trades:
(0.50 × 2R) − (0.50 × 1R) = +0.5R per trade
That does not mean every trade produces +0.5R. The next trade can still lose 1R. It means that across the sample being measured, the combination of wins and losses has produced a positive average outcome. That distinction changes how you look at individual signals. A loss is not automatically evidence that a signal was bad. If the setup met the system’s criteria, the risk was defined properly, and the trade simply failed, that may be a perfectly normal outcome.
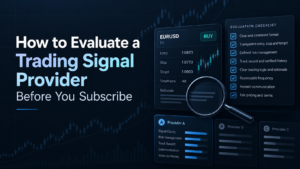
Read: How to Evaluate a Trading Signal Provider Before You SubscribeI would be much more concerned by inconsistency in the process: signals without clear risk, losing trades disappearing from the record, or the rules for what counts as a win changing depending on the result. So reliability is less about predicting the next trade correctly and more about having a process whose outcomes can be measured honestly and whose risk you can understand.
2. Reliability Only Becomes Visible Over Enough Trades
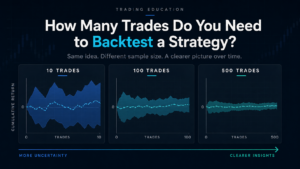
Even useful performance metrics can tell you very little when the sample is too small. If a provider shows eight winners from ten signals, the recorded win rate is 80%. But ten trades are heavily influenced by randomness. A mediocre strategy can look exceptional after a lucky run, while a strong one can look terrible after an unlucky stretch.
The period those trades come from matters too. A trend-following system may perform extremely well while markets are moving strongly in one direction and struggle when price becomes choppy. A mean-reversion strategy may thrive in those sideways conditions and then suffer when a strong trend develops. Changes in volatility can alter the picture again. That makes a long record useful for more than simply increasing the trade count. It lets you see how the signal process behaves when the market itself changes.
You should also be able to see what happens during the bad periods. A profitable system can still experience several consecutive losses. Drawdown measures this from another angle by showing how far performance falls from a previous peak before recovering. Two strategies can produce similar long-term returns while exposing traders to very different journeys along the way.
One might progress relatively steadily with modest drawdowns. Another might generate stronger returns but repeatedly experience deep losing periods. Both can be profitable, but they do not carry the same risk or require the same level of tolerance from the trader following them. This is why a performance history consisting mainly of winning screenshots or selected profitable weeks tells you very little about reliability. You need to see the periods when the strategy struggled as well.
You are not looking for a system that never has a bad period. You are trying to understand what its bad periods look like, how severe they become, and whether they are consistent with the risk you expected to take.
3. Provider Performance and Your Performance May Be Different
There is another complication when evaluating signal results: even if the provider reports its performance accurately, subscribers may not reproduce those results exactly. A provider usually calculates performance under a particular execution model. The signal may assume an entry at the published price, a defined stop, specific targets, and a particular method of managing the position. Real execution can differ.
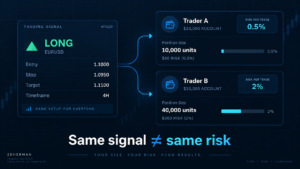
You might receive the alert after price has already moved. The spread may be wider. A fast market can create slippage. You might miss one trade, close another too early, or move a stop because the position starts going against you. Position sizing creates another difference. A provider might report results in terms of R or percentage return, while individual traders risk very different amounts of their accounts. Two people can follow the same set of signals and experience very different account-level results simply because one risks 0.5% per trade and the other risks 3%.
Selective execution matters too. Suppose a service sends 20 signals and the complete set performs well. If you take only the ten that look best to you, you are no longer trading the same sample. You might outperform it, but you might also skip several of the trades responsible for most of the system’s edge.
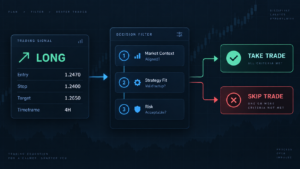
The same applies when you chase an entry after price has already moved. A signal might originally offer 2R of potential reward for 1R of risk. If you enter significantly later while keeping the original stop and target, the reward-to-risk changes. Directionally it may look like the same trade, but statistically it is no longer the same setup. That is why signal reliability and subscriber profitability are related, but they are not the same thing.
Read: How to Use Trading Signals Without Blindly Following Them4. How I Would Judge Whether Trading Signals Are Reliable
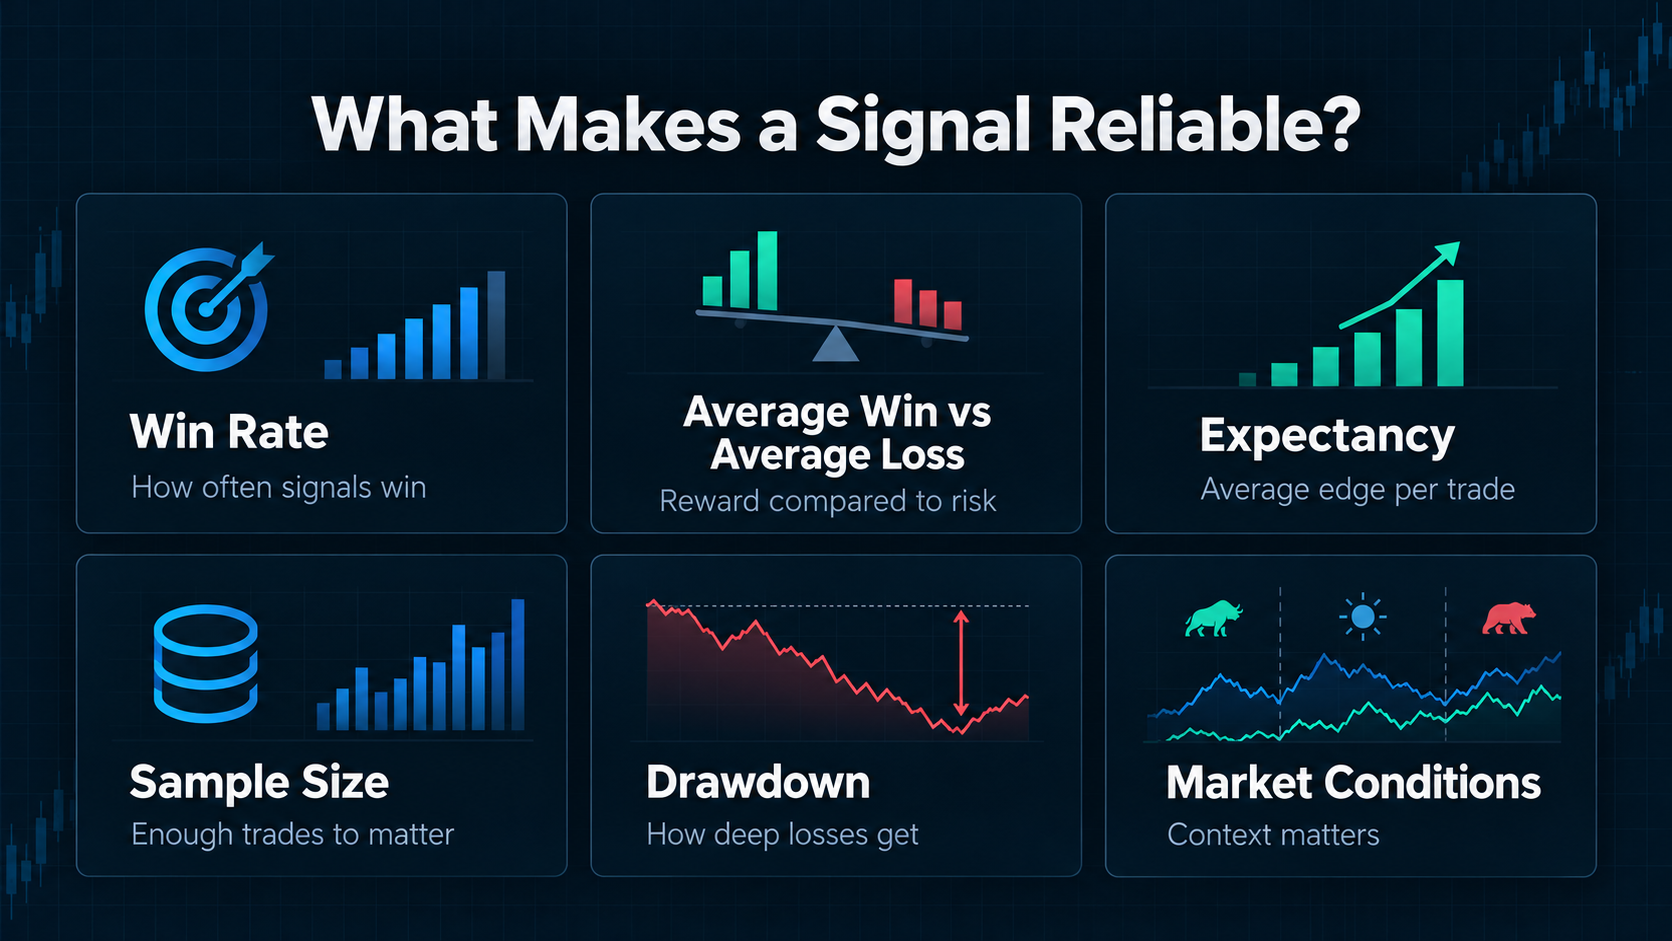
By this point, you should have a better idea of why I would never judge a signal service from one statistic. Instead, I would build a complete picture from a handful of metrics:
| Metric | What It Actually Tells You |
|---|---|
| Win Rate | How often signals close profitably |
| Average Win vs Average Loss | Whether the size of winners justifies the losses |
| Expectancy | What the combination of win rate and payoff has produced on average |
| Sample Size | How much evidence sits behind the reported statistics |
| Drawdown | How severe historical losing periods have been |
| Market Conditions | Whether performance depends heavily on a particular environment |
| Execution Assumptions | How realistic and reproducible the reported results are |
I would want those numbers to come from the same complete performance record, rather than picking the most flattering statistic from different periods. No individual metric is the verdict. A high win rate needs to make sense alongside the average win and loss. Positive expectancy is more convincing when it comes from a meaningful sample. Strong overall returns need to be considered alongside the drawdowns required to achieve them. And impressive historical results matter less if they depend on execution that subscribers could not realistically reproduce.
That is ultimately how I would answer the question “Are trading signals reliable?” Some can be. Others clearly are not. Reliability is not an inherent feature of trading signals; it is a characteristic of the process generating and reporting them. You do not need every trade to win. You need enough transparent evidence to determine whether the system has produced a repeatable edge, understand the risks involved, and decide whether that profile makes sense for the way you trade.
The important question is not simply “How often do these signals win?” It is whether the complete process holds up over enough trades to be worth following.

Zeiierman
With over 16 years in the market, Zeiierman has extensive experience as a full-time trader and risk advisory consultant for hedge funds. He has developed many profitable trading strategies, drawing on his background in risk management and strategy execution.
More from Zeiierman