A Bearish Harami is a two-candle chart pattern that signals a potential reversal from an uptrend to a downtrend. It forms when a large bullish candle is followed by a smaller bearish or indecisive candle (like a doji) that’s completely contained within the previous day’s body. It’s one of the more subtle candlestick signals, which also makes it one of the most overlooked.
This isn’t just another pattern to memorize and forget. The bearish harami pattern tells a story about market psychology, shifting momentum, and the moments when bulls start losing their grip. By the time you finish reading this, you’ll spot these setups like a hawk and know exactly how to profit from them.
1. How to find (and validate) a Bearish Harami Pattern?
Spotting a legit Bearish Harami pattern in the wild isn’t as simple as finding any red candle followed by any green candle. This pattern happens frequently but VERY randomly. In my last few decades of being a trader, I have made a small checklist to find and validate the pattern:
Prior uptrend: A Bearish Harami only works its magic when it shows up in a clear uptrend. Finding this pattern in the middle of a downtrend or sideways market is not worth reviewing and re-adjusting your trading strategy. That’s like finding a life jacket in the desert – incredibly interesting but not quite useful.
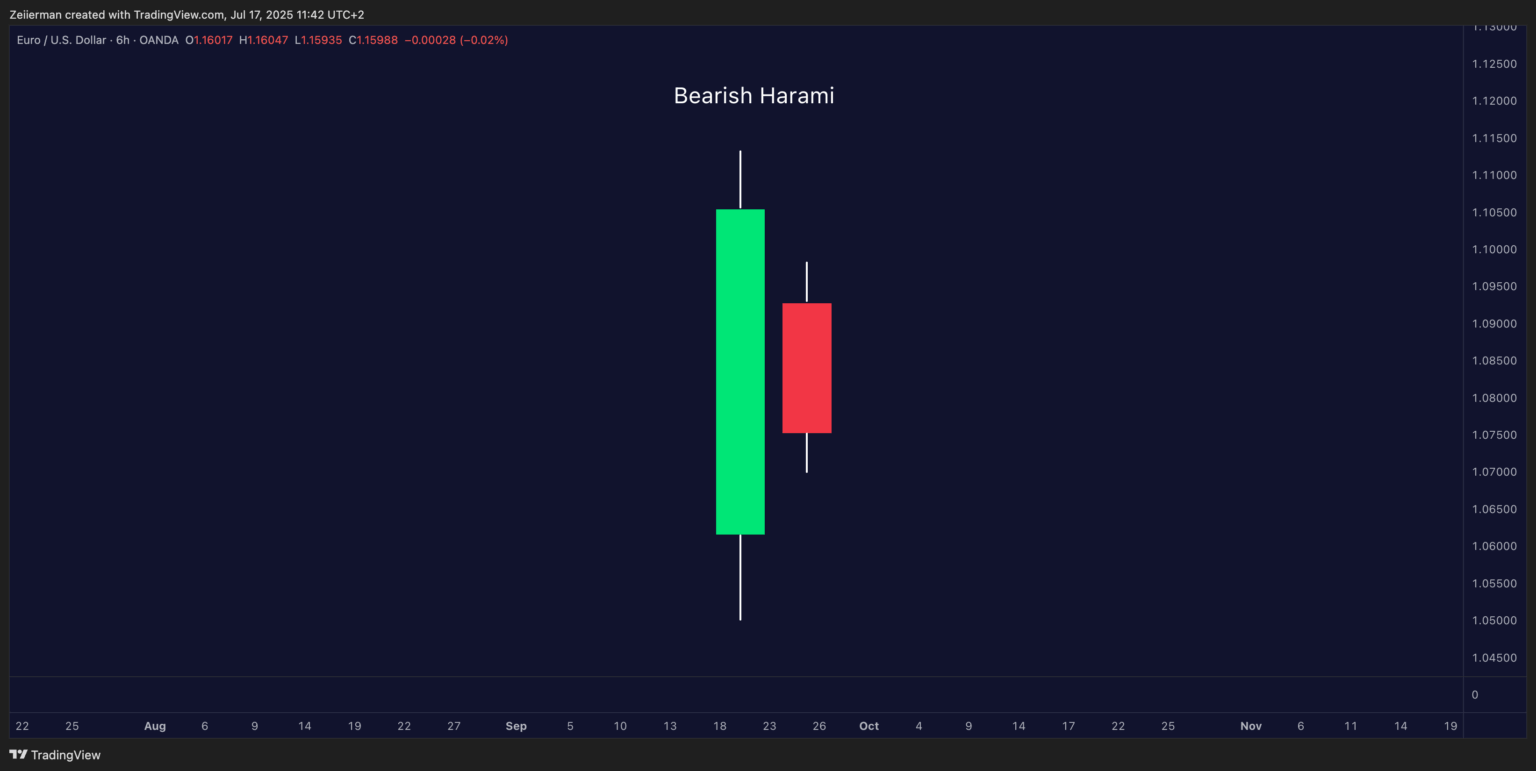
First Candle: The mother candle has a large, bullish body that screams, “bulls are charging!” This candle shows strong buying pressure, often closing near its high.
Second Candle: A smaller bearish body that fits entirely within the first candle’s range, also called the baby candle. It’s like the market took a step back and said, “Hold up, maybe we’re moving too fast.” The pattern signals a potential reversal because it indicates a shift in momentum from bullish confidence to uncertainty.
In my few decades of trading, I have made a visual checklist to confirm Harami candlestick patterns. There are three key factors to consider: size, position, and color. Let’s start with size. The first candle needs a significantly larger body than the second. We’re talking at least a 2:1 ratio, but 3:1 or better makes for stronger signals. Next, the second candle’s entire body must sit within the first candle’s body. Even if it pokes out by a few cents, it doesn’t count.
Finally, the color requirements. The first candle must be bullish (green), and the second candle must be bearish (red). The second candle (Baby candle) must open and close completely within the high and low range of the First candle (Mother candle).
📌 Pro Tip: Traders often confuse the Bearish Harami with the Inside Bar. While similar, the Harami always requires a trend and comes with more psychological weight in technical analysis.
2. The Psychology Behind the Pattern
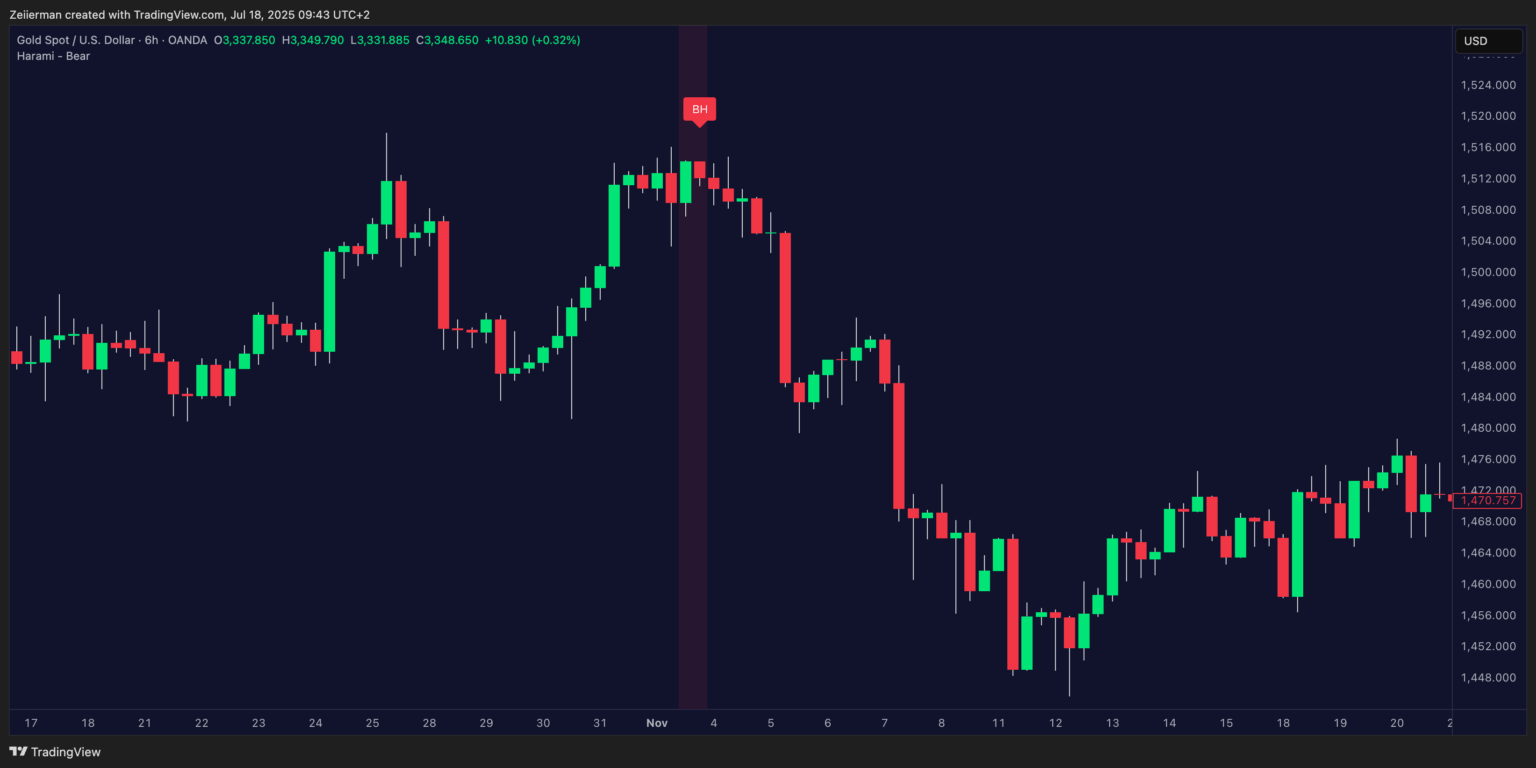
You might be wondering: Why should I care about a tiny red candle inside a green one? Because it’s not the pattern itself — it’s what it represents. The Bearish Harami often appears near market tops. It doesn’t guarantee a reversal, but it does hint that the trend is losing steam. For experienced traders, that’s gold. The most reliable Bearish Harami pattern often occurs on a daily chart session.
Day 1: The Bulls are absolutely crushing it. Maybe there’s good news, earnings beat expectations, or momentum is just building. Traders are buying aggressively and pushing prices higher throughout the session. The large green candle reflects this confidence.
Day 2: Something shifts. Perhaps profit-taking sets in, or traders begin to question whether prices have moved too far too fast. Instead of the good buying pressure, you get hesitation. The small red candle now located within the previous day’s range illustrates this uncertainty.
Smart money – institutions, hedge funds, and professional traders – often use these moments to start lightening their positions.
3. How to trade the Bullish Harami Candlestick correctly?
Step 1: Spot and confirm the pattern.
The Bearish Harami is a reversal pattern, so it only makes sense after a clear upward move. We’re looking for higher highs and lows, for bullish candles to show strength, and for moving averages to start rising (like 20 EMA or 50 SMA).
Once you see a clear uptrend, watch for the Bearish Harami to appear. You already know we’re looking for a large green candle (the mother) followed by a small red one (the baby). Remember – the smaller the second candle, the stronger the sign of hesitation, especially if it’s a doji.
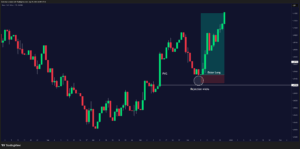
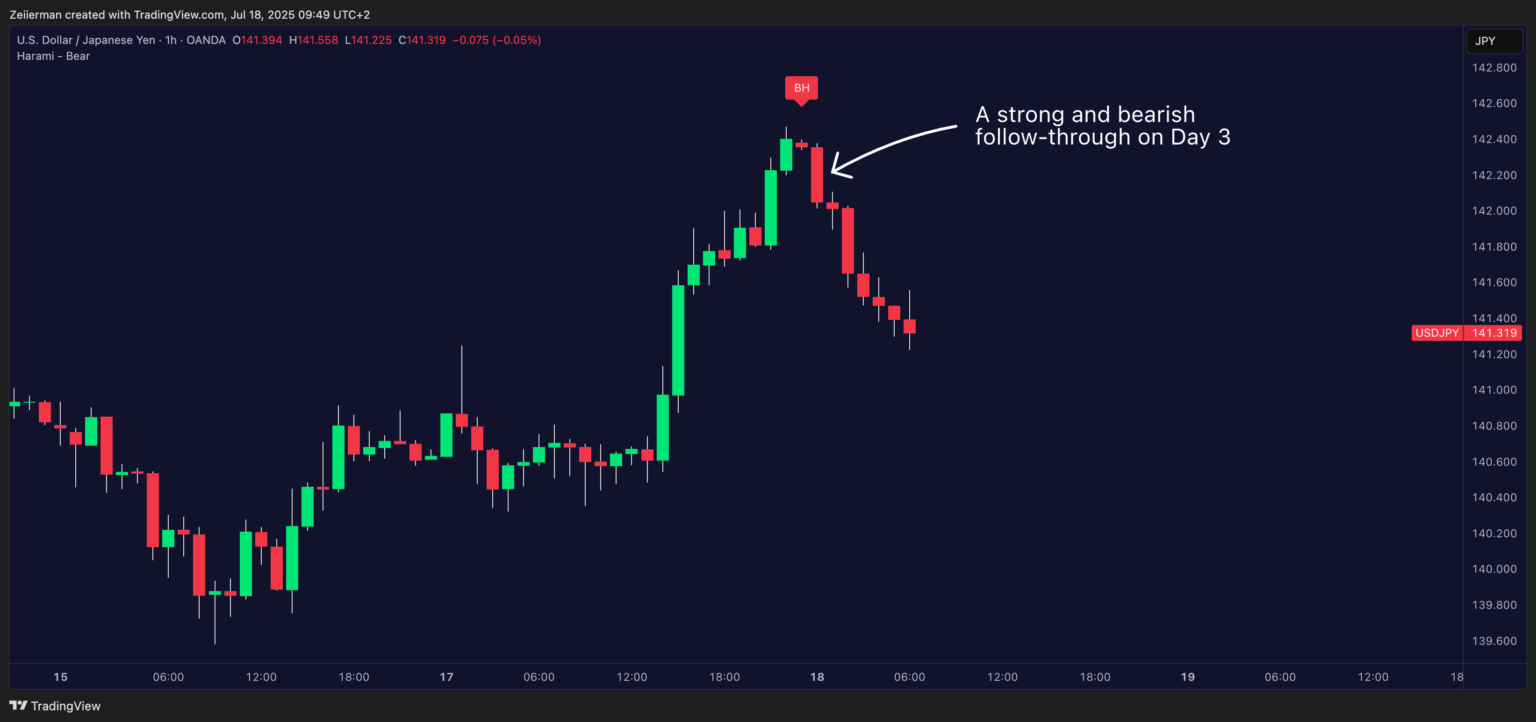
Finally, we need to look for confirmation. You need a strong and bearish follow-through on Day 3. This means a RED candle closing BELOW THE LOW of the Baby candle (Day 2). Moreover, a gap down below the baby candle’s low at the opening of Day 3 is amazing for confirmation. This indicates immediate and powerful selling pressure.
Step 2: Enter the trade post breakdown.
Once the confirmation candle closes (or breaks the pattern low during the session), you can consider entering a short position. There are two typical entry options:
- Conservative Entry: Wait for the confirmation candle to close, then enter a short at the next session’s opening.
- Aggressive Entry: Enter short on the close of the second candle (the small red one).
Step 3: Place your stop-loss and take-profit targets.
Risk management is non-negotiable here. A logical place for your stop-loss is just above the high of the Bearish Harami pattern. If the price pushes above that point, the setup is likely to fail.
Your profit target depends on the timeframe and volatility of the asset in question. Here are some smart ways to set your targets:
- The nearest previous minor swing low within the recent uptrend. Easy exit for partial profits.
- Use Fibonacci retracement (38.2% or 50% levels).
- Look for quick 1:1 or 1.5:1 reward ratios, then reassess.
📌 Here are some advanced tips from a pro trader (myself, of course, haha):
- Track every harami pattern trade – wins, losses, and lessons learned. You’ll start noticing patterns in your actions.
- Check whether your daily Harami pattern aligns with weekly resistance or monthly trend changes. This stacking of timeframes can really improve your odds.
- Spend time reviewing how harami patterns performed in your chosen markets over the past years. This builds confidence and helps you identify legitimate setups.
4. What is a Bearish Harami Cross?
The Bearish Harami Cross is a stronger variation of the traditional Bearish Harami candlestick pattern. While the standard version features a small-bodied candle tucked within the range of a large bullish candle, the Harami Cross replaces that small body with a Doji. For those unfamiliar, a Doji is a candle where the open and close are nearly identical, signaling extreme indecision or hesitation from both buyers and sellers.
When a Doji appears inside a strong bullish candle, it often signals that the buying pressure is fading. And if it forms at the top of an uptrend or near a key resistance level, it’s often the market’s way of whispering: “Get ready, momentum’s cracking.”
A. How to identify a Bearish Harami Cross on the chart?
To spot a valid Harami Cross, I start by looking for a strong bullish candle that reflects aggressive buying and possibly a new swing high. The very next candle must be a Doji, meaning it opens and closes at nearly the same price. Most importantly, this Doji should be completely inside the body (high-low range) of the previous bullish candle.
Don’t forget that context is everything. The pattern should ideally appear after a clear uptrend or near a resistance level rather than in the middle of a sideways chop. Additionally, if the volume drops off significantly during the Doji candle, that provides an extra confirmation of fading buyer interest.
📌 Pro tip: Mark the midpoint of the bullish candle. If the following candles close below that midpoint, it adds conviction to the bearish setup.
B. How to trade the Bearish Harami Cross?
Once you’ve spotted and confirmed a Bearish Harami Cross, the trading logic stays fairly straightforward. Enter the trade by going short when the price breaks and closes below the Doji’s low. That’s your confirmation. Place your stop just above the high of the mother candle (the large bullish candle). That’s your invalidation zone. If the price reclaims that level, the bearish signal weakens.
For a conservative target, use the recent swing low or nearest support. Alternatively, if you wish to be aggressive, you can project the height of the mother candle downward from the breakdown point. For risk management, I’d recommend trailing with an ATR stop or the PSAR indicator if you’re trading a strong trend reversal. Or you could do both by using our ATR + PSAR Trailing Stop indicator. And as always — don’t just rely on the pattern. Combine it with indicators like RSI, MACD divergence, or a CHoCH zone for stronger setups.
5. How to identify a failing Bearish Harami pattern?
Expect false breakouts: Market makers love hunting stops placed just above harami patterns. Combat this by using slightly wider stops than the obvious level, watching for volume confirmation before entering, and being extra cautious around major news events.
Don’t rely on the pattern alone: The mistake is beginners start using the Bearish Harami as the only signal — no volume check, no RSI, no confluence. You should layer your analysis by using indicators (such as RSI, MACD, and volume), identifying key S/R zones nearby, and watching for confirmation candles. The more boxes you check, the higher your odds of success.
Don’t ignore the broader market context: A bearish harami in a stock won’t mean much if the overall market is in a strong uptrend. Always consider the overall market direction, sector performance, and upcoming economic and geopolitical news or earnings reports.
6. How to Trade Bearish Harami with Technical Indicators?
When you’re doing technical analysis for your next trade, it’s incredibly important to confirm the pattern you’re seeing with additional tools. It adds an extra layer of security and filters against false market signals. Since the Bearish Harami is a momentum-reversal signal, it works best when paired with momentum indicators and supported by volume-based confirmation.
As for @Zeiierman and I, we prefer using indicators such as the Relative Strength Index (RSI), Stochastic RSI, and the Moving Average Convergence Divergence (MACD). These momentum-focused indicators work well with the Bearish Harami pattern, as the pattern in front of you can be validated by confirming the overbought and oversold levels that the momentum-based indicators signal.
A. Trading Bullish Harami with RSI and Stochastic RSI
Confluence is very important when trading a Bearish Harami setup. That’s where indicators like RSI and Stochastic RSI shine — especially in flagging overbought zones before a reversal.
Wait for a Bearish Harami to form after an uptrend. As long as it’s not formed in a sideways market, confirm that the RSI is above 70 – this signals the market is in overbought territory. Finally, check your Stochastic RSI; we want to see a bearish crossover above 80. This combination suggests the momentum is fading, and sellers might step in. On shorter timeframes (5 minutes–15 minutes), RSI-based signals can be noisy. I would pair them with SMC structure breaks or volume divergence for better accuracy.
📌 Our Relative Strength Index (RSI) and Stochastic Signal indicators are absolutely free and available for everyone. Check them out today.
Read: RSI vs Stochastic RSI: A Comprehensive Guide for Trading BeginnersB. Trading Bullish Harami with MACD
The MACD is a popular tool for spotting trend shifts, and it complements the Bearish Harami setup beautifully. Wait for a Bearish Harami to form near resistance or after a strong uptrend. Open your MACD and check if the MACD line is above the Signal line and has started to curl downward.
Ideally, you want to see a bearish crossover forming, especially if MACD histogram bars start shrinking. This signals waning bullish momentum and supports the possibility of a price reversal.
We also offer a combination of indicators that combine RSI and MACD to utilize momentum and crossover logic in a single, streamlined view. It is perfect for those seeking to simplify their charting experience without missing any important data. Check out our two free indicators by getting access through our website:
C. Trading Bullish Harami with Fibonacci Retracements
Using Fibonacci retracement levels alongside a Bearish Harami gives you structure for setting entries and targets. Draw a Fibonacci retracement from the recent swing low to swing high (i.e., the move that preceded the Harami). Check this article to learn how to calculate Fibonacci Retracement levels.
If the Bearish Harami forms near a key Fib level — especially 61.8% or 78.6% — treat it as a high-probability signal. Wait for a break below the Doji or second candle’s low, then set targets near the next major Fib levels (e.g., 38.2%, 23.6%). This works best when the pattern aligns with key supply zones or previous market structure.
Read: Fibonacci Retracement Levels: Best Settings and Timeframes for TradingViewD. Confirming Bullish Harami with Volume Profile
The Volume Profile is a hidden gem when confirming Harami setups. It tells you what price doesn’t. Use a Volume Profile indicator to scan the consolidation or rally preceding the Bearish Harami. If the pattern forms near a high-volume node (HVN) and then pulls back, it shows buyer exhaustion at a fair value zone. Alternatively, a Harami that forms right after the price fails to climb into a low-volume area (LVN rejection) is another powerful confluence. This method filters false breakouts and sharpens your edge.
Check out our plethora of Volume & Volatility indicators (both free and premium) to uplift your trading game.
E. Trading Bearish Harami with Moving Averages (MA)
Moving Averages (MAs) are trend indicators, but they can also serve as dynamic confirmation tools. I start by adding a 20-period and 50-period EMA onto my chart. If the Bearish Harami forms right below one of these moving averages, and the price fails to close above it — consider that a rejection.
The best-case scenario is when the 20 EMA crosses below the 50 EMA after the pattern. It is a time-tested trigger for trend reversal. Combine this with a shift in RSI or MACD (or both) to further stack probability and you’re in for a profitable trade.
F. Trading Bearish Harami with Bollinger Bands
Bollinger Bands help contextualize volatility and price extremes. They’re perfect for spotting exhaustion. If the first candle of the Bearish Harami pierces the upper Bollinger Band and the second one retreats inside, you’ve got yourself a mean reversion setup.
On the contrary, it’s a strong rejection signal if volume also declines on the second candle. Use the middle band (20 SMA) as your first target and the lower band for aggressive take-profits.
📌 Tip: Look for Bollinger Band squeeze preceding the Harami — the tighter the bands, the more explosive the potential move.
7. Difference B/W Bearish and Bullish Harami
While both patterns are part of the Harami candlestick family, they signal opposite outcomes and appear in different market contexts.
| Feature | Bearish Harami | Bullish Harami |
|---|---|---|
| Market Context | Appears after an uptrend | Appears after a downtrend |
| First Candle | Large bullish candle indicating strong buying pressure | Large bearish candle showing strong selling pressure |
| Second Candle | Small-bodied bearish candle within the prior candle’s body | Small-bodied bullish candle within the prior candle’s body |
| Signal | Suggests trend reversal to downside | Suggests trend reversal to upside |
| Psychological Meaning | Bulls are losing steam, bears are stepping in | Bears are losing control, bulls are gaining ground |
| Stronger Variation | Bearish Harami Cross (second candle is a Doji) | Bullish Harami Cross (second candle is a Doji) |
Frequently Asked Questions (FAQs)
A. What happens if the harami pattern fails and the price continues to rise?
Failed patterns are part of the game. This is why you use stop losses. When a harami pattern fails, it often leads to explosive moves higher as shorts get squeezed. Your stop should be just above the first candle’s high. If it triggers, step aside and wait for the next setup.
📌 Pro Tip: Never average down or try to “make the pattern work.”
B. Can the Bearish Harami be used in crypto and forex markets?
The Bearish Harami isn’t limited to stocks. It’s a price action pattern, which is universal. In fact, many crypto traders rely heavily on Harami pattern setups, especially on 4H charts and above, since crypto often has extended trends followed by sharp reversals.
C. What’s the difference between a bearish harami and a bearish engulfing pattern?
Bearish engulfing has the second candle completely swallowing the first candle’s body, it’s bigger and more aggressive. Bearish Harami has the second candle sitting inside the first one’s body, smaller and showing hesitation rather than outright reversal. Engulfing patterns are stronger signals but less common.
SM_Trader
SM_Trader is a highly experienced coder and strategy developer who brings the most complex algorithms to life. As a member of MENSA, the prestigious organization for individuals with intelligence scores in the top 2% of the world, he combines exceptional analytical skills with a keen eye for numbers and statistics, empowering businesses to grow at the right pace and in the right direction.
More from SM_Trader