Works on the Following Platforms
TradingView
For use on the TradingView platform
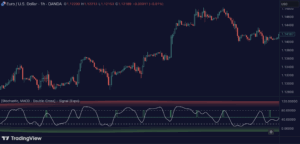
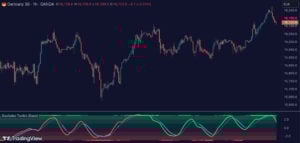
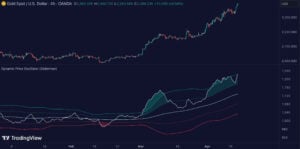
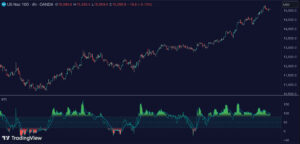
The Stochastic Signal Indicator is a robust tool developed by Zeiierman to leverage the predictive power of the stochastic oscillator. This indicator is designed to identify potential buy and sell signals by assessing overbought and oversold conditions in the market.
How the Indicator Works
This indicator employs the traditional stochastic oscillator, which is a momentum indicator comparing a particular closing price of a security to a range of its prices over a certain period of time. The sensitivity of the oscillator to market movements is adjustable via input settings, making it versatile for various trading styles.
Key Features and Settings
- Stochastic Settings: Users can modify parameters such as the %K period, %D period, and the smoothing of these values to fine-tune the indicator to different market conditions.
- Signal Thresholds: The indicator allows for customization of overbought and oversold thresholds, which can be set to trigger alerts when crossed by the stochastic values.
- Visualization: It plots the stochastic values dynamically, providing visual cues that can help in decision-making regarding entry and exit points.
Usage and Strategy
The Stochastic Signal Indicator can be utilized in multiple ways:
- Trend Confirmation: By adjusting the sensitivity of the oscillator, traders can confirm whether the current market trend aligns with the buying or selling signals provided by the stochastic readings.
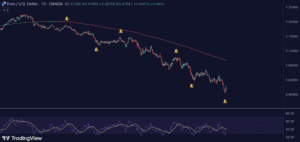
- Oversold and Overbought Conditions: Traders can set specific thresholds to identify potential reversal points in the market, allowing for strategic placements of buy or sell orders.
- Customizable Alerts: The indicator provides options to set alerts for crossing over key stochastic levels, which helps in automating part of the trading process and managing entry points more efficiently.
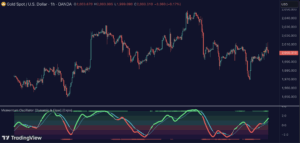
Divergences
All types of momentum oscillator indicators produce divergences and so does Stochastics. Divergences occur when the oscillator deviates from the trending price action. Bullish divergence is then when the trending price makes a lower low but the oscillator makes a higher low. Bearish divergence is then when the trending price makes a higher high but the oscillator makes a lower high.
Conclusion
The Stochastic Signal Indicator by Zeiierman is an effective tool for traders who rely on technical analysis to guide their trading decisions. Its ability to analyze market momentum and provide timely signals makes it a valuable addition to any trader’s toolkit. By integrating this tool into their trading strategy, users can enhance their market analysis and potentially increase their trading success rates.
Zeiierman
With over 16 years in the market, Zeiierman has extensive experience as a full-time trader and risk advisory consultant for hedge funds. He has developed many profitable trading strategies, drawing on his background in risk management and strategy execution.
More from Zeiierman