Works on the Following Platforms
TradingView
For use on the TradingView platform
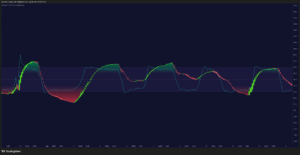
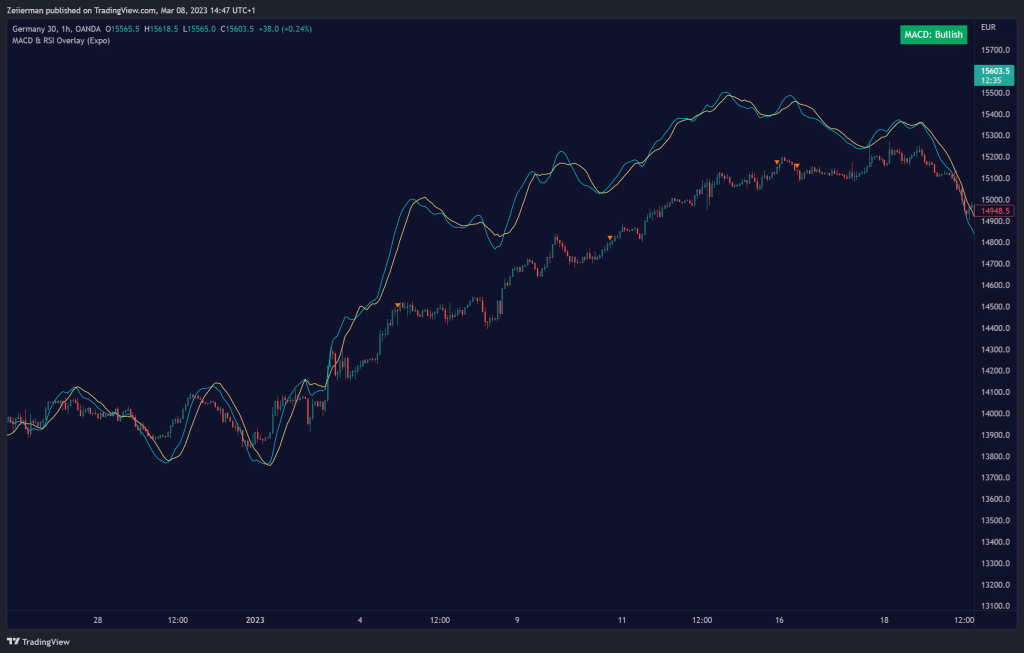
The MACD & RSI Overlay (Expo) trading indicator is a technical analysis tool that combines two popular indicators, the Relative Strength Index (RSI [14]) and the Moving Average Convergence Divergence (MACD [12,26]), and overlays them onto the price chart. The indicator oscillates relative to price, so it plots the RSI and MACD around price while still displaying the same insights as the regular MACD and RSI indicators. This feature gives traders a unique perspective, allowing them to see the relationship between price, momentum, and trend in a single chart.
This indicator is a valuable addition to any trader’s technical analysis toolkit, whether they are a beginner or an experienced trader.
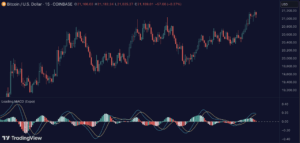
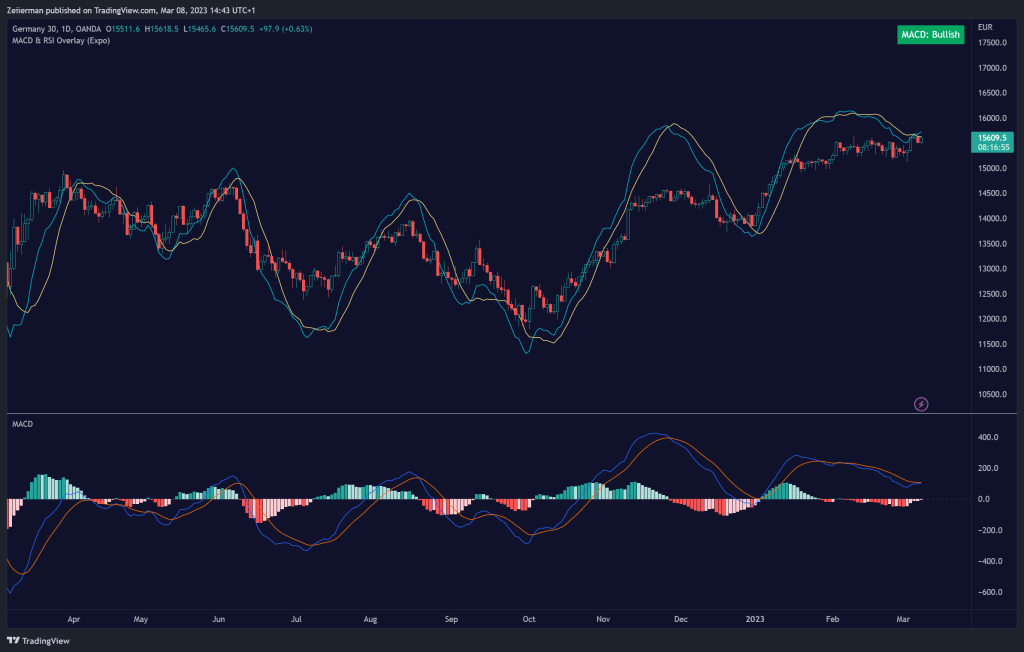
MACD
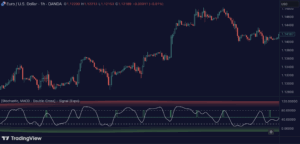
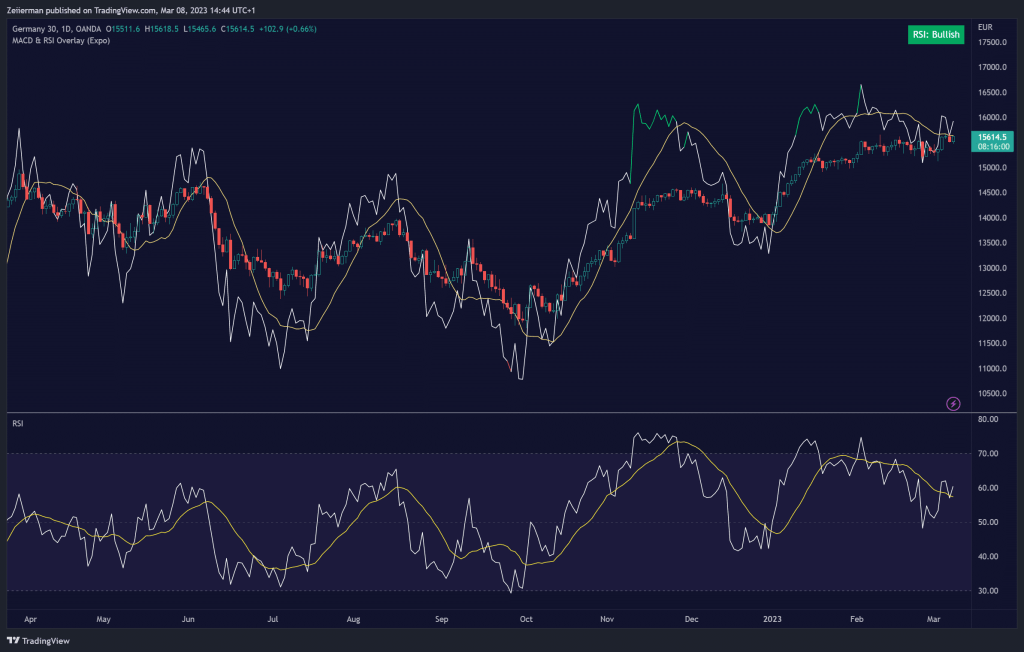
RSI
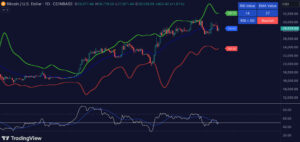
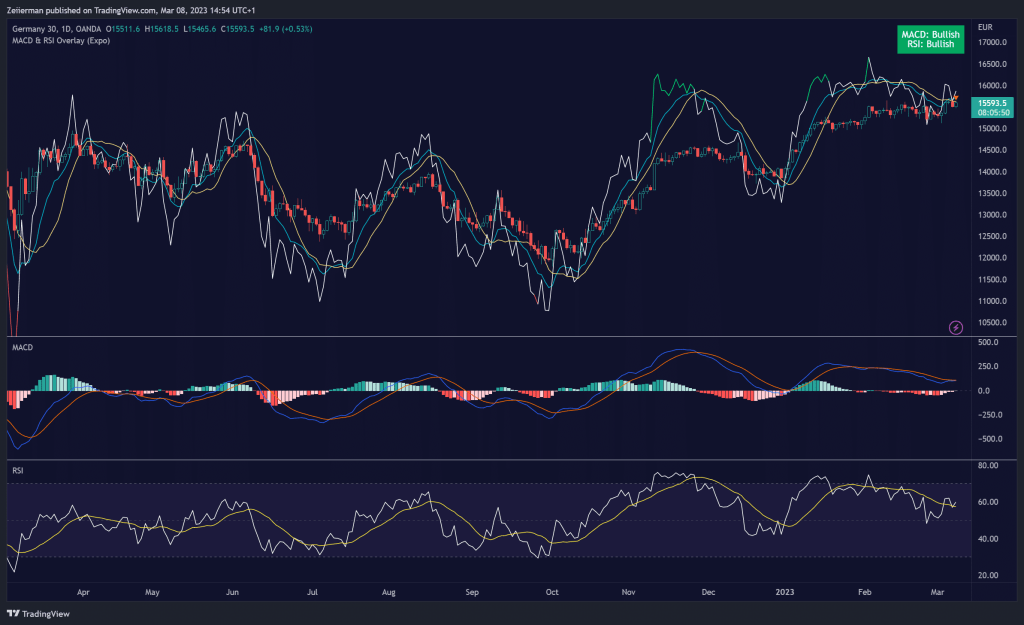
MACD and RSI
Trend Feature
What sets the MACD & RSI Overlay indicator apart is its ability to factor in the underlying trend. This feature makes the indicator more useful than ever before, as traders can use it to filter trades in the direction of the trend. By considering the underlying trend, traders can gain valuable insights into market trends.
Benefits
One of the primary benefits of having the MACD and RSI plotted directly on the price chart is that it provides a more intuitive understanding of the relationship between price, momentum, and trend. Traders can quickly identify the direction of the trend by observing the price movement relative to the MACD and RSI lines. In addition, by having these indicators plotted on the chart, traders can quickly identify potential buy and sell signals and develop new trading strategies.
How to use the MACD & RSI indicator
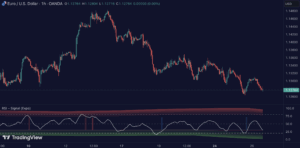
One of the most popular strategies is to use the MACD & RSI Overlay indicator to look for crossings. A crossing occurs when the MACD and RSI lines cross over each other or when they cross over the signal line. These crossings can signal potential trend reversals and momentum shifts. For example, if the MACD line crosses over the signal line from below, it could indicate a bullish signal, while a cross from above could indicate a bearish signal.
Zeiierman
With over 16 years in the market, Zeiierman has extensive experience as a full-time trader and risk advisory consultant for hedge funds. He has developed many profitable trading strategies, drawing on his background in risk management and strategy execution.
More from Zeiierman