Works on the Following Platforms
TradingView
For use on the TradingView platform
Fibonacci retracement is a popular technical analysis method to draw support and resistance levels. The Fibonacci levels are calculated between 2 swing points (high/low) and divided by the key Fibonacci coefficients equal to 23.6%, 38.2%, 50%, 61.8%, and 100%. The percentage represents how much of a prior move the price has retraced.
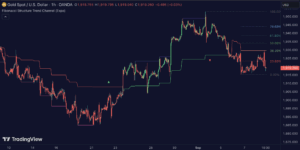
Our Auto Fibonacci Retracement indicator analyzes the market in real-time and draws Fibonacci levels automatically for you on the chart. Real-time fib levels use the current swing points, which gives you a huge advantage when using them in your trading. You can always be sure that the levels are calculated from the correct swing high and low, regardless of the current trend. The algorithm has a trend filter and shifts the swing points if there is a trend change.
The user can set the preferred swing move to scalping, trend trading, or swing trading. This way, you can use our automatic fib indicator to do any trading. The auto fib works on any market and timeframe and displays the most important levels in real-time for you.
This Auto Fib Retracement indicator for TradingView is powerful since it does the job for you in real-time. Apply it to the chart, set the swing move to fit your trading style, and leave it on the chart. The indicator does the rest for you. The auto Fibonacci indicator calculates and plots the levels for you in any market and timeframe. In addition, it even changes the swing points based on the current trend direction, allowing traders to get the correct Fibonacci levels in every trend.
How does the Auto Fib Draw the levels?
The algorithm analyzes the recent price action and examines the current trend; based on the trend direction, two significant swings (high and low) are identified, and Fibonacci levels will then be plotted automatically on the chart. If the algorithm has identified an uptrend, it will calculate the Fibonacci levels from the swing low and up to the swing high. Similarly, if the algorithm has identified a downtrend, it will calculate the Fibonacci levels from the swing high and down to the swing low.
HOW TO USE
The levels allow for a quick and easy understanding of the current Fibonacci levels and help traders anticipate and react when the price levels are tested. In addition, the levels are often used for entries to determine stop-loss levels and to set profit targets. It’s also common for traders to use Fibonacci levels to identify resistance and support levels.
Traders can set alerts when the levels are tested.


![AB=CD [Real-Time]](https://www.zeiierman.com/wp-content/uploads/2025/09/66b4d792d8a79e89871d21e4_AB3DCD205BReal-Time5D-300x148.jpg)
