Works on the Following Platforms
TradingView
For use on the TradingView platform
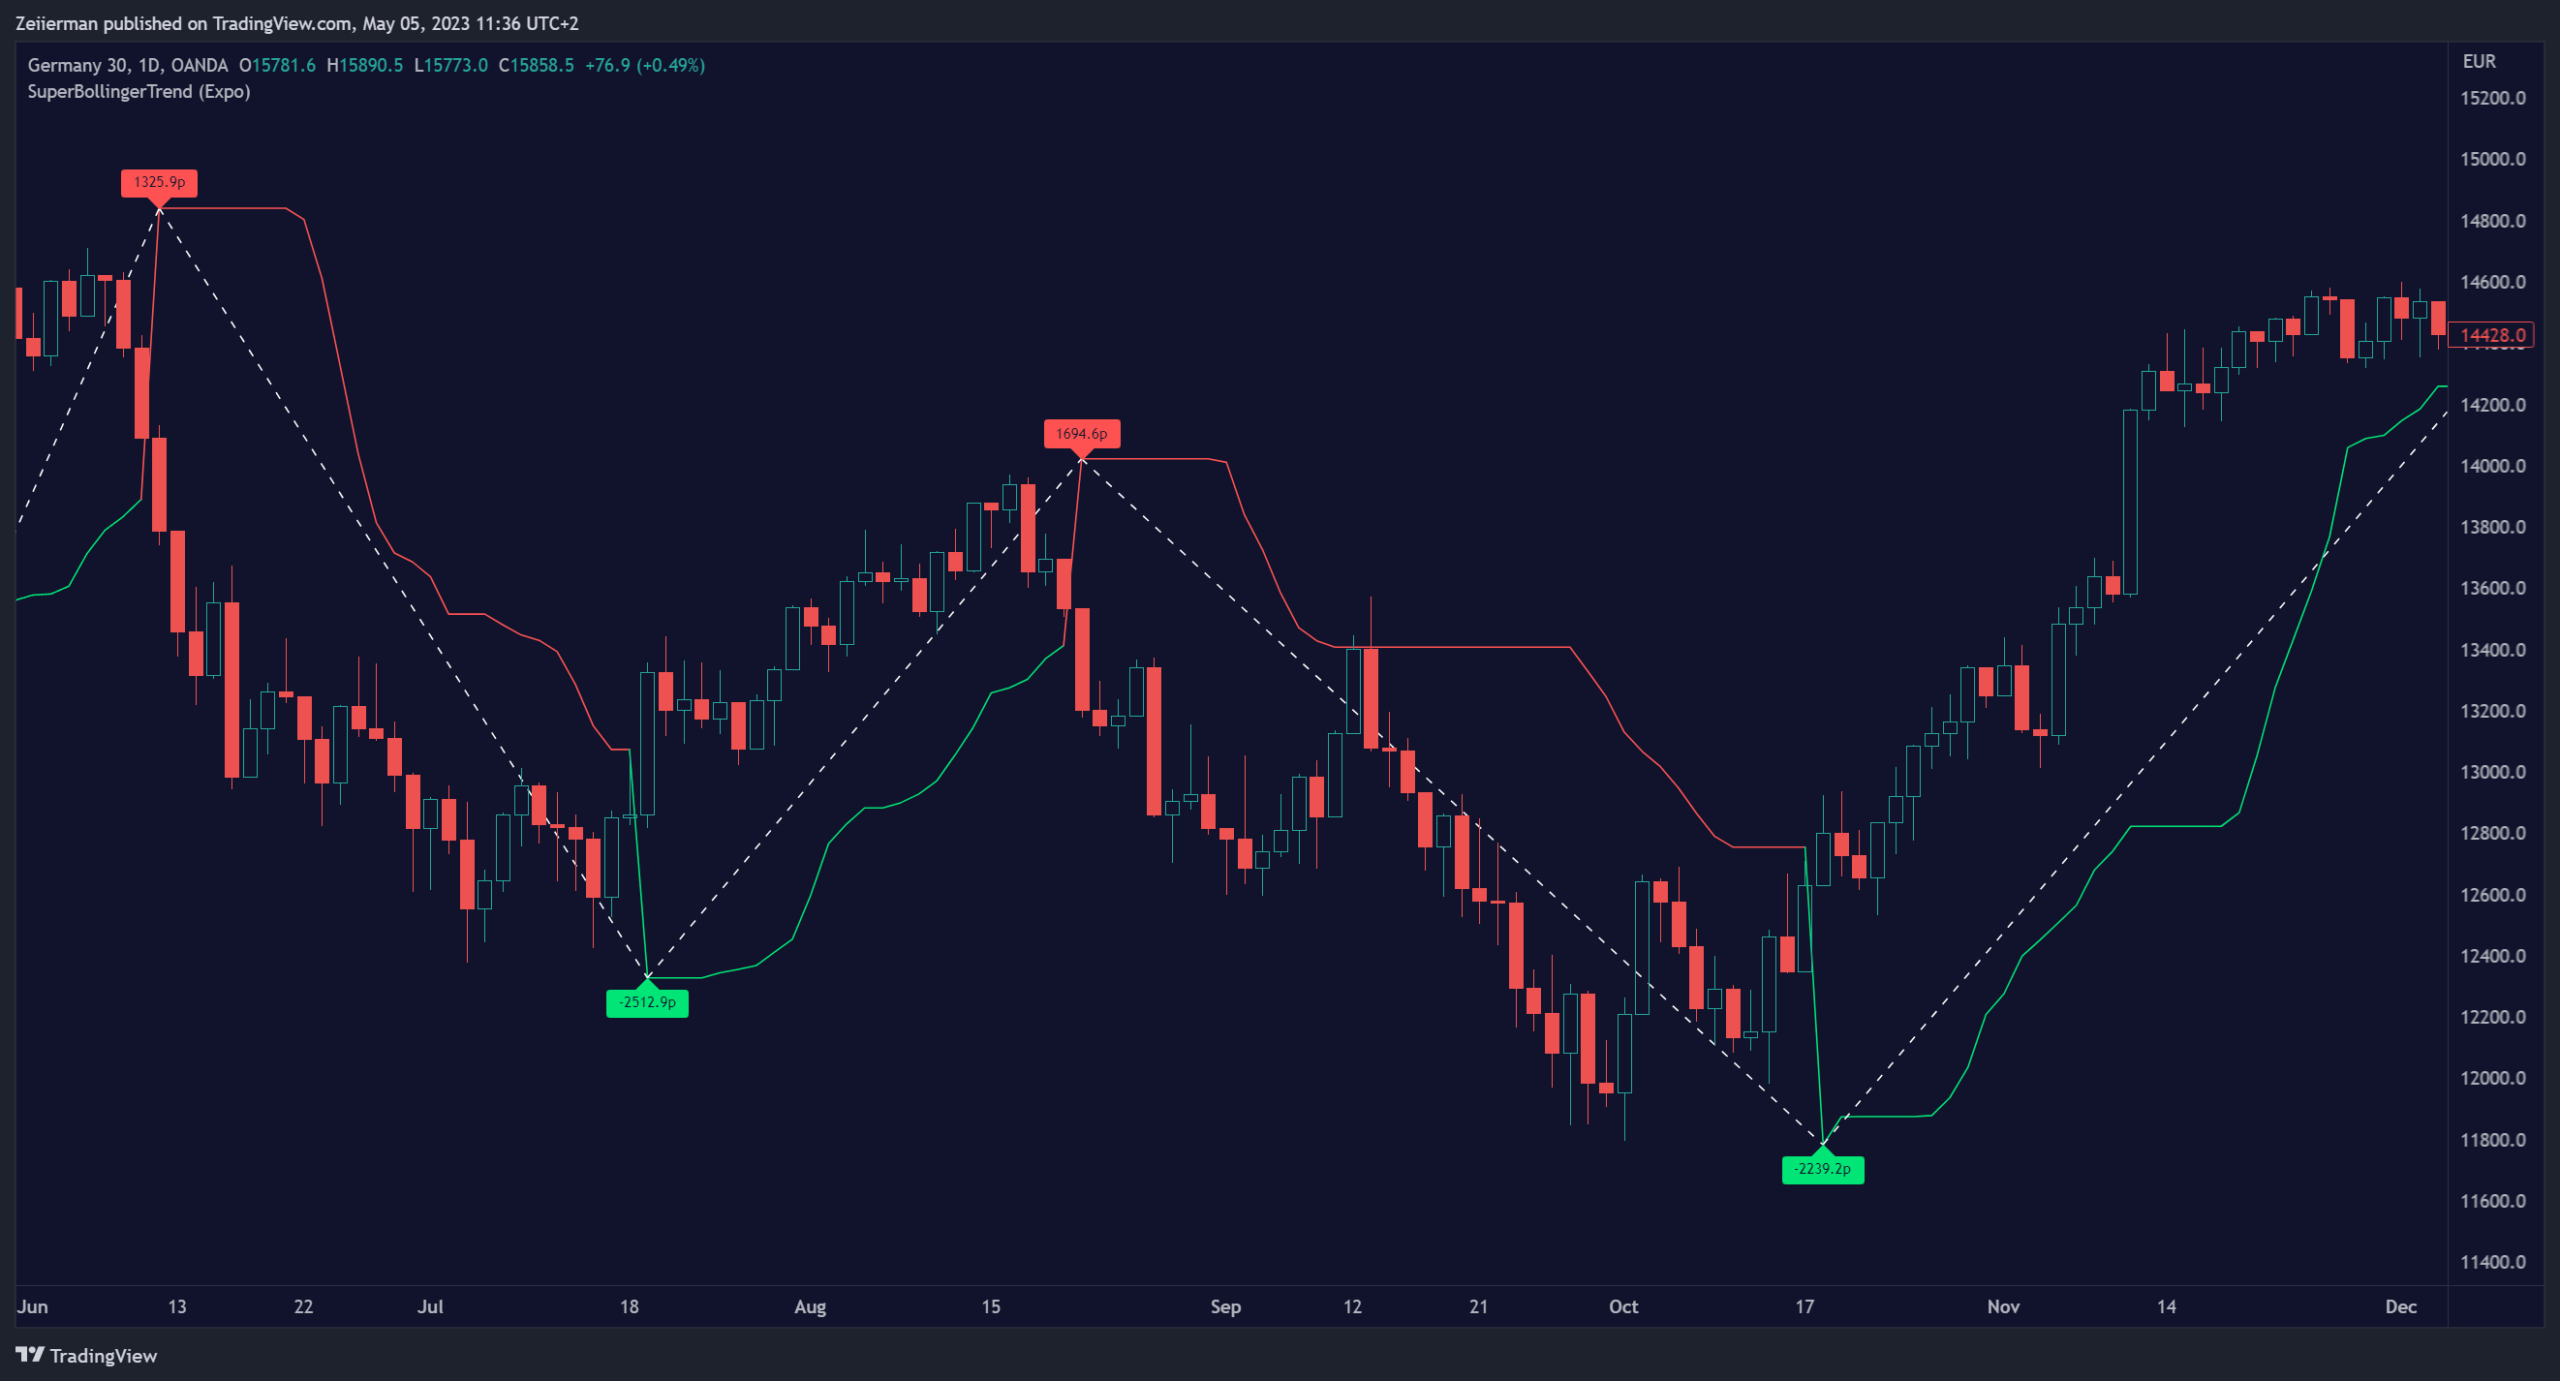
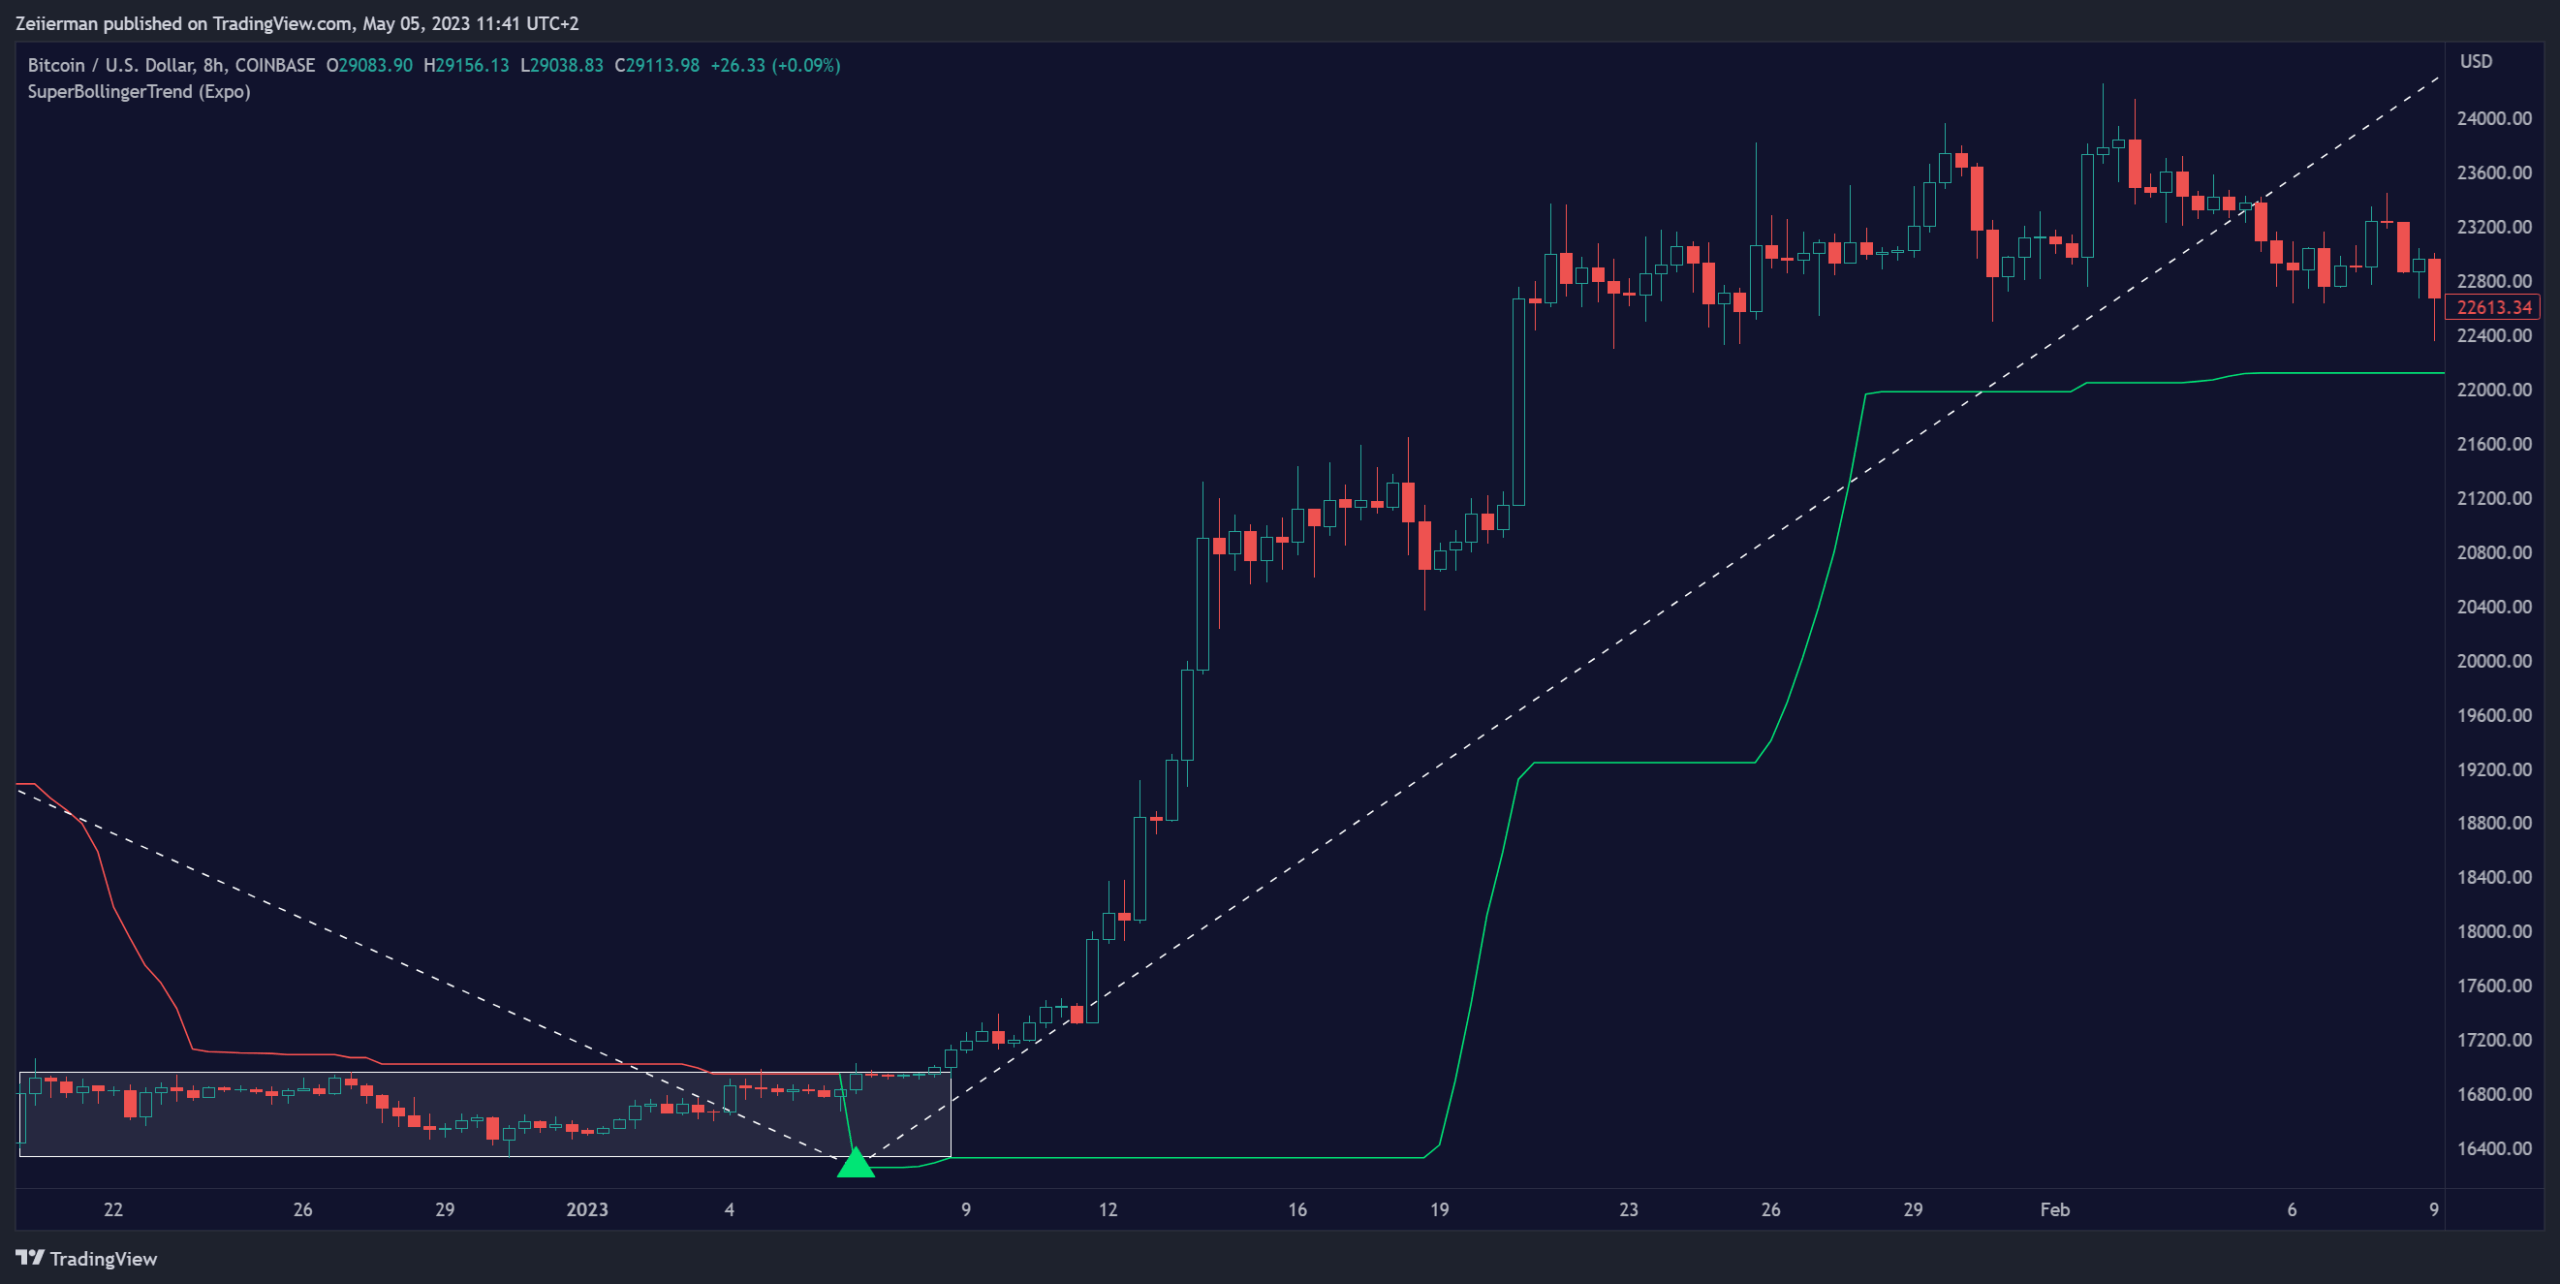
The SuperBollingerTrend indicator is a combination of two popular technical analysis tools, Bollinger Bands, and SuperTrend. By fusing these two indicators, SuperBollingerTrend aims to provide traders with a more comprehensive view of the market, accounting for both volatility and trend direction. By combining trend identification with volatility analysis, the SuperBollingerTrend indicator provides traders with valuable insights into potential trend changes. It recognizes that high volatility levels often accompany stronger price momentum, which can result in the formation of new trends or the continuation of existing ones.
How Volatility Impacts Trends
Volatility can impact trends by expanding or contracting them, triggering trend reversals, leading to breakouts, and influencing risk management decisions. Traders need to analyze and monitor volatility levels in conjunction with trend analysis to gain a comprehensive understanding of market dynamics.
How to use
Trend Reversals:
High volatility can result in more dramatic price fluctuations, which may lead to sharp trend reversals. For example, a sudden increase in volatility can cause a bullish trend to transition into a bearish one, or vice versa, as traders react to significant price swings.
Volatility Breakouts:
Volatility can trigger breakouts in trends. Breakouts occur when the price breaks through a significant support or resistance level, indicating a potential shift in the trend. Higher volatility levels can increase the likelihood of breakouts, as they indicate stronger market momentum and increased buying or selling pressure. This indicator triggers when the volatility increases, and if the price is near a key level when the indicator alerts, it might trigger a great trend.
Features
Peak Signal Move
The indicator calculates the peak price move for each ZigZag and displays it under each signal. This highlights how much the market moved between the signals.
Average ZigZag Move
All price moves between two signals are stored, and the average or the median is calculated and displayed in a table. This gives traders a great idea of how much the market moves on average between two signals.
Take Profit
The Take Profit line is placed at the average or the median price move and gives traders a great idea of what they can expect in average profit from the latest signals.
Zeiierman
With over 16 years in the market, Zeiierman has extensive experience as a full-time trader and risk advisory consultant for hedge funds. He has developed many profitable trading strategies, drawing on his background in risk management and strategy execution.
More from Zeiierman