Works on the Following Platforms
TradingView
For use on the TradingView platform
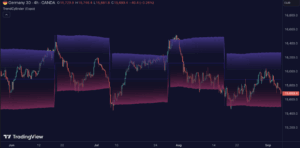
Range Band calculates the most relevant price range by measuring an asset’s volatility and price movements. Identifying ranges in trading is extremely important for traders to assess the current market and make informed decisions about when to enter and exit positions.
By identifying ranges, traders can identify support and resistance levels, and use these levels to determine when to enter and exit a trade. Ranges also help traders to identify potential set stop-loss and take-profit levels. Additionally, ranges can help traders to identify potential trends and reversals, and to identify opportunities for trading.
Range Band is exceptionally well designed and can be used in any market and timeframe.
How to use Range Band
Identify potential trading opportunitiesFor example, if the price is bouncing between the upper and lower range bands, it may indicate that traders could potentially profit from short-term contrarian trades. Similarly, if the price is trading near the upper or lower range band, it may indicate that traders could potentially profit from long-term trend trades.
Price Ranges and SR LevelsRange bands help traders identify price ranges that are likely to be profitable. It is a graphical representation of price movement and is typically used to identify support and resistance levels. Range bands are also used to identify potential entry and exit points.
ReversalsRange bands are used in technical analysis to identify potential reversal points in the asset’s price.
TrendsRange bands are used in to identify trends.
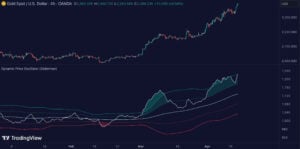
Overbought and Oversold When the price reaches the upper range band, it may indicate that the asset is overbought and that the price is likely to fall. When the price reaches the lower range band, it may indicate that the asset is oversold and that the price is likely to rise.
Range Band features
Range Band has, of course, its powerful band feature, and in addition to that, overbought and oversold areas are added to the bands to highlight when the market is in these areas.
Zeiierman
With over 16 years in the market, Zeiierman has extensive experience as a full-time trader and risk advisory consultant for hedge funds. He has developed many profitable trading strategies, drawing on his background in risk management and strategy execution.
More from Zeiierman