Works on the Following Platforms
TradingView
For use on the TradingView platform
Arithmetic Candlesticks uses complex and logical arithmetic mathematics to create a new way of reading charts. These candlesticks use real price data as the underlying source and aim to output the most relevant and accurate price data to make informed decisions. The advanced and highly innovative arithmetic calculations filter out the noise and smooth the price without significant lag. This makes the chart reading way much more effortless.
What is Arithmetic Candlesticks
Arithmetic Candlesticks is a method of chart analysis based on the use of arithmetic and logical mathematics. This method of chart analysis is rooted in the idea that the market moves in patterns that can be identified and predicted by looking at the numbers of past price movements. With this method, traders and investors can identify and exploit trends that may be hidden in the market noise. This allows the trader to identify trading opportunities that may not be immediately obvious to the naked eye.
Arithmetic Candlesticks provide insight into the underlying momentum, trend, and potential future price movement. This type of analysis is useful for traders who want to quickly scan and identify patterns, trends, and momentum in the market. The system looks for price patterns and trends in an effort to anticipate future price movements. The system is designed to be used by both beginner and experienced traders.
Arithmetic Candlesticks is a powerful tool for traders and investors to gain a better understanding of the underlying trends in the market.
Eliminates price noise
The Arithmetic Candlestick filter is a technical analysis tool used to reduce price noise, which is the randomness in price movement of an asset caused by market participants trading on a short-term basis. The idea behind the filter is that it eliminates the impact of short-term fluctuations in the price, thus providing a more accurate picture of the overall trend.
How to use Arithmetic Candlesticks
Arithmetic Candlesticks is an all-in-one trend and momentum tool that can be used stand-alone or together with other indicators. The main usage is to get a clear chart reading and easily identify trends. The indicator comes with great momentum features that provide insight into the current momentum and the price action‘s strength. This gives traders a unique chart experience that gives valuable insights.The indicator has tons of features, and each an everyone can be used stand-alone or in combination with each other. Read more about the features below.
Trend Trading using the Arithmetic Candlesticks
One of the advantages of Arithmetic Candlesticks is their way of capturing precise trend entries and helping traders to stay longer in trends.
Arithmetic Candlesticks features
The indicator comes with tons of great features that make the indicator into its own system that can be used stand-alone. You find everything from trend reading, entry/exit points, identifying momentum, and auto-stop loss.
Candle Modes:
Choose from three types of arithmetic candle calculations: Arithmetic Candlesticks, Arithmetic + Heikin Ashi, or Impulse + Wicks. Each mode caters to different trading preferences, with volatility-adjusted options for greater responsiveness.
Trend Coloring:
Available in three modes—default, gradient, and advanced—trend coloring enhances long-term trading without altering the candlestick structure.
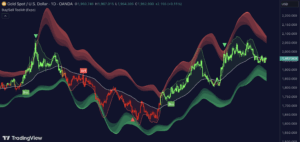
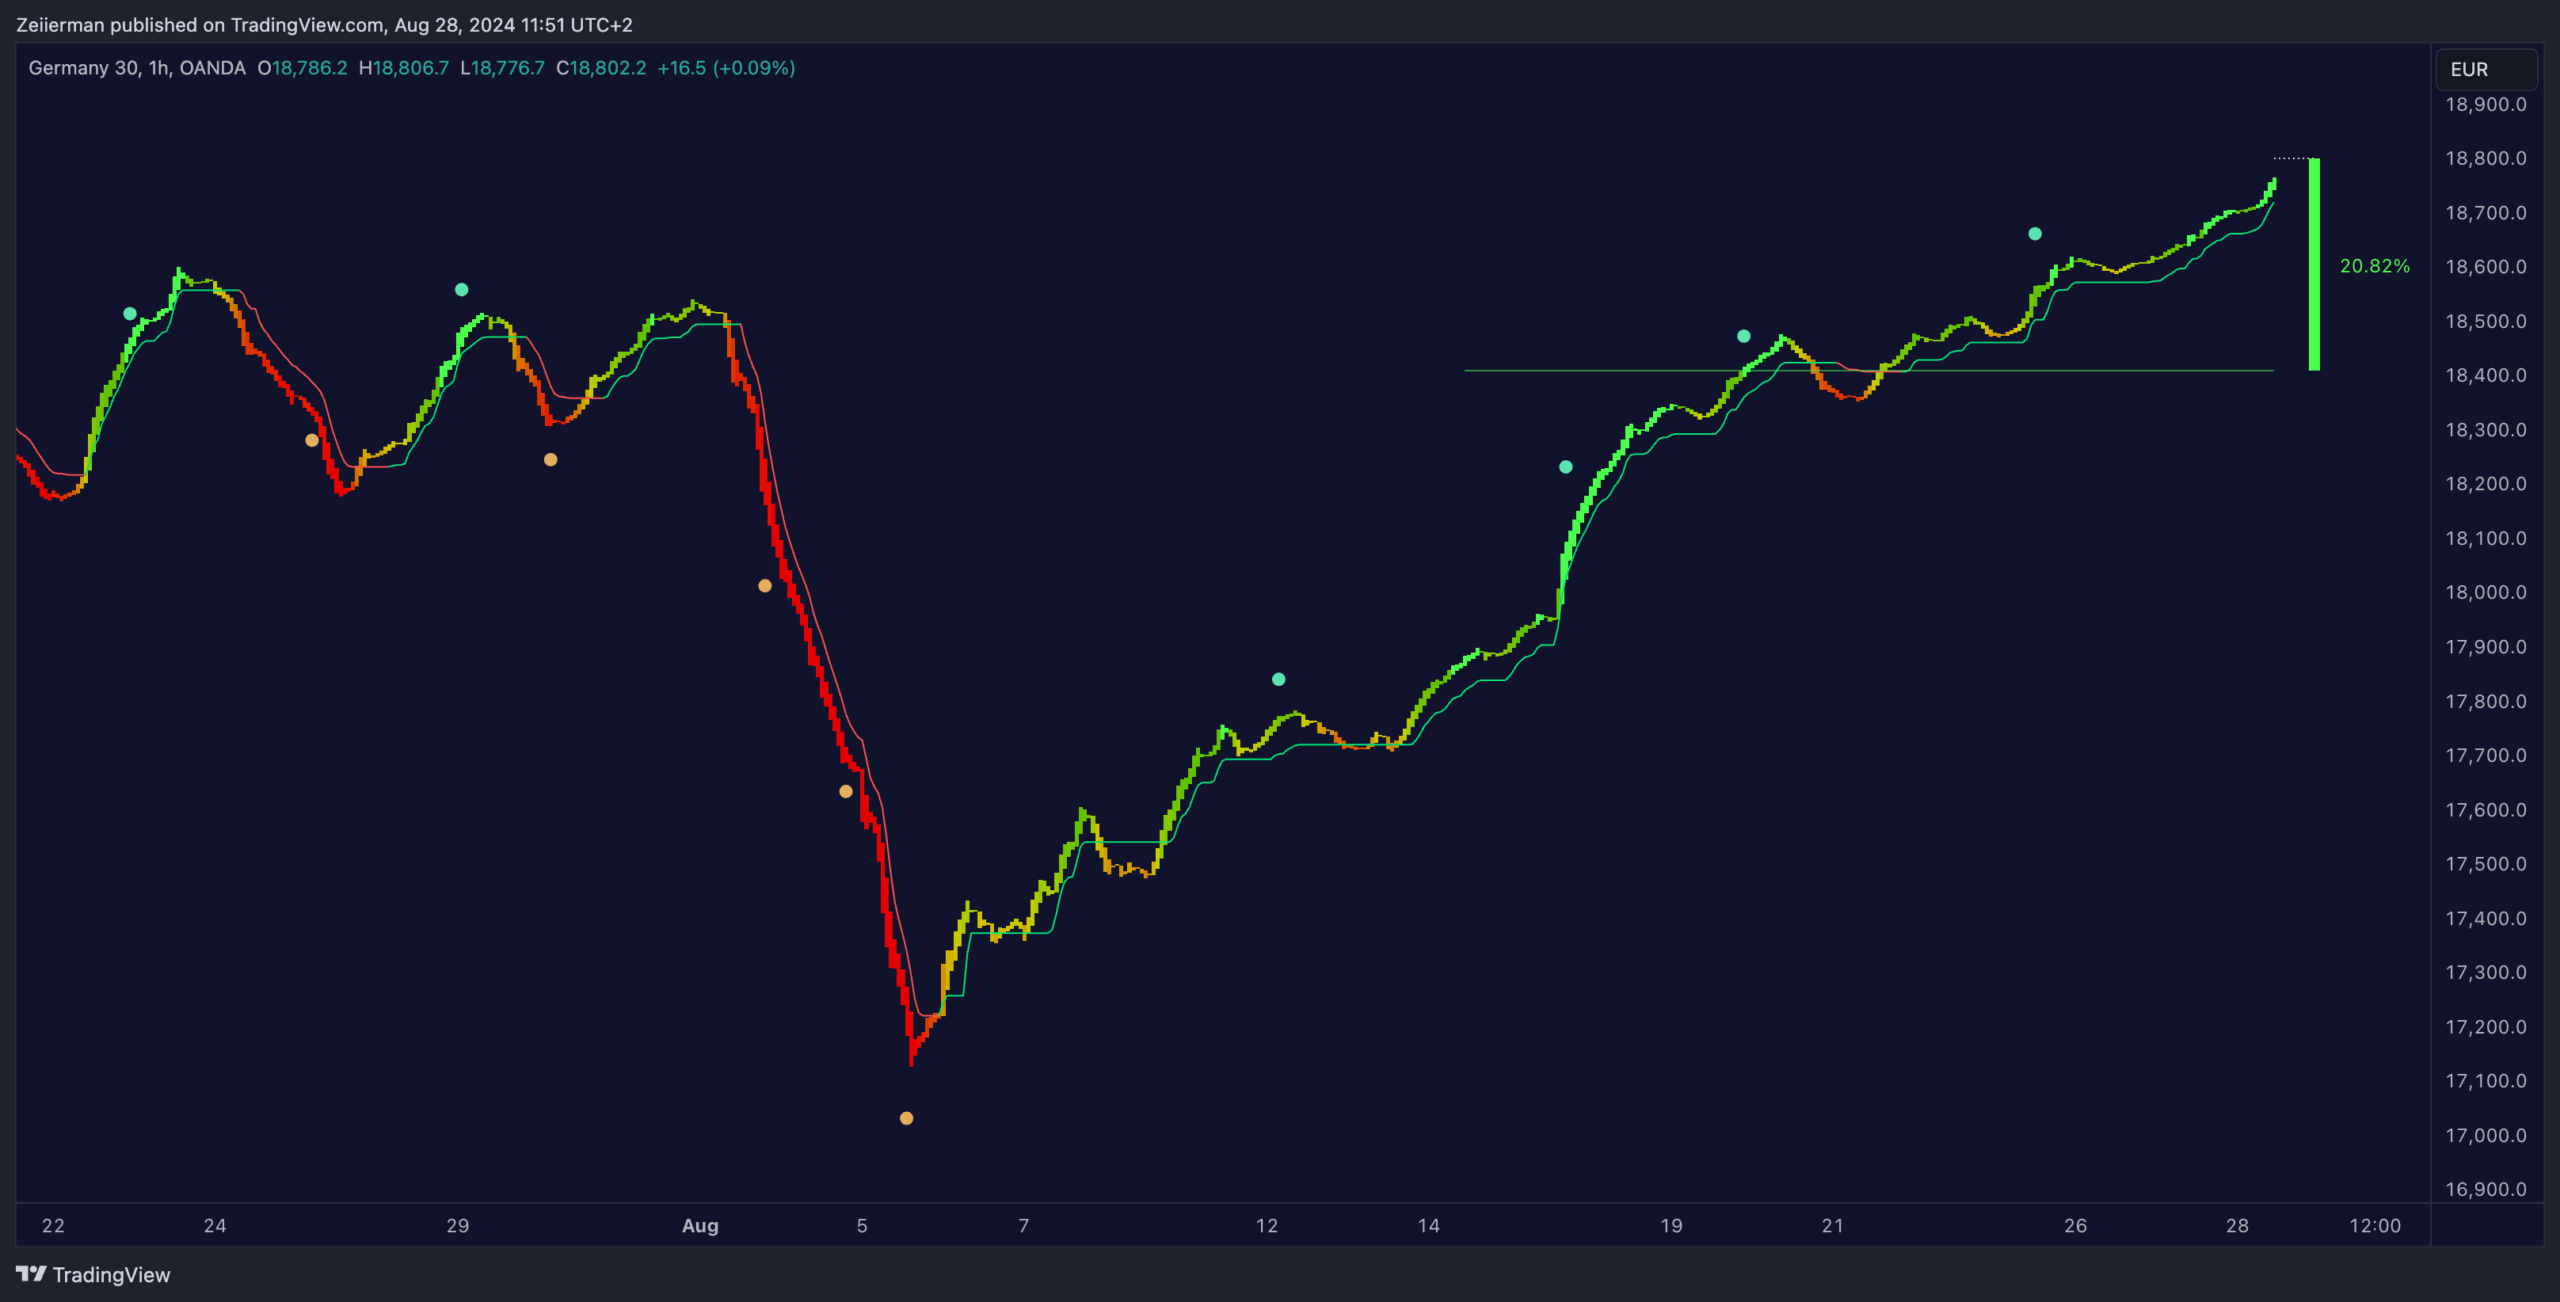
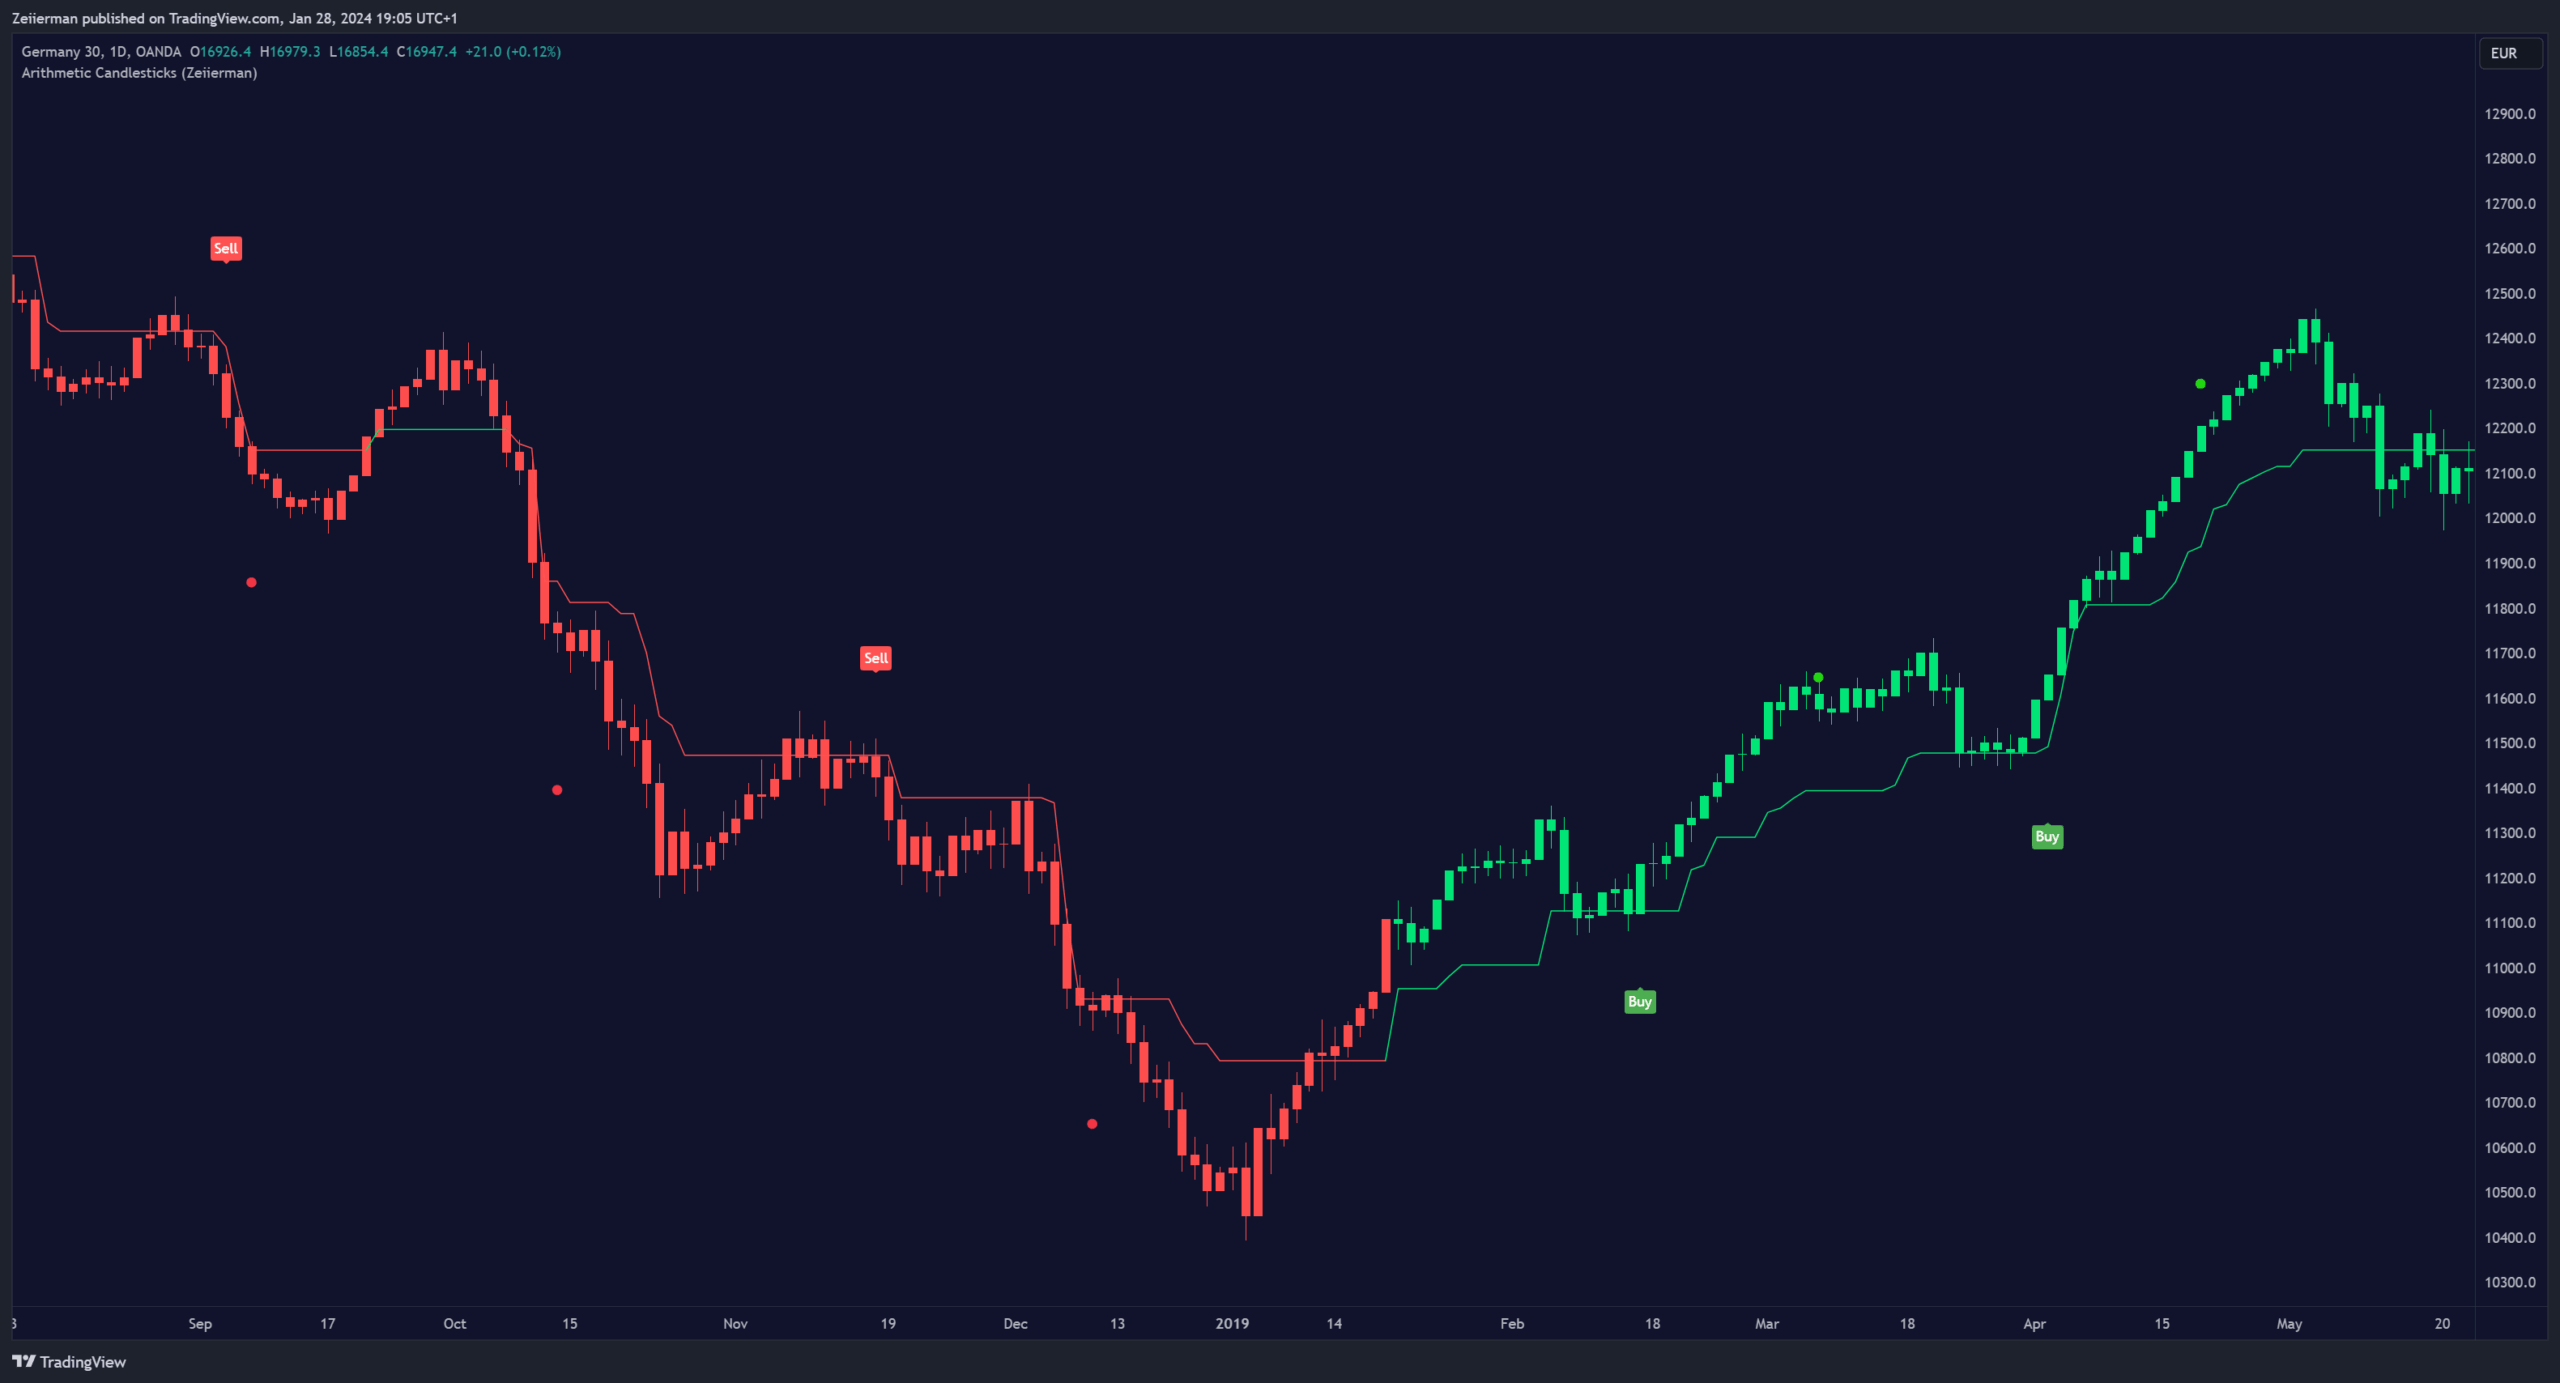
Buy and Sell Signals:
Simplify trend trading with customizable Buy/Sell signals based on candle type and coloring, featuring three filters for precision. Take Profit and Adaptive Stop Loss options are also available.
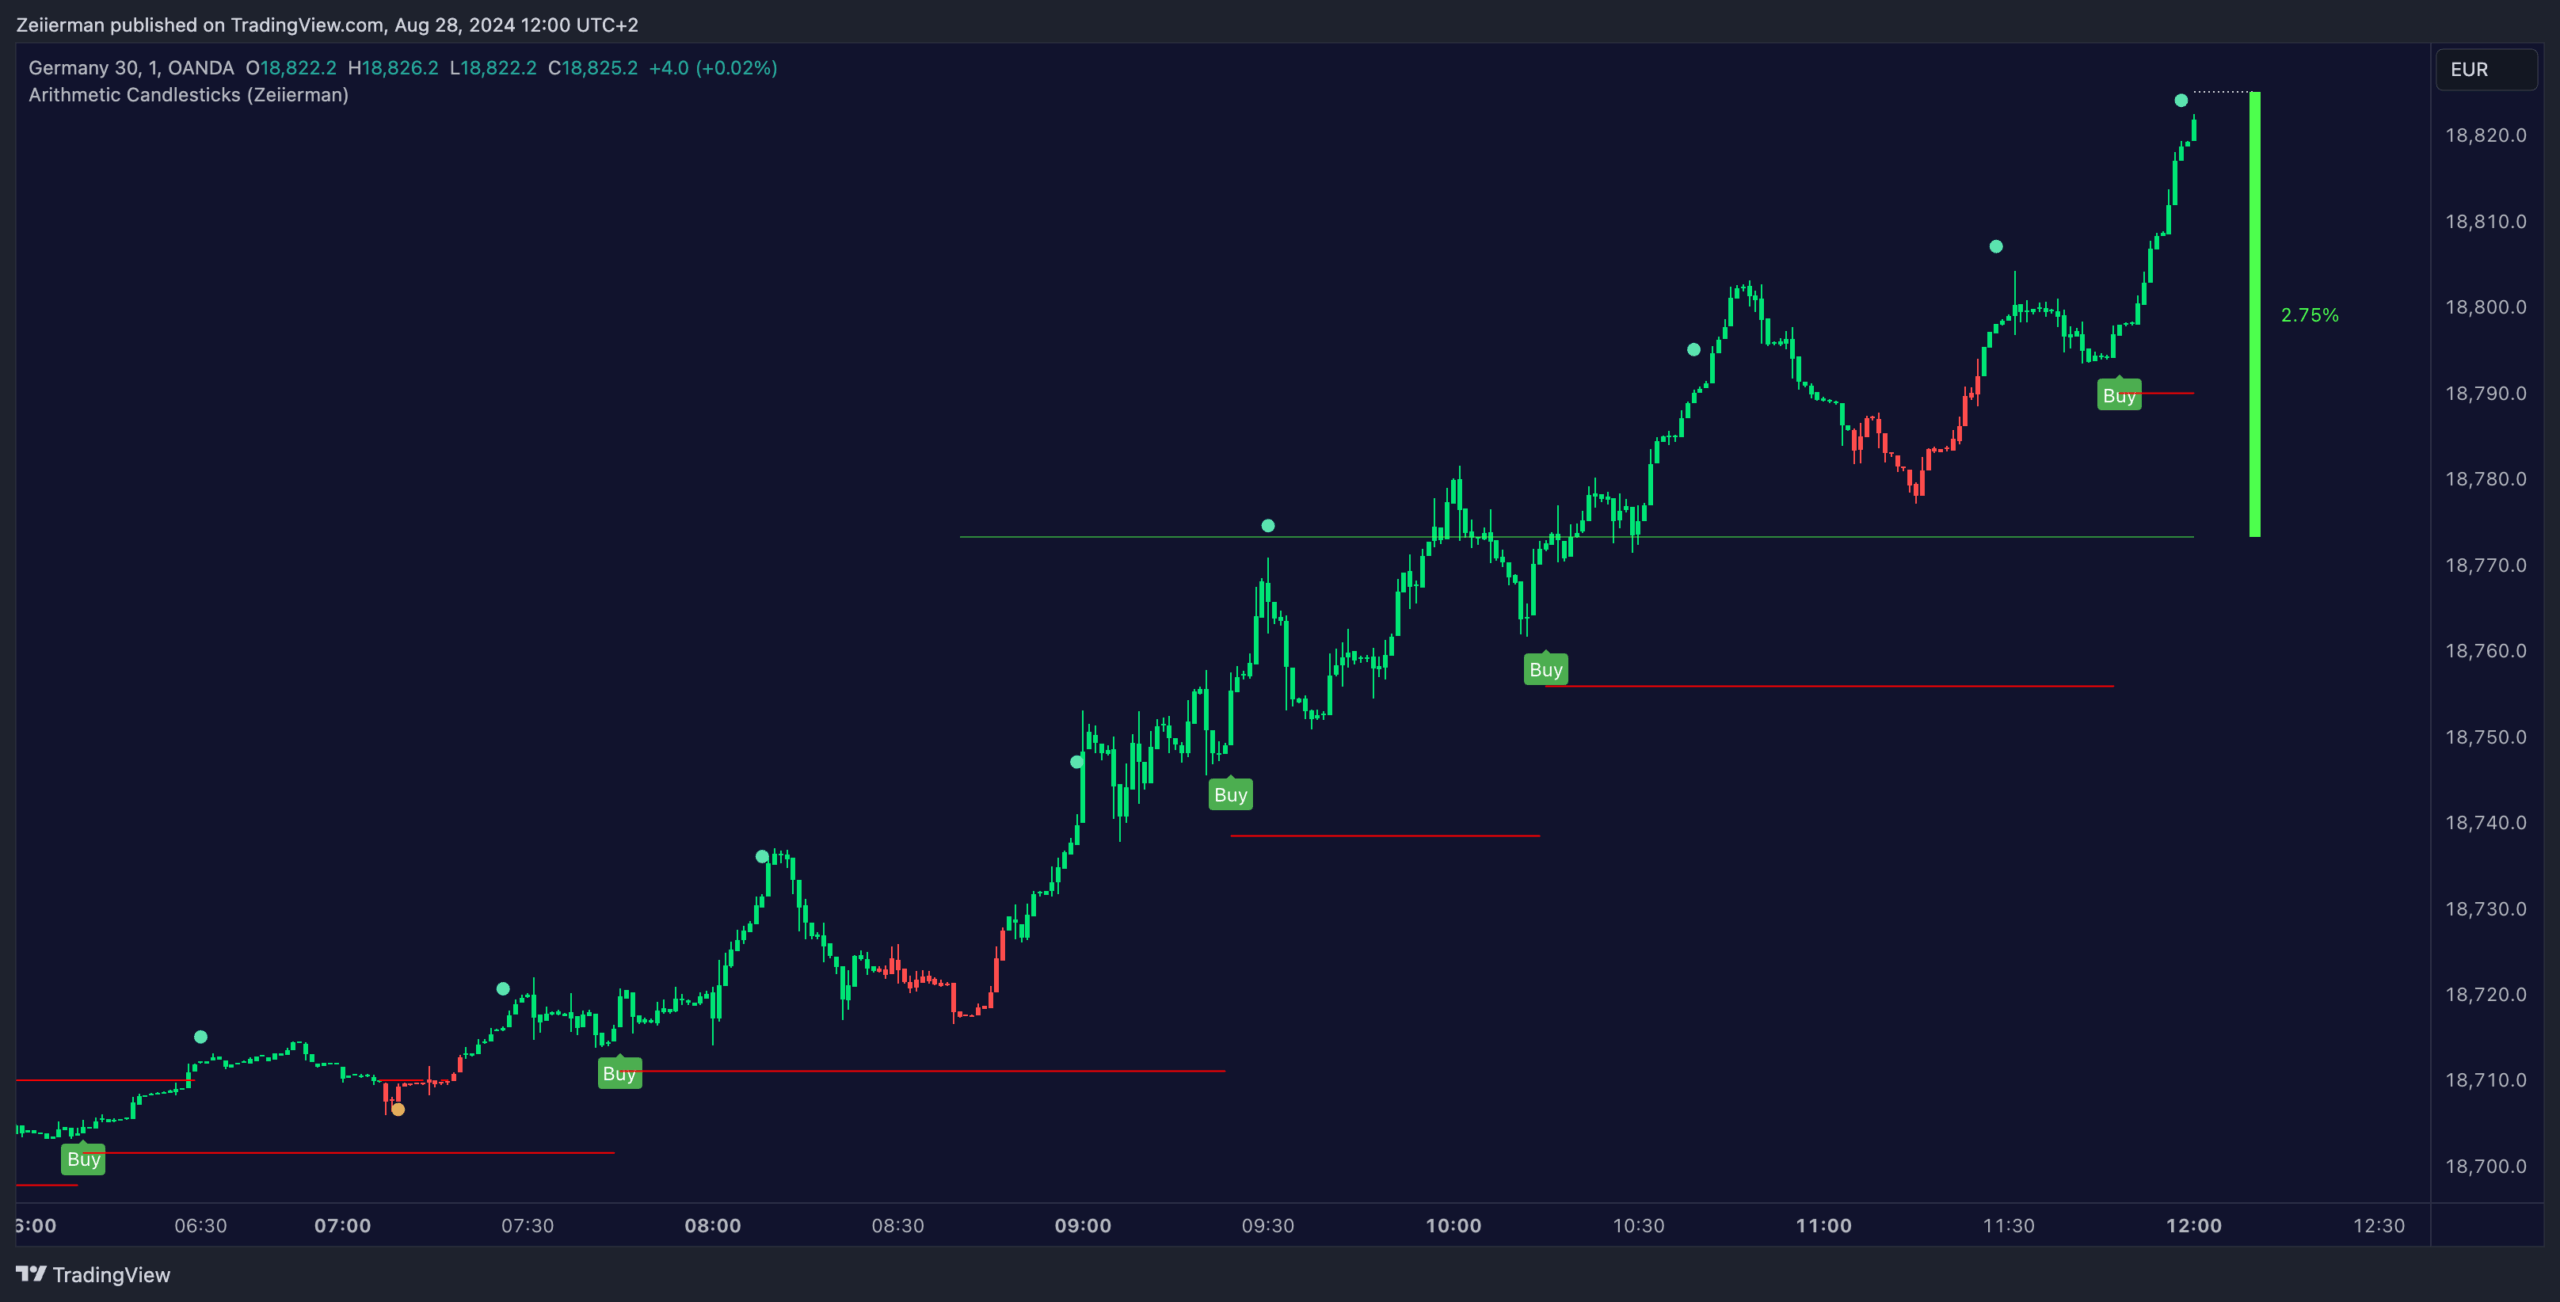
Trend Tracker:
This line tracks the underlying trend, adjustable for scalping or longer-term trading. Works seamlessly with Arithmetic Candlesticks and associated signals.
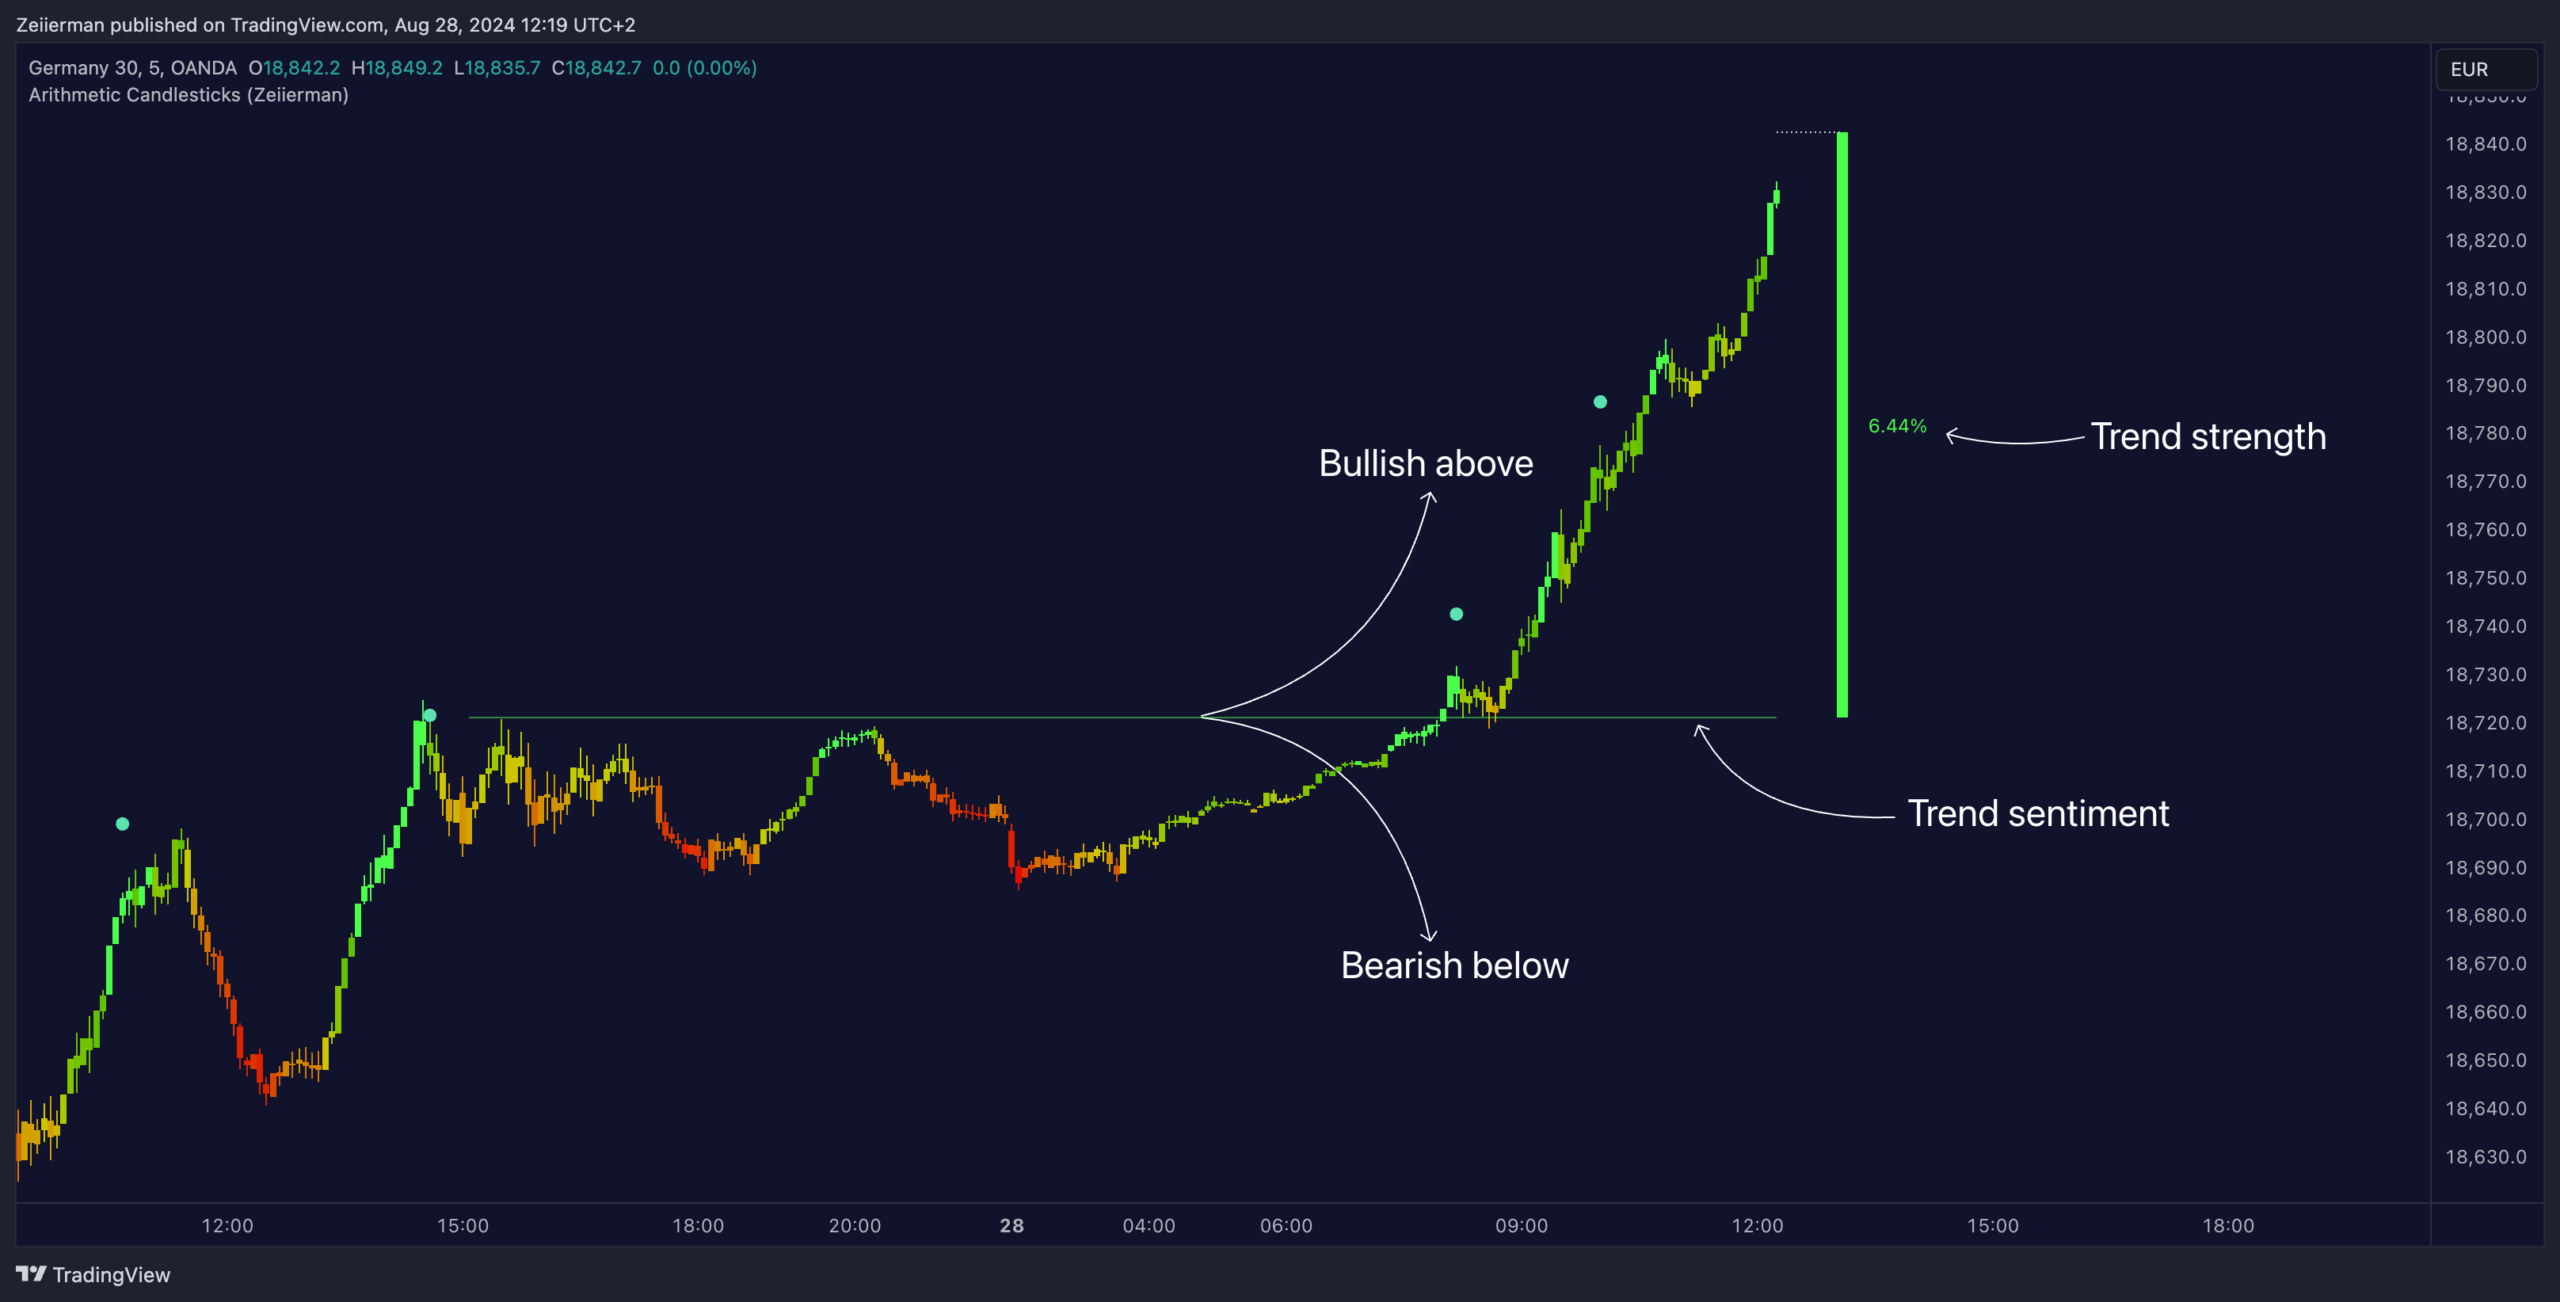
Trend Sentiment:
Identify market sentiment (bullish or bearish) and trend strength with adjustable sensitivity to capture early or late signals.
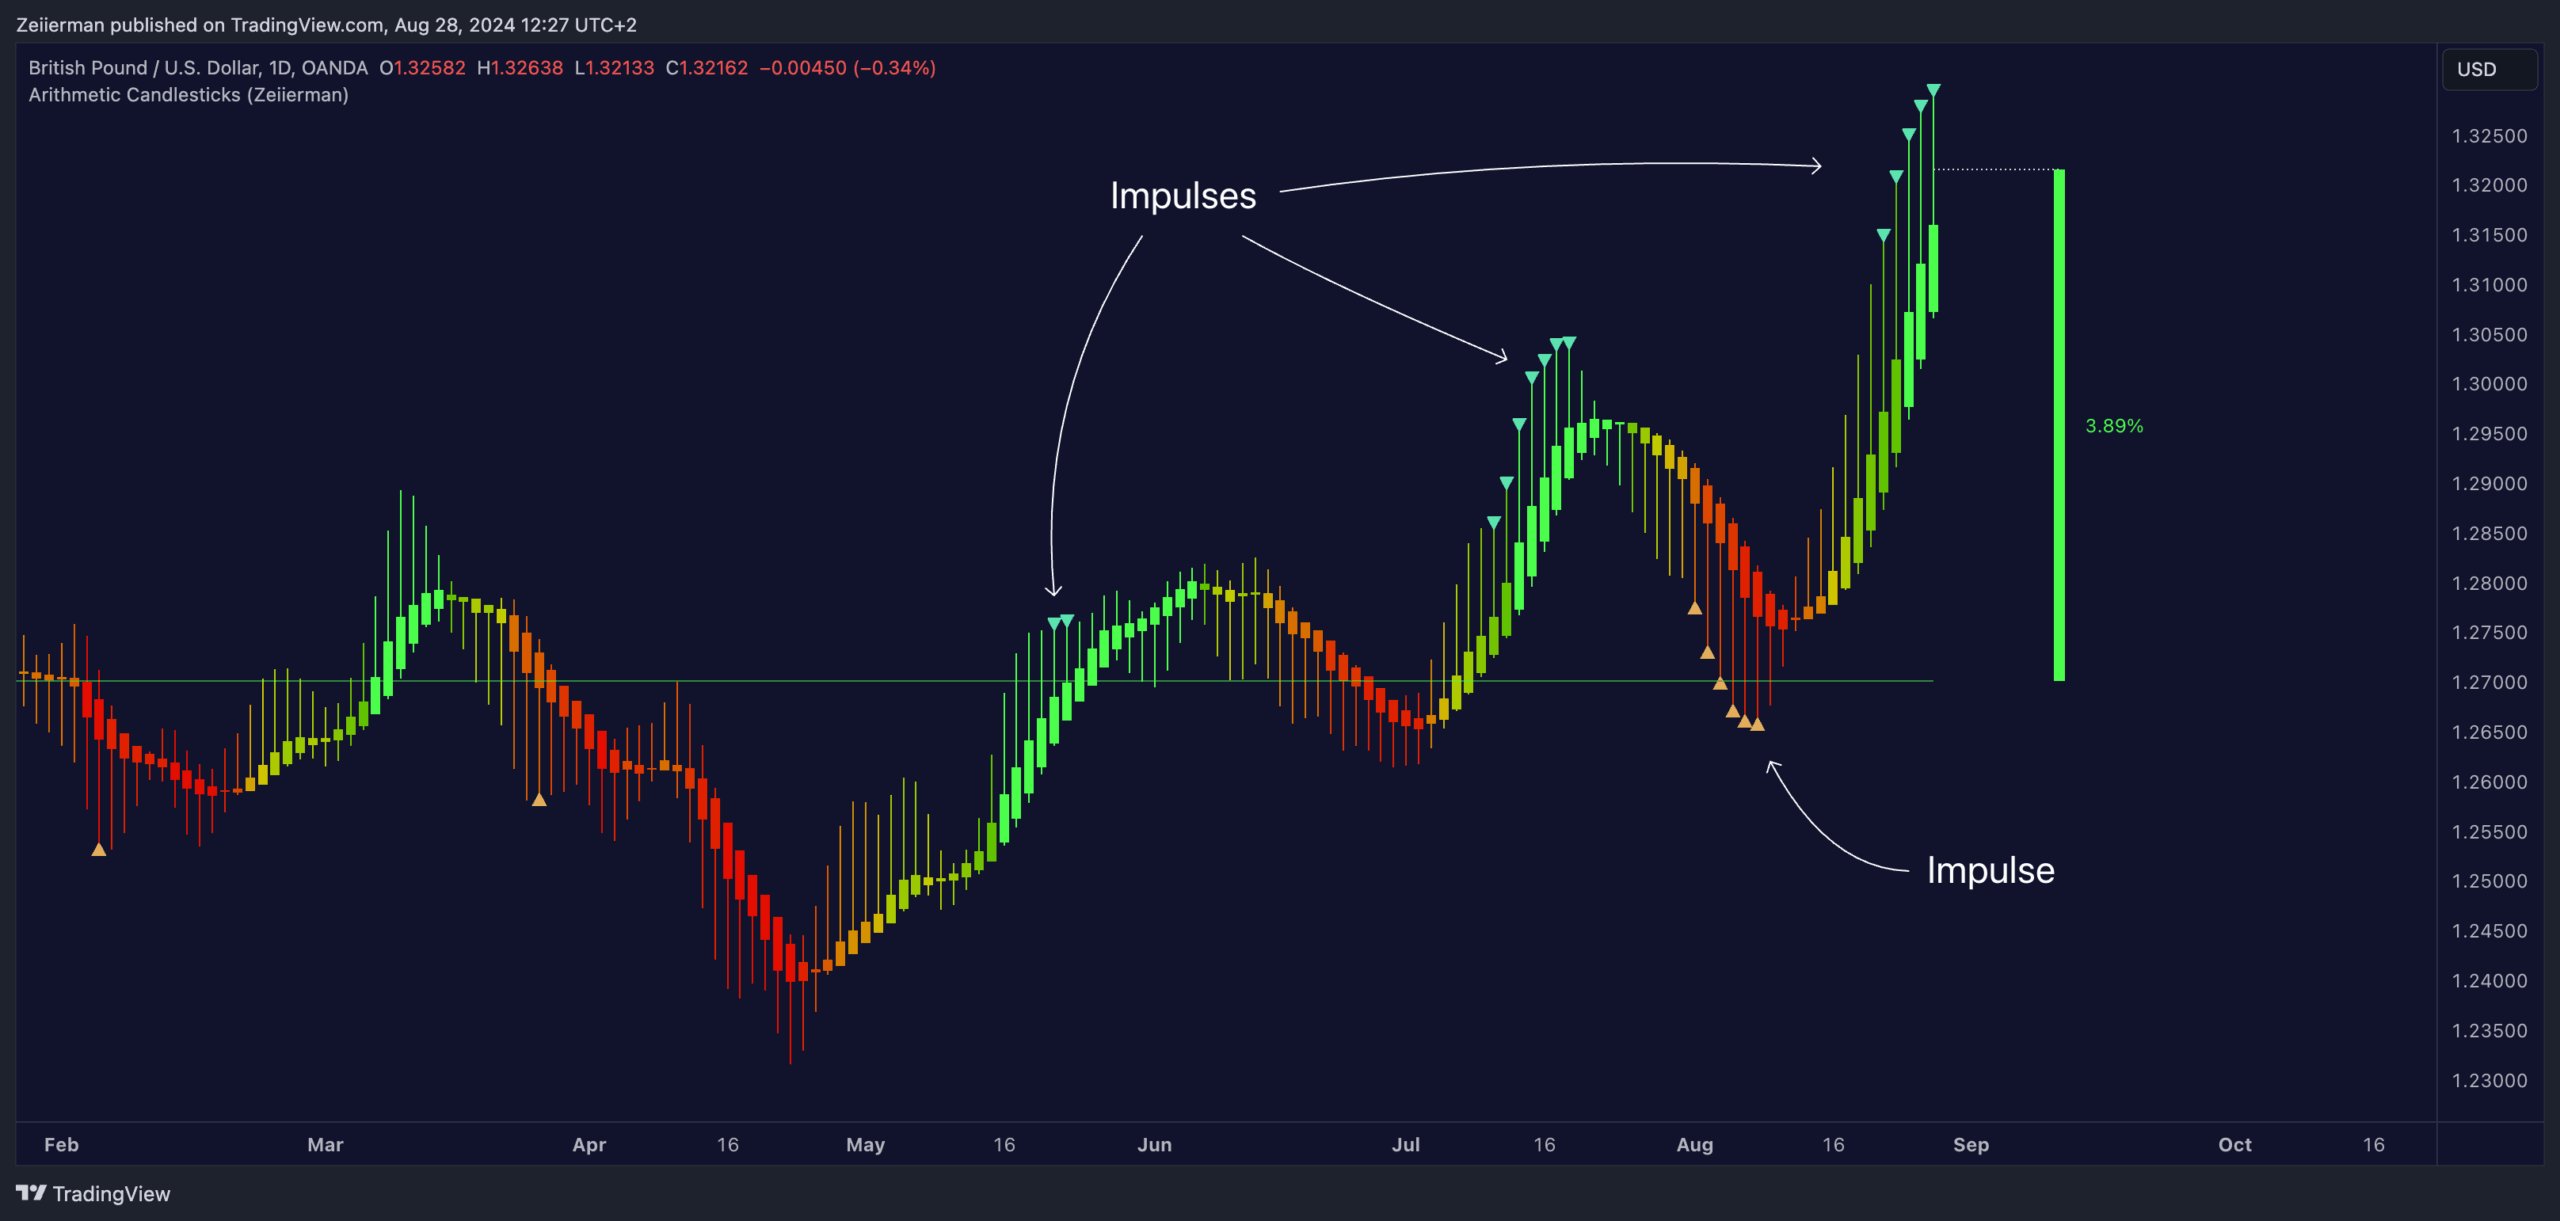
Impulse:
Impulse Signals highlight significant market moves, signaling potential pullbacks or trend reversals. Enable ‘Significant Impulses’ for key market moments.
Zeiierman
With over 16 years in the market, Zeiierman has extensive experience as a full-time trader and risk advisory consultant for hedge funds. He has developed many profitable trading strategies, drawing on his background in risk management and strategy execution.
More from Zeiierman