Works on the Following Platforms
TradingView
For use on the TradingView platform
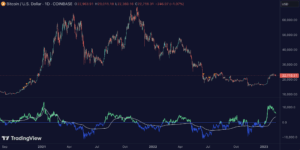
The “Cumulative Delta (Zeiierman)” indicator is a sophisticated tool designed for market analysis that leverages volume data to assess buying and selling pressure, facilitating a deeper understanding of market dynamics beyond standard price movements.
How the Cumulative Delta Works
Cumulative Delta calculates the difference between the volume of buy and sell trades over a given period, cumulating these differences to provide a graphical representation of overall market sentiment. This helps traders see whether buyers or sellers are dominating the trade activity at any given time. By comparing these trends with price movements, users can spot potential reversals or confirmations of current trends.
Key Components of the Cumulative Delta Include:
- Data Source Selection: Users can choose from three data source options—’Estimated’, ‘Volume Data’, and ‘Volume Data Enhanced’—each offering different levels of detail and clarity based on available market data.
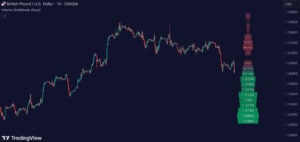
- Visualization Options: The indicator can be displayed in various formats, including candlesticks or lines, with customizable attributes such as line width to suit individual preferences.
- Signal and Confirmation Lines: These lines are derived from moving averages of the cumulative delta, designed to filter out market noise and highlight longer-term trends and pivotal market movements.
Usage of the Cumulative Delta
Traders utilize the Cumulative Delta to:
- Confirm Price Actions: Ensuring that moves in market prices are backed by corresponding volumes, validating the strength behind a trend.
- Detect Divergences: Identifying situations where the price and volume trajectories do not align, which could indicate potential price reversals.
- Optimize Entry and Exit Points: Using the signal and confirmation lines to make strategic decisions about when to enter or exit trades.
Features of the Cumulative Delta
- Adjustable Period Settings: Traders can modify the length settings for the delta calculations to switch between analyzing short-term fluctuations and observing longer-term trends.
- Color Coding: The indicator includes various color modes to visually differentiate between increasing and decreasing volume pressures, helping to quickly assess market conditions.
- Advanced Signal Features: Impulse signals and trend clouds provide additional visual cues and alerts that can help traders to capitalize on sudden market movements or changes in trend direction.
Conclusion
The “Cumulative Delta (Zeiierman)” indicator is an invaluable tool for traders who incorporate volume analysis into their trading strategy. It enhances the ability to make informed decisions by providing insights into the underlying strength or weakness of market movements, which are not visible through price analysis alone. Whether used for scalping or long-term trading, this indicator provides a strategic edge in navigating the complexities of various financial markets.
Zeiierman
With over 16 years in the market, Zeiierman has extensive experience as a full-time trader and risk advisory consultant for hedge funds. He has developed many profitable trading strategies, drawing on his background in risk management and strategy execution.
More from Zeiierman