Works on the Following Platforms
TradingView
For use on the TradingView platform
Bellcurves indicator helps traders identify potential tops and bottoms, and gauge market impulses.
Trading Results – 92.86% Winning Rate! **Trading Strategy**
Bellcurves is an indicator that helps traders see the market in a unique way. It does this by focusing only on the important information and ignoring any irrelevant data that could cause confusion. By using this approach, Bellcurves can show traders clear and specific information about market impulses that they can use to make better trading decisions. For example, traders can use Bellcurves to find important levels where the market might turn around or to see trends that are starting. By identifying these key moments in the market, traders can make smarter trades and potentially earn more money. Overall, Bellcurves is a helpful tool that can make it easier for traders to understand the market and make successful trades.
How does the indicator work?
The Bellcurves indicator works by looking at the distribution of price data. This helps to remove the noise from the data and show the real price movements in the market. By doing this, traders can identify potential changes in the market and find important levels where the market might turn around.
How to use the Bellcurve indicator
This kind of tool can be very helpful in volatile markets that change quickly and often.
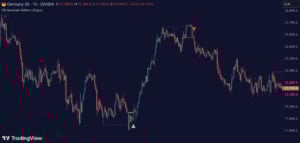
Find Reversals: The Bellcurves indicator shows price areas with a higher probability of a market reversal.
Take Profits: The Bellcurves indicator can be used to identify potential exit points. For example, traders can exit their position when the Bellcurve starts to turn.
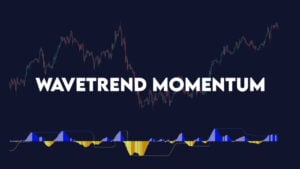
Impulses: The height of the Bellcurve determines the strength of the price movement. The bigger the Bellcurve, the stronger the price move.
Overall, Bellcurves is a powerful tool that gives traders a clearer view of the market. By removing the noise and highlighting the important information, traders can identify potential market reversals and key support and resistance levels more easily. This can lead to more successful trades and better overall trading outcomes.
Additional Bellcurve Features
- Pre-Bellcurves: This feature highlights when a Bellcurve is about to plot.
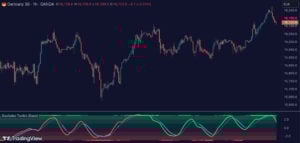
- Oscillator mode: Traders can choose to display the Bellcurve as an oscillator.
- Momentum Impulse: Displays green and red dots when the momentum gets strong.
- Divergences: Highlights divergences between strong market impulses.
Zeiierman
With over 16 years in the market, Zeiierman has extensive experience as a full-time trader and risk advisory consultant for hedge funds. He has developed many profitable trading strategies, drawing on his background in risk management and strategy execution.
More from Zeiierman