Works on the Following Platforms
TradingView
For use on the TradingView platform
This ultimate trading tool automatically identifies real-time Support and Resistance, Supply and Demand, Liquidity Zones, Key levels, Trendlines, and Order Blocks.
Which Zone should I use?
Determining which zone to use in trading requires an understanding of the differences between the various types.
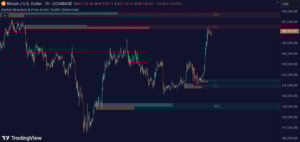
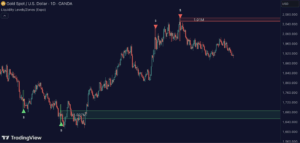
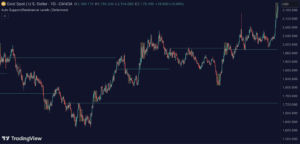
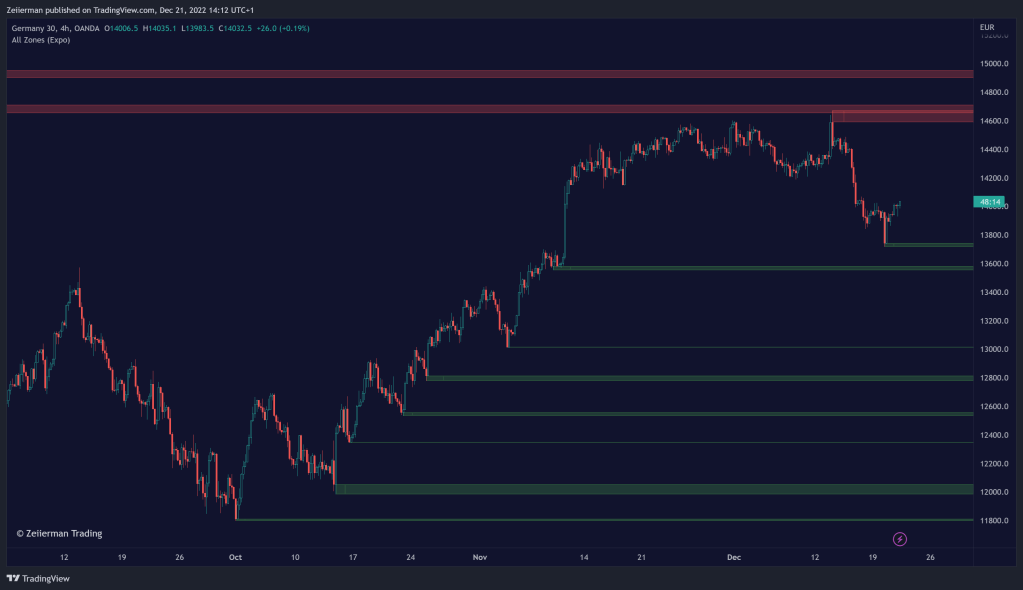
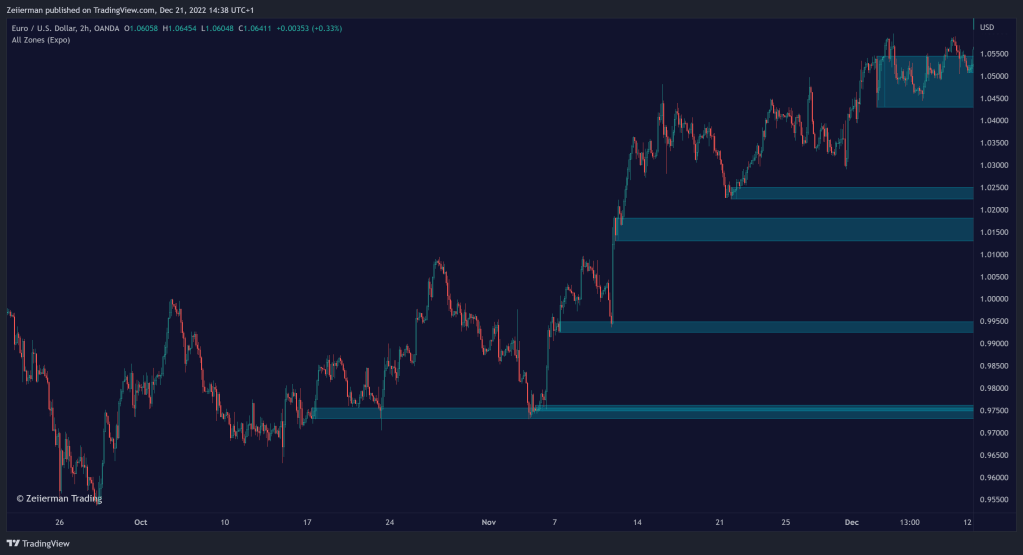
Two commonly used zones are support and resistance, which refer to areas where prices have been rejected before. These zones are easy to identify on a chart, with resistance being a level where the price has been rejected and thereafter decreased, while support is a level where the price has bounced off and increased.
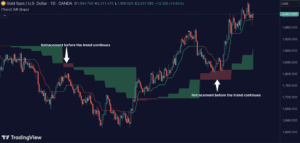
Trend support and resistance, on the other hand, is a less common but powerful technique. It differs from regular support and resistance in that it is identified by a different approach. Specifically, trend support and resistance are found in an area where the price has been rejected at least twice, followed by a break of that area. A trader has an edge when the area is re-tested.
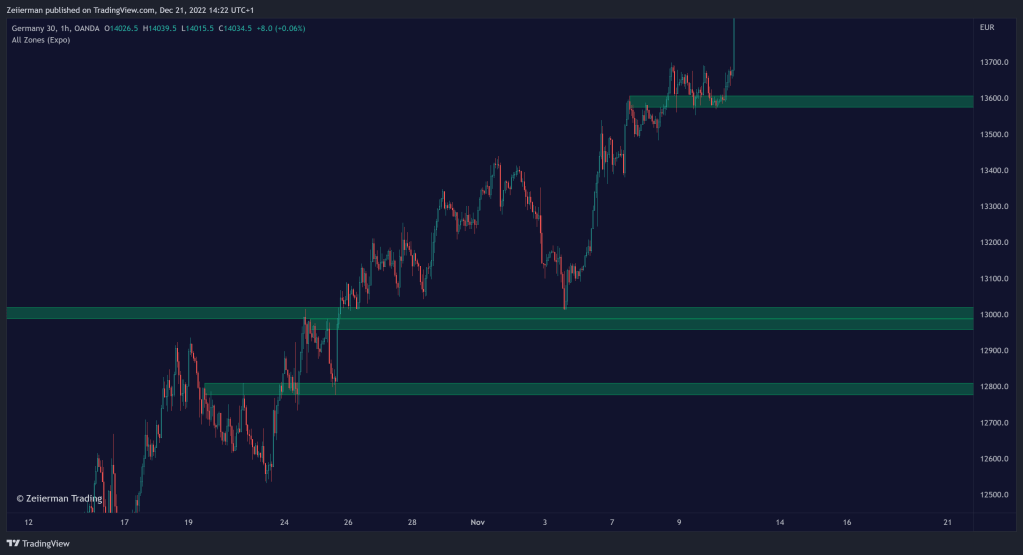
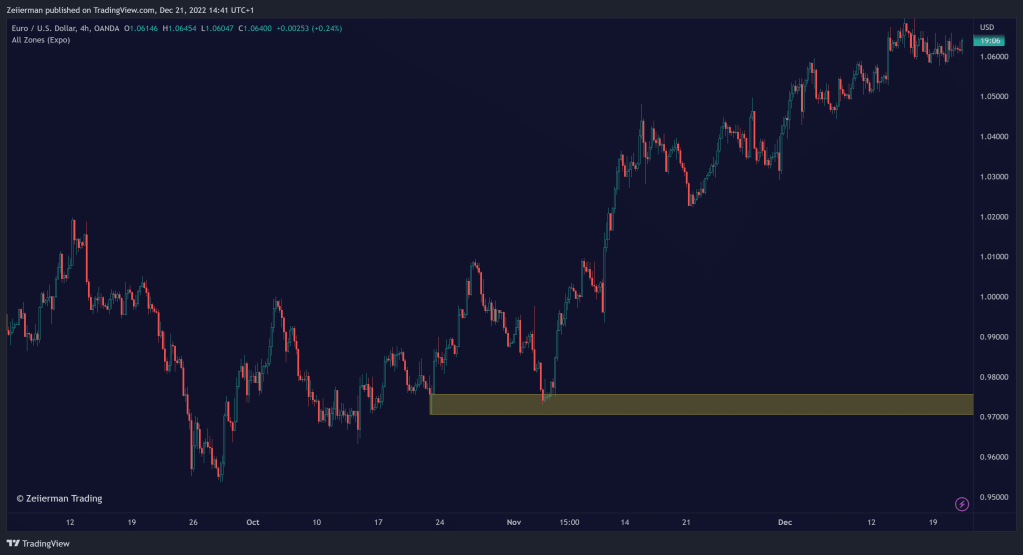
Supply and demand areas are related to potential zones where hidden orders are left in the market. These areas represent a battle between the bulls and bears, with traders and investors exchanging several contracts. Price often moves quickly away from these areas. When the price re-tests a supply or demand zone, the trader can find incredible opportunities if there are still orders in the market, and prices often bounce off at the first visit.
Significant players, such as banks and institutions, primarily use liquidity zones. These zones require high liquidity for major players to enter the market. Traders can use an indicator to scan for regions where higher-than-usual liquidity has been found. They can then follow the players or wait until the regions are re-tested to see how the price reacts.
Order blocks represent a cluster of orders that have been executed at a particular price level, and are often seen as a key area of support or resistance. Traders use order blocks to help identify potential entry and exit points for their trades. For example, if a trader is looking to buy a stock, they may wait for the price to reach an order block zone before making their purchase, in the hope that the buying activity at that level will help to push the price higher. Conversely, if a trader is looking to sell a stock, they may wait for the price to reach an order block zone before making their sale, in the hope that the selling activity at that level will help to push the price lower.
Features
This indicator includes all necessary features for traditional technical analysis, such as Trendlines, Support/Resistance, Supply/Demand, and Liquidity Zones. In addition to that, we have added key market levels.
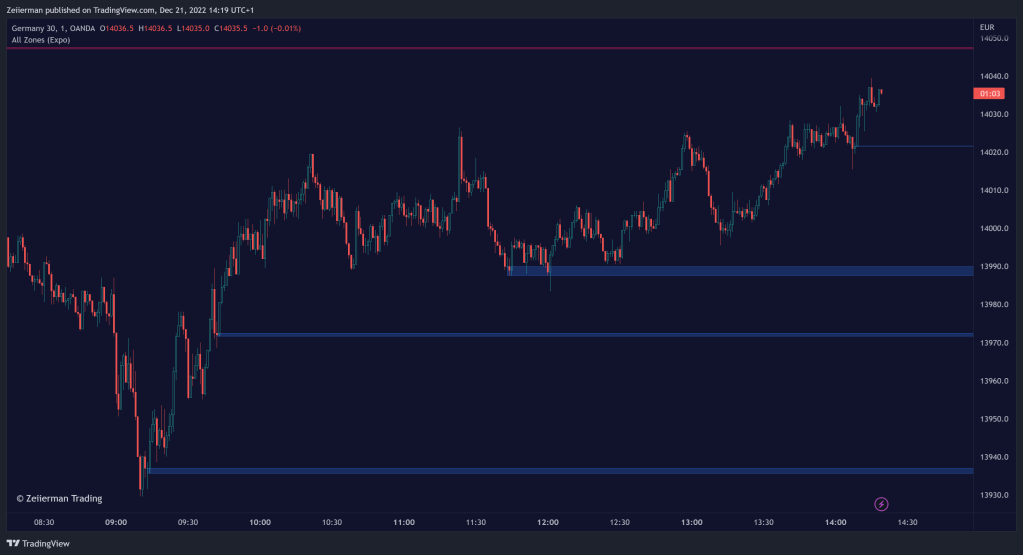
Support & Resistance: Identifies areas in real-time where the price finds support and resistance.
Trend Support & Resistance: These are more advanced than regular support & resistance due to multiple criteria. We primarily used it for trend continuation hence its name.
Supply/Demand: The indicator analyzes the market structure in real time and maps out essential supply and demand zones. The user gets an instant understanding of the current market structure.
Liquidity Zones: Liquidity zones are displayed where there is a significant level of trading activity and when there is both high supply and demand for an asset, security, or contract.
TrendLines: Trendlines help traders determine the current direction of market prices. A trendline is displayed when a price action trend is detected.
Key Levels: Key levels are psychological levels under the attention of many traders. There is a lot of buying or selling pressure at these levels. At these critical levels, the price decides whether to go bearish or bullish.
Order blocks: In trading, an order block is a defined price zone on a chart that has previously experienced notable buying or selling activity. It is a cluster of executed orders at a particular price level and is commonly regarded as a significant area of support or resistance.
There are already built-in ALERTS in this indicator!
Zeiierman
With over 16 years in the market, Zeiierman has extensive experience as a full-time trader and risk advisory consultant for hedge funds. He has developed many profitable trading strategies, drawing on his background in risk management and strategy execution.
More from Zeiierman
![Buyside/Sellside Liquidity [Real-Time]](https://www.zeiierman.com/wp-content/uploads/2024/09/66bce68173f69e88dc6e2466_BuysideSellside-Liquidity-Real-Time-300x144.png)