Works on the Following Platforms
TradingView
For use on the TradingView platform
The 2B reversal pattern, also known as the spring pattern, is a popular chart pattern among professional traders to identify potential trend reversals. This pattern occurs when the price seems to be breaking up or down and suddenly bounces back up or down, forming a false breakout pattern. It suggests that the trend is losing momentum and a reversal is on the horizon.
In a bearish market, the spring pattern occurs when the asset’s price breaks below a support level, causing many traders to sell their positions and drive the price further down. However, the selling pressure eventually eases, and the price starts to rebound, springing back above the support level. This rebound presents a long opportunity for traders to enter the market at a lower price.
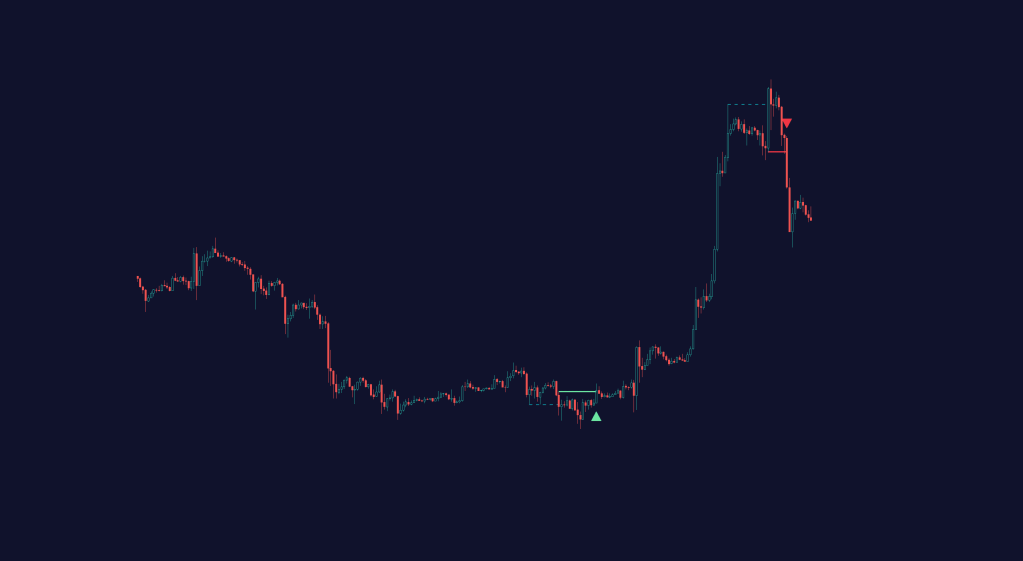
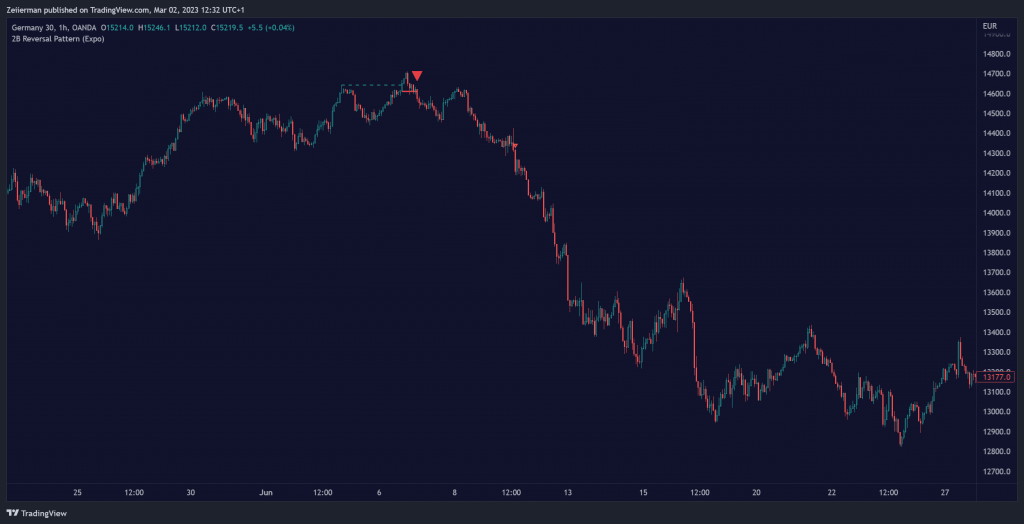
In a bullish market, the spring pattern occurs when the asset’s price breaks above a resistance level, causing many traders to buy the asset and drive the price further up. However, the buying pressure eventually eases, and the price starts to decline, springing below the resistance level. This decline creates a selling opportunity for traders who can short the market at a higher price.
Benefits of using the 2B Reversal Pattern
Traders who use the 2B Reversal pattern can identify potential buying or selling opportunities with reduced risk. By waiting for the price to spring back to the initial breakout level, traders can avoid entering the market too soon and minimize the risk of potential losses.
How to use
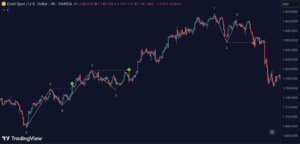
Traders can use the 2B reversal pattern to identify reversals. If the pattern occurs after an uptrend, traders may sell their long positions or enter a short position, anticipating a reversal to a downtrend. If the pattern occurs after a downtrend, traders may sell their short positions or enter a long position, anticipating a reversal to an uptrend.
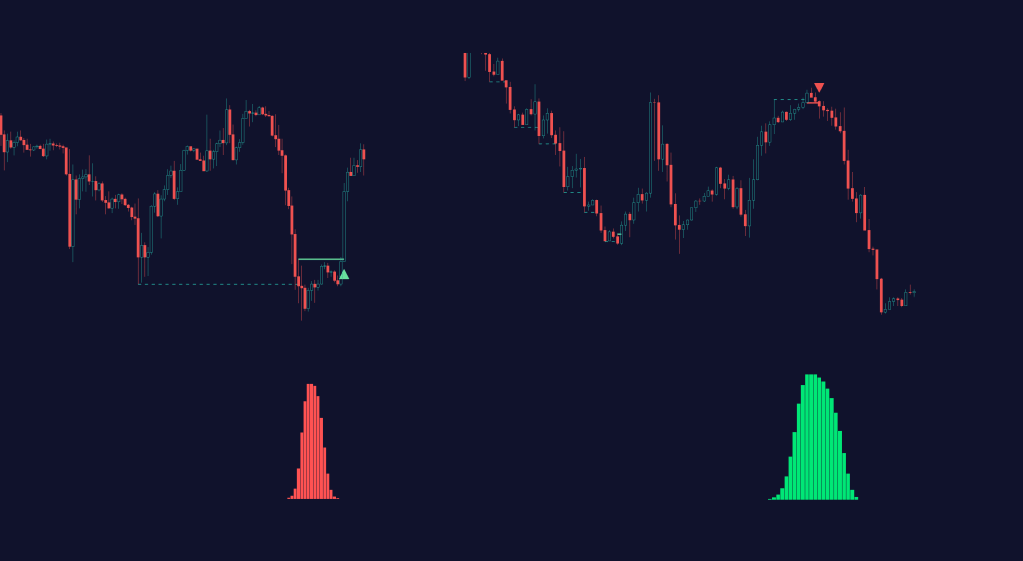
Bellcurve Strategy
Take your Reversal Trading to the next level using the spring pattern together with our Bellcurve strategy.
Consolidation Strategy
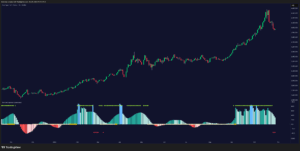
To use the 2B reversal pattern, traders should first identify a period of price consolidation or a trading range where the price has been trading sideways for some time. The key feature of the spring pattern is a sudden, sharp move downward/upward through the lower/upper boundary of this trading range, often accompanied by high volume.
However, instead of continuing to move lower/higher, the price then quickly recovers and moves back into the trading range, often on low volume. This quick recovery is the “spring” part of the pattern and suggests that the market has rejected the lower/higher price and that buying/selling pressure is building.
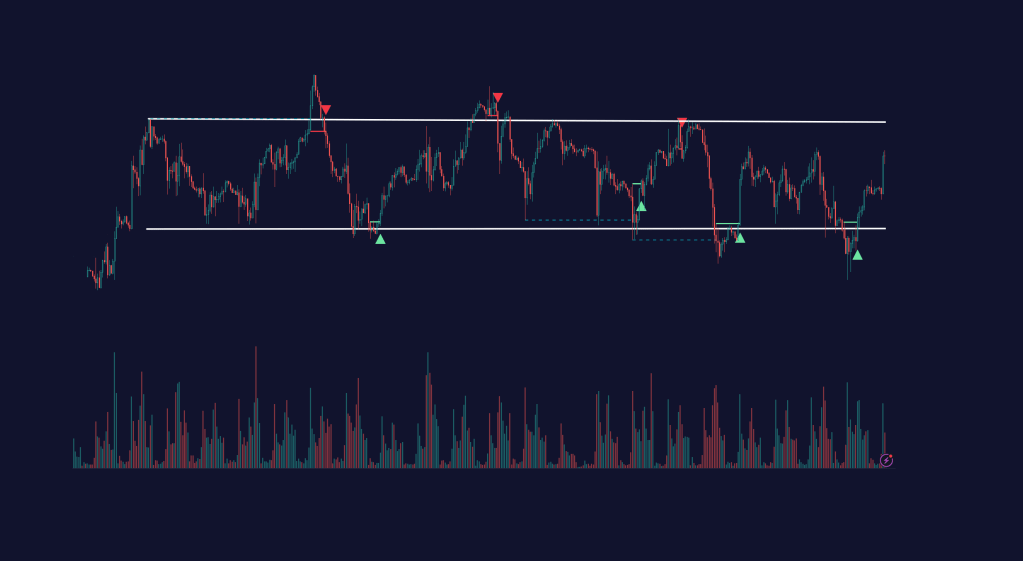
Traders may use the spring pattern as a signal to buy/sell the asset, suggesting strong demand/supply for the stock at the lower/higher price level. However, it is essential to use other indicators and manage risk carefully to minimize potential losses, as with all trading strategies.
Zeiierman
With over 16 years in the market, Zeiierman has extensive experience as a full-time trader and risk advisory consultant for hedge funds. He has developed many profitable trading strategies, drawing on his background in risk management and strategy execution.
More from Zeiierman