Works on the Following Platforms
TradingView
For use on the TradingView platform
The Relative Trend Index (RTI) developed by Zeiierman is an innovative technical analysis tool designed to measure the strength and direction of the market trend. Unlike some traditional indicators, the RTI boasts a distinctive ability to adapt and respond to market volatility, while still minimizing the effects of minor, short-term market fluctuations.
The Relative Trend Index blends trend-following and mean-reverting characteristics, paired with a customizable and intuitive approach to trend strength, and its sensitivity to price action makes this indicator stand out.
Benefits of using this RTI instead of RSI
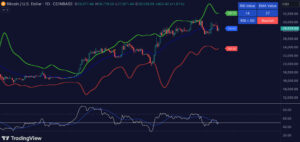
The Relative Strength Index (RSI) and the Relative Trend Index (RTI) are both powerful technical indicators, each with its own unique strengths. However, there are key differences that make the RTI arguably more sophisticated and precise, especially when it comes to identifying trends and overbought/oversold (OB/OS) areas.
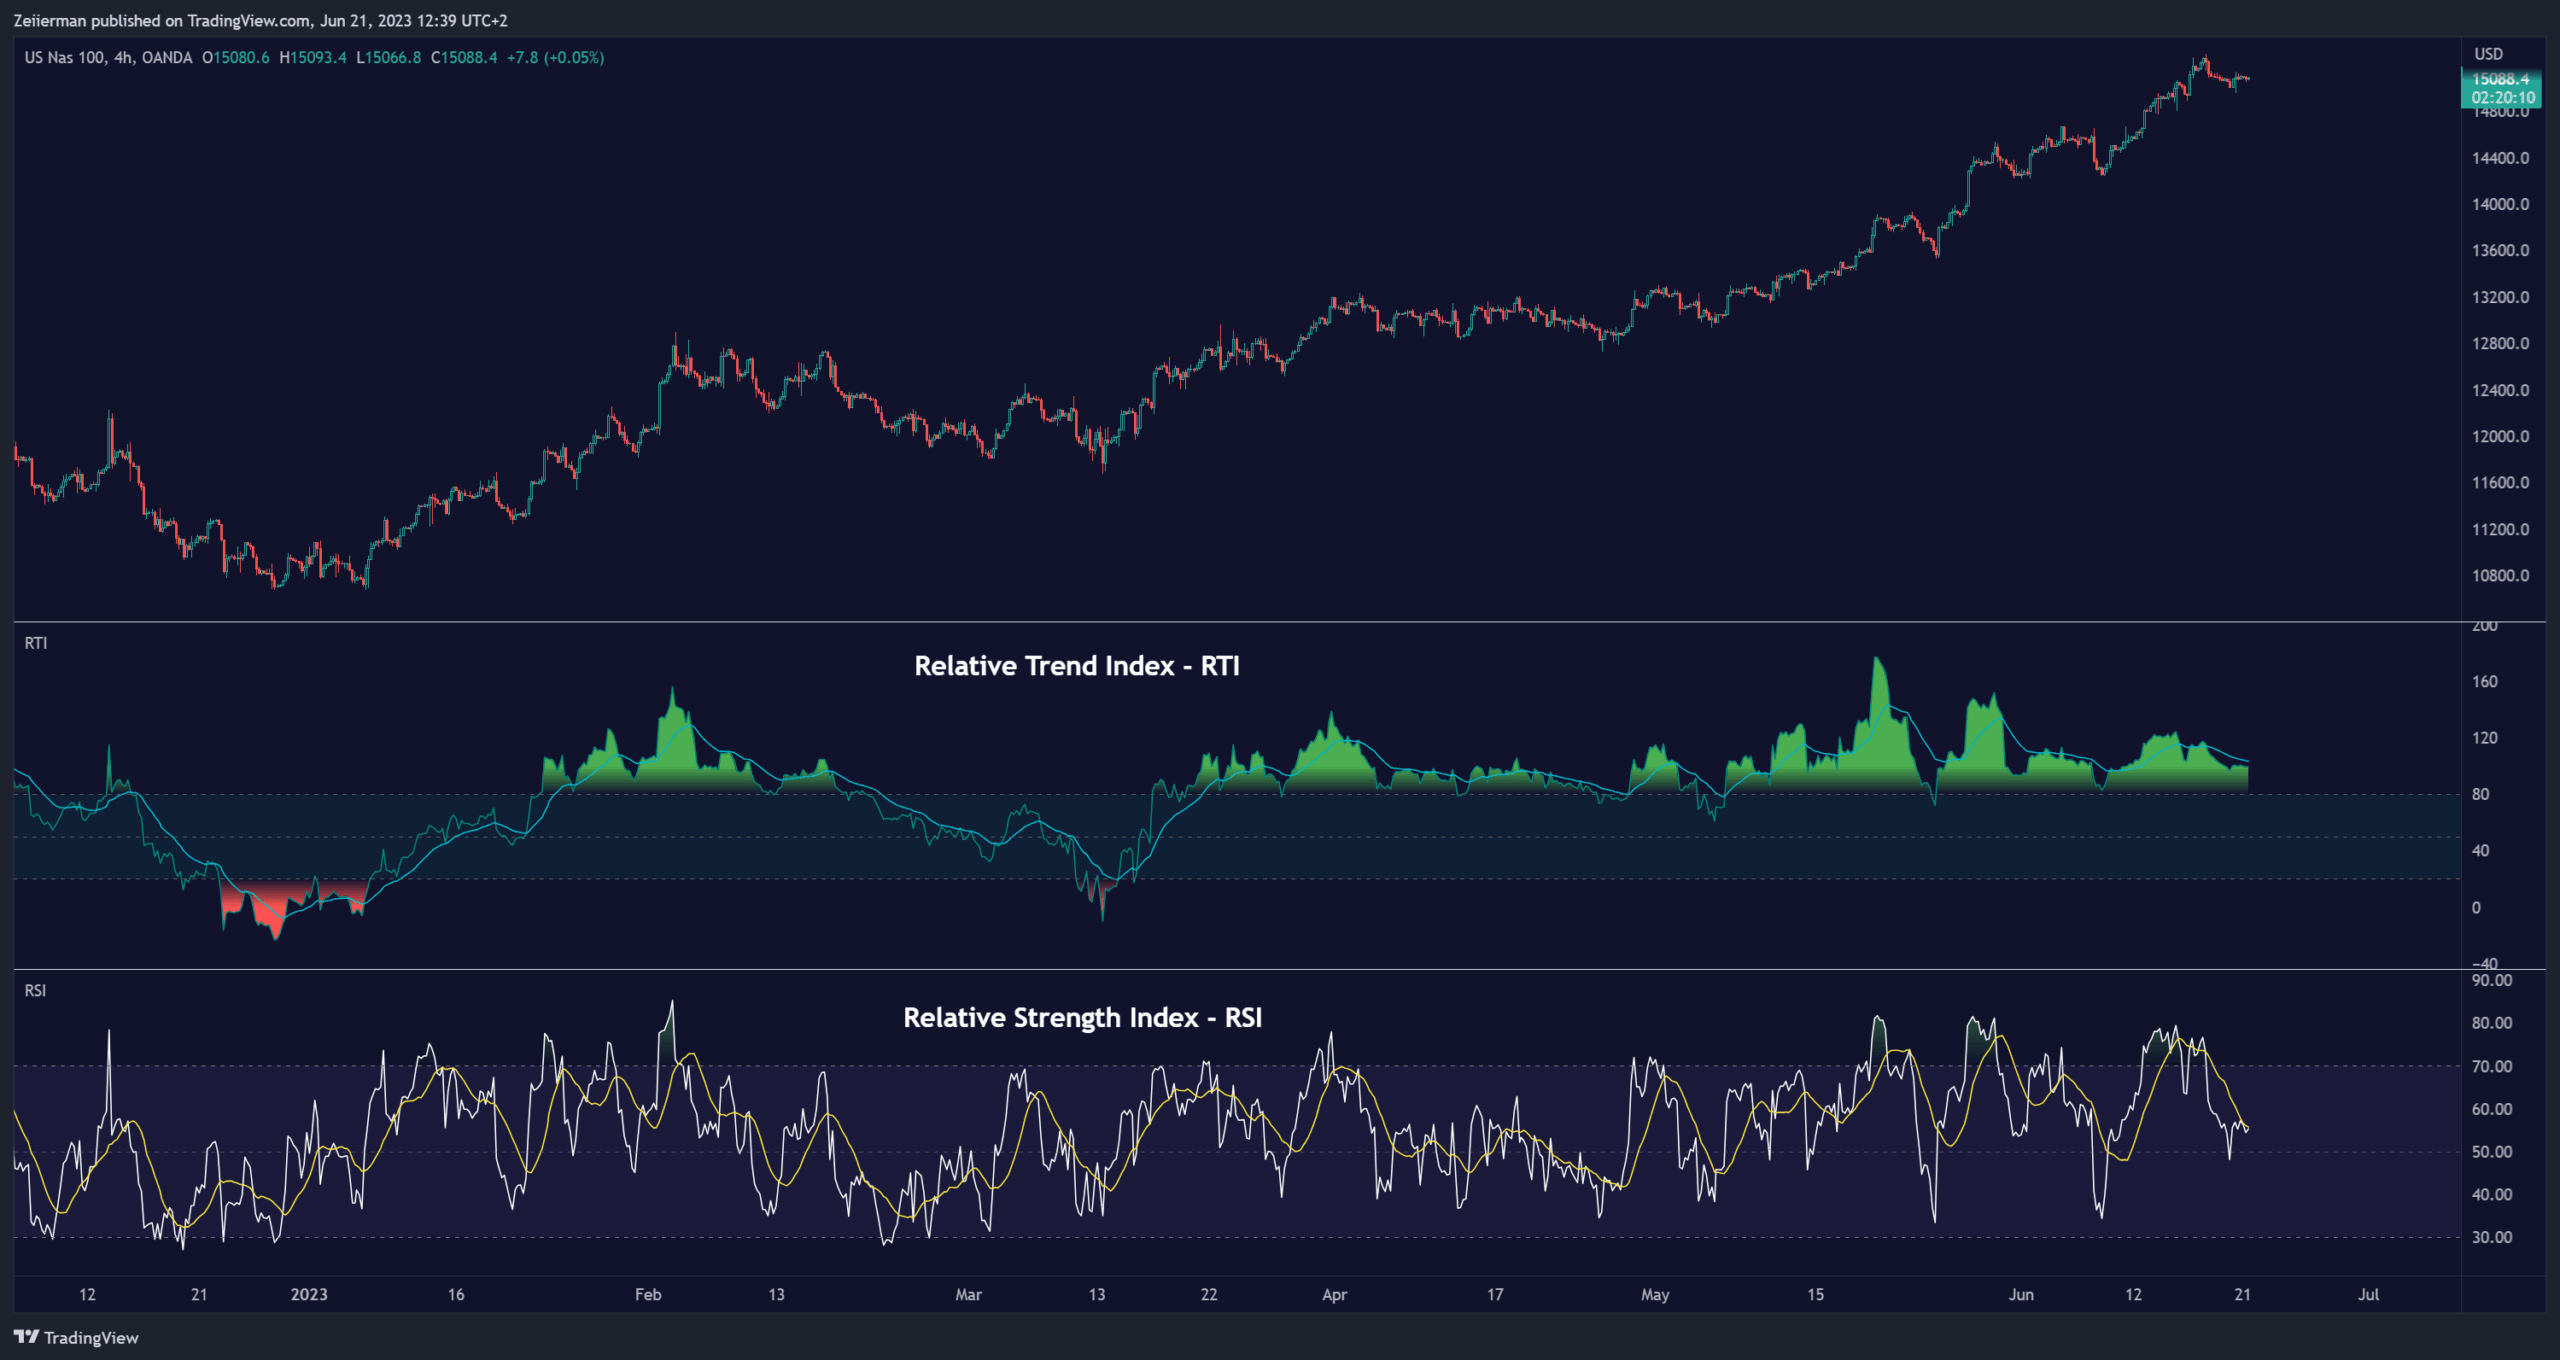
The RSI is a momentum oscillator that measures the speed and change of price movements and is typically used to identify overbought and oversold conditions in a market. However, its primary limitation lies in its tendency to produce false signals during extended trending periods.
On the other hand, the RTI is designed specifically to identify and adapt to market trends. Instead of solely focusing on price changes, the RTI measures the relative positioning of the current closing price within its recent range, providing a more comprehensive view of market conditions.
The RTI’s adaptable nature is particularly valuable. The user-adjustable sensitivity percentage allows traders to fine-tune the indicator’s responsiveness, making it more resilient to sudden market fluctuations and noise that could otherwise produce false signals. This feature is advantageous in various market conditions, from trending to choppy and sideways-moving markets.
Furthermore, the RTI’s unique method of defining OB/OS zones takes into account the prevailing trend, which can provide a more precise reflection of the market’s condition.
While the RSI is an invaluable tool in many traders’ toolkits, the RTI’s unique approach to trend identification, adaptability, and enhanced definition of OB/OS zones can provide traders with a more nuanced understanding of market conditions and potential trading opportunities. This makes the RTI an especially powerful tool for those seeking to ride long-term trends and avoid false signals.
How to use the RTI indicator
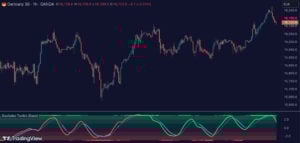
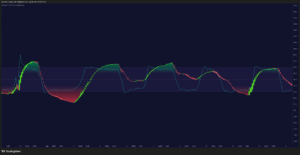
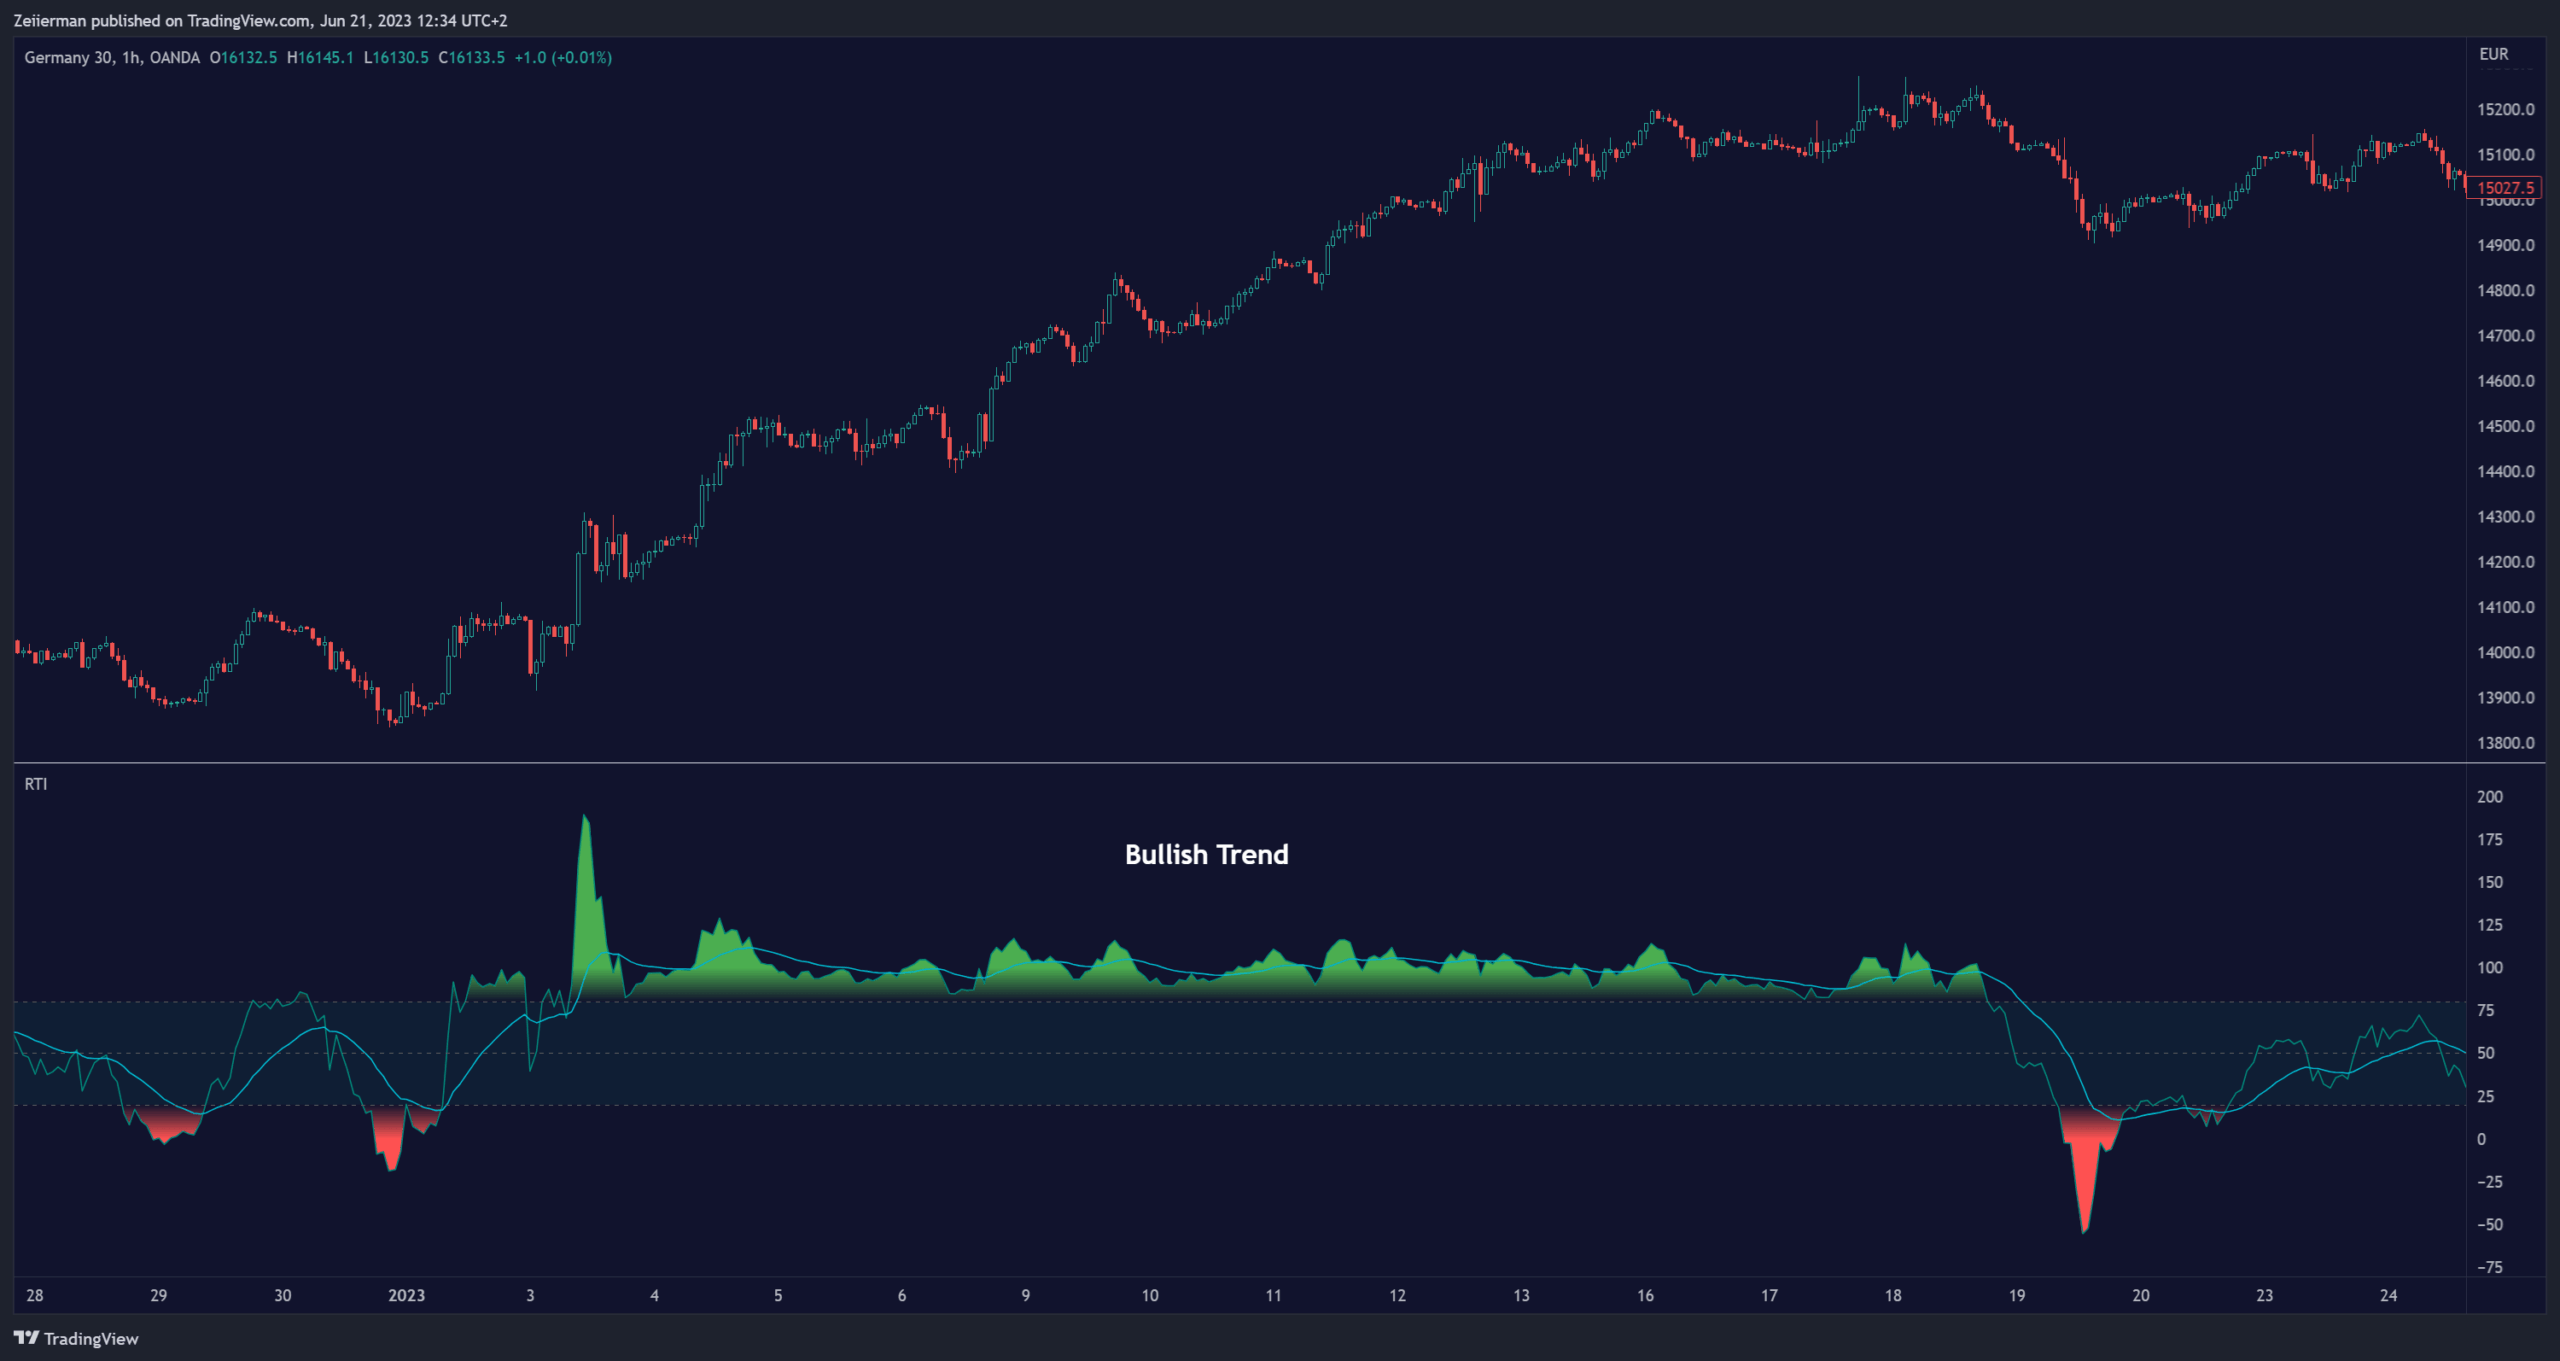
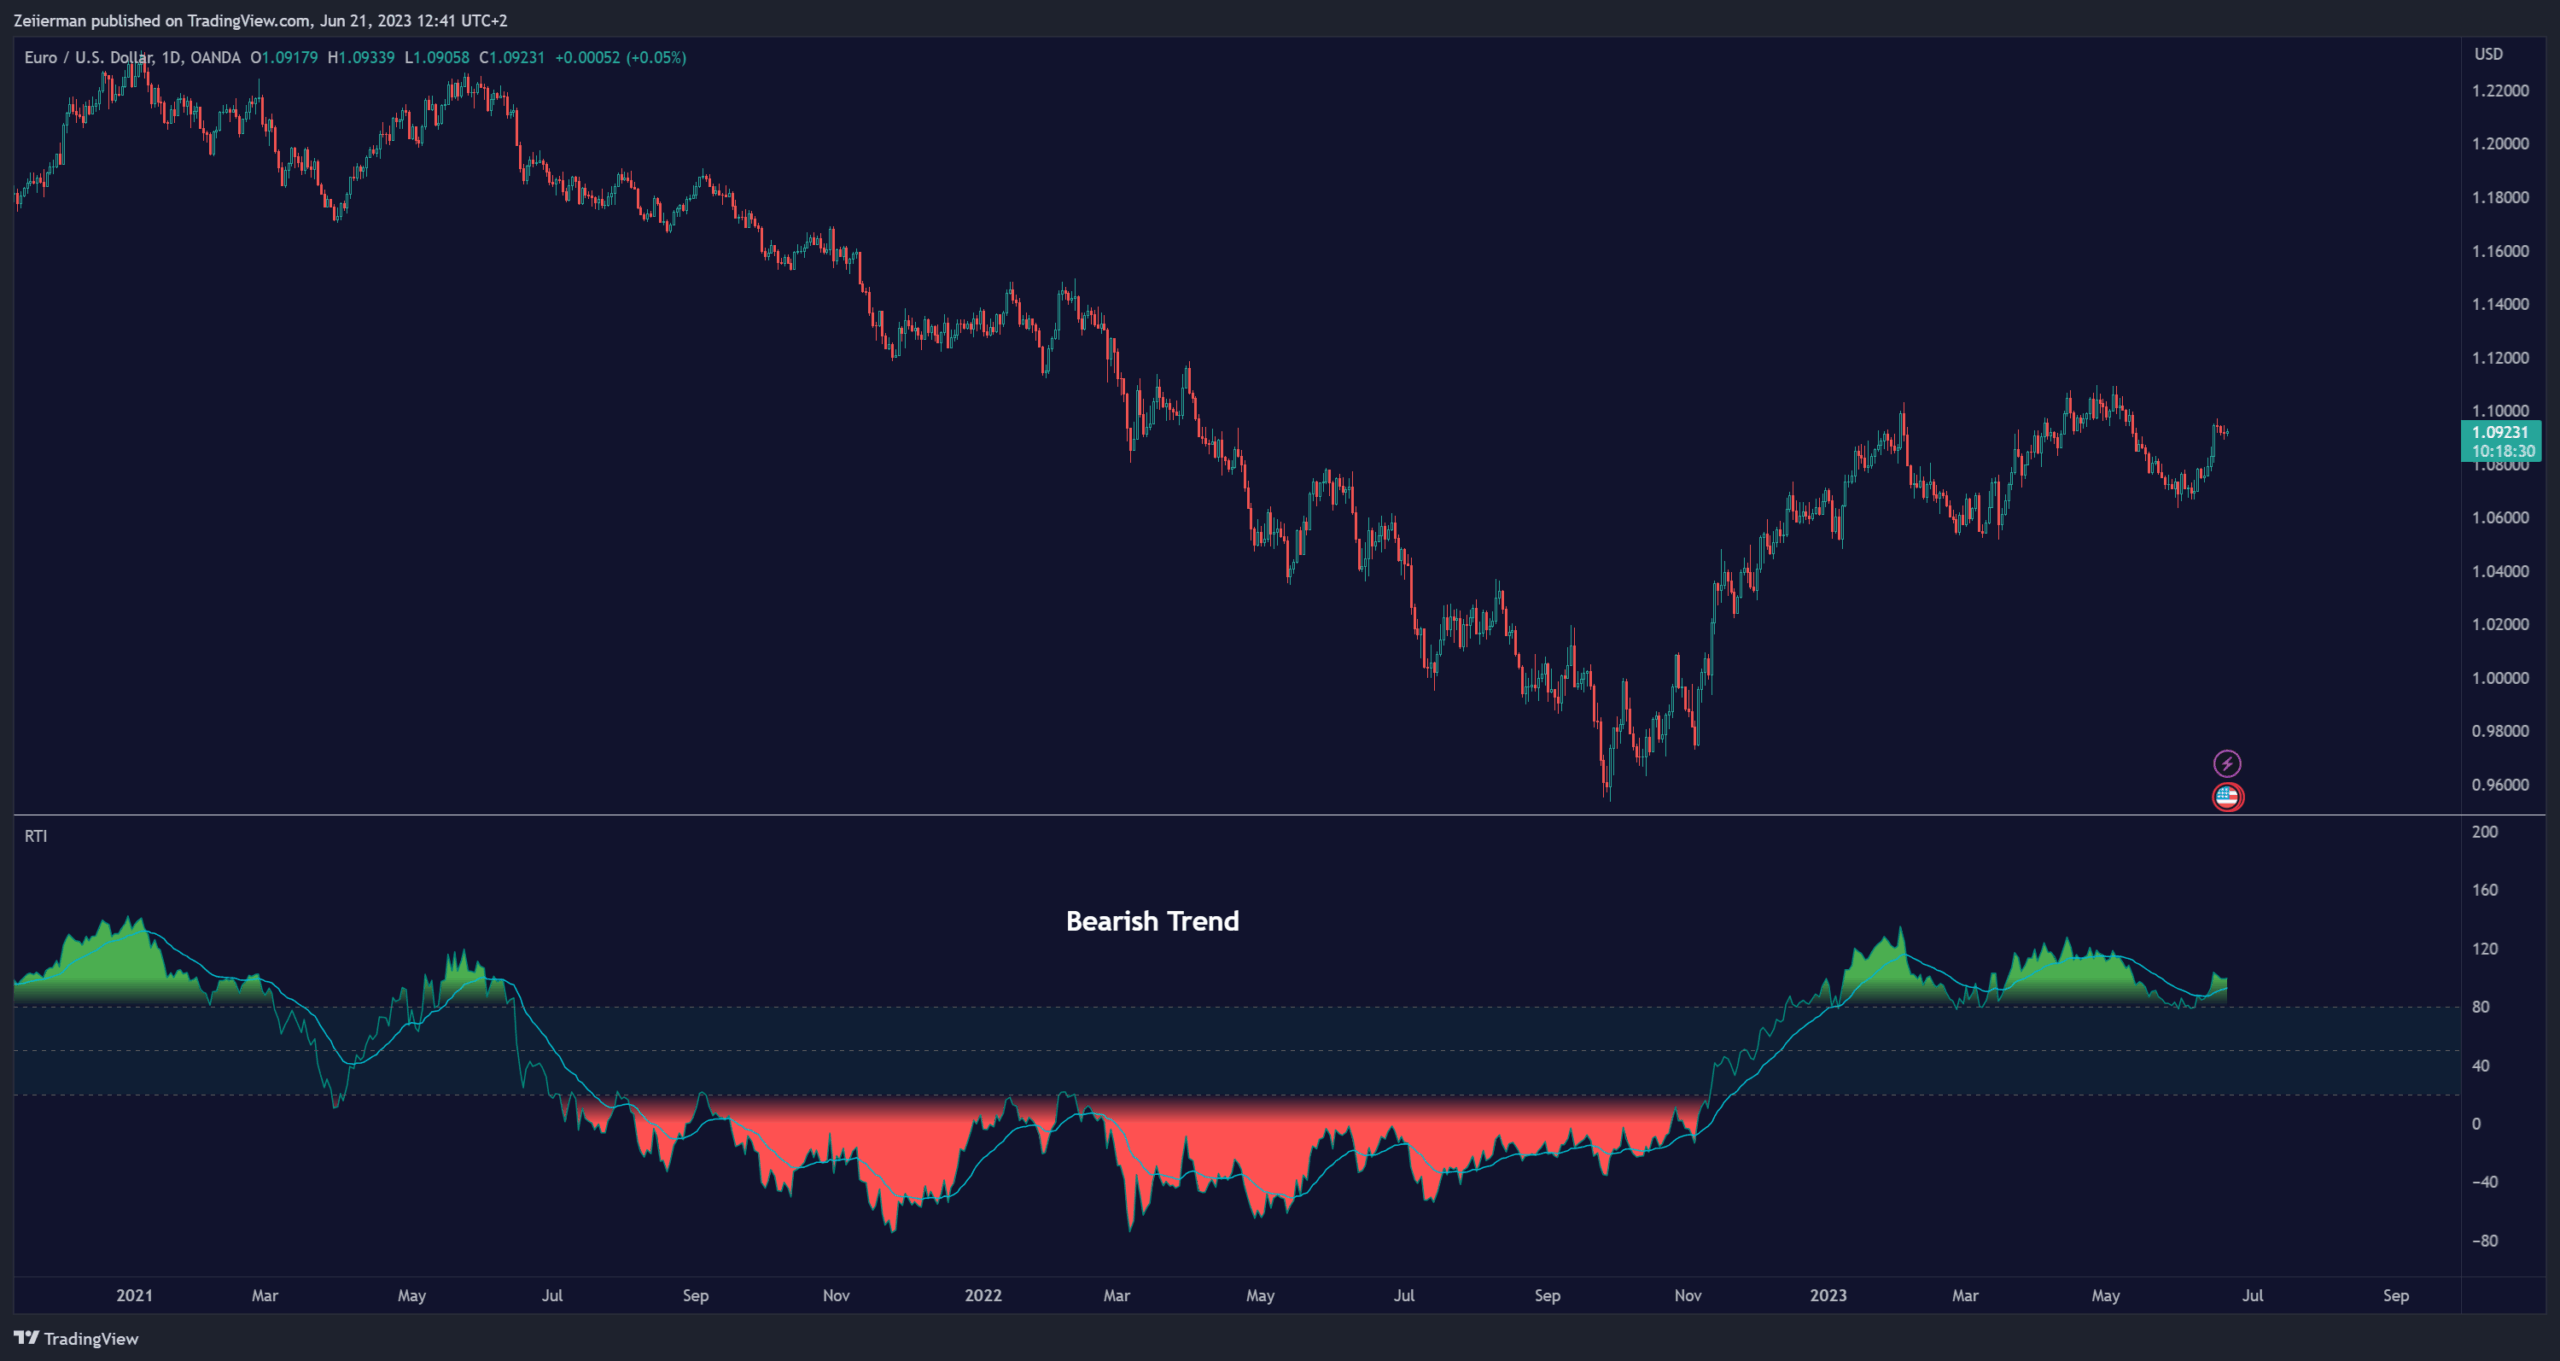
The RTI plots a line that revolves around a mid-point of 50. When the RTI is above 50, it implies that the market trend is bullish (upward), and when it’s below 50, it indicates a bearish (downward) trend. Furthermore, the farther the RTI deviates from the 50 line, the stronger the trend is perceived to be.
Bullish
Bearish
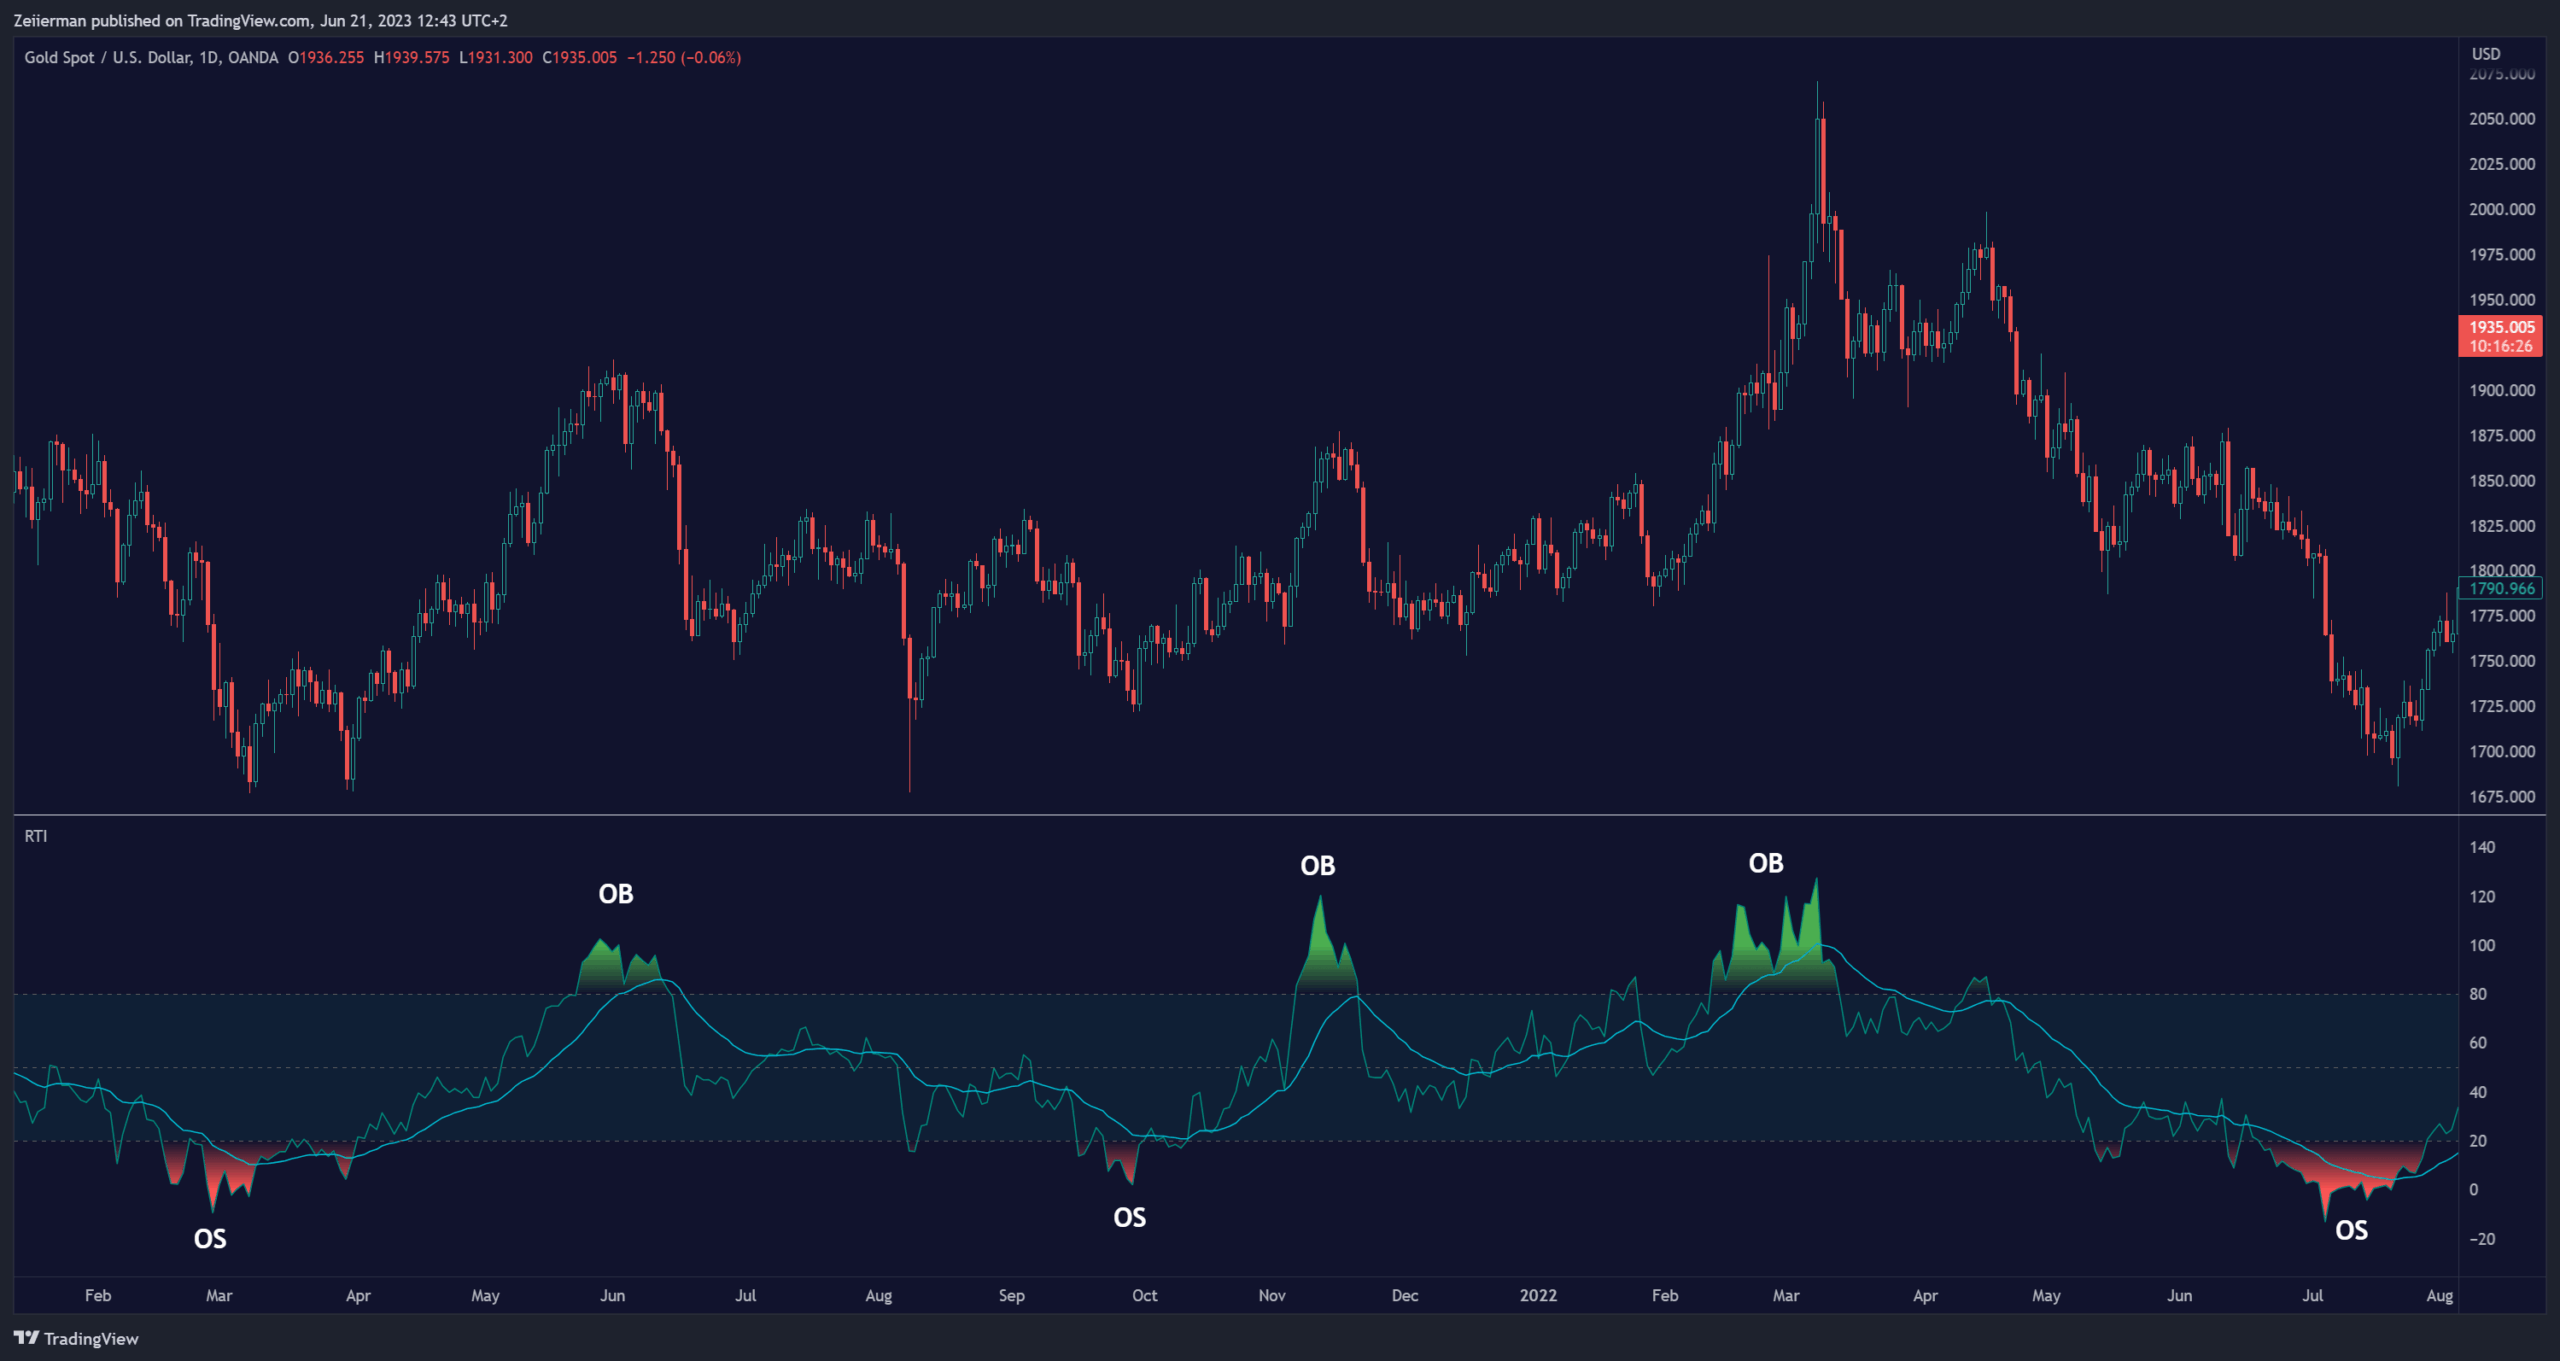
The RTI includes user-defined Overbought and Oversold levels. These thresholds suggest potential trading opportunities when they are crossed, serving as a cue for traders to possibly buy or sell. This gives the RTI an additional use case as a mean-reversion tool, in addition to being a trend-following indicator.
In short
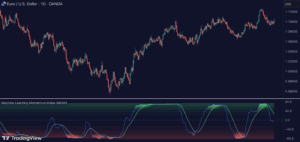
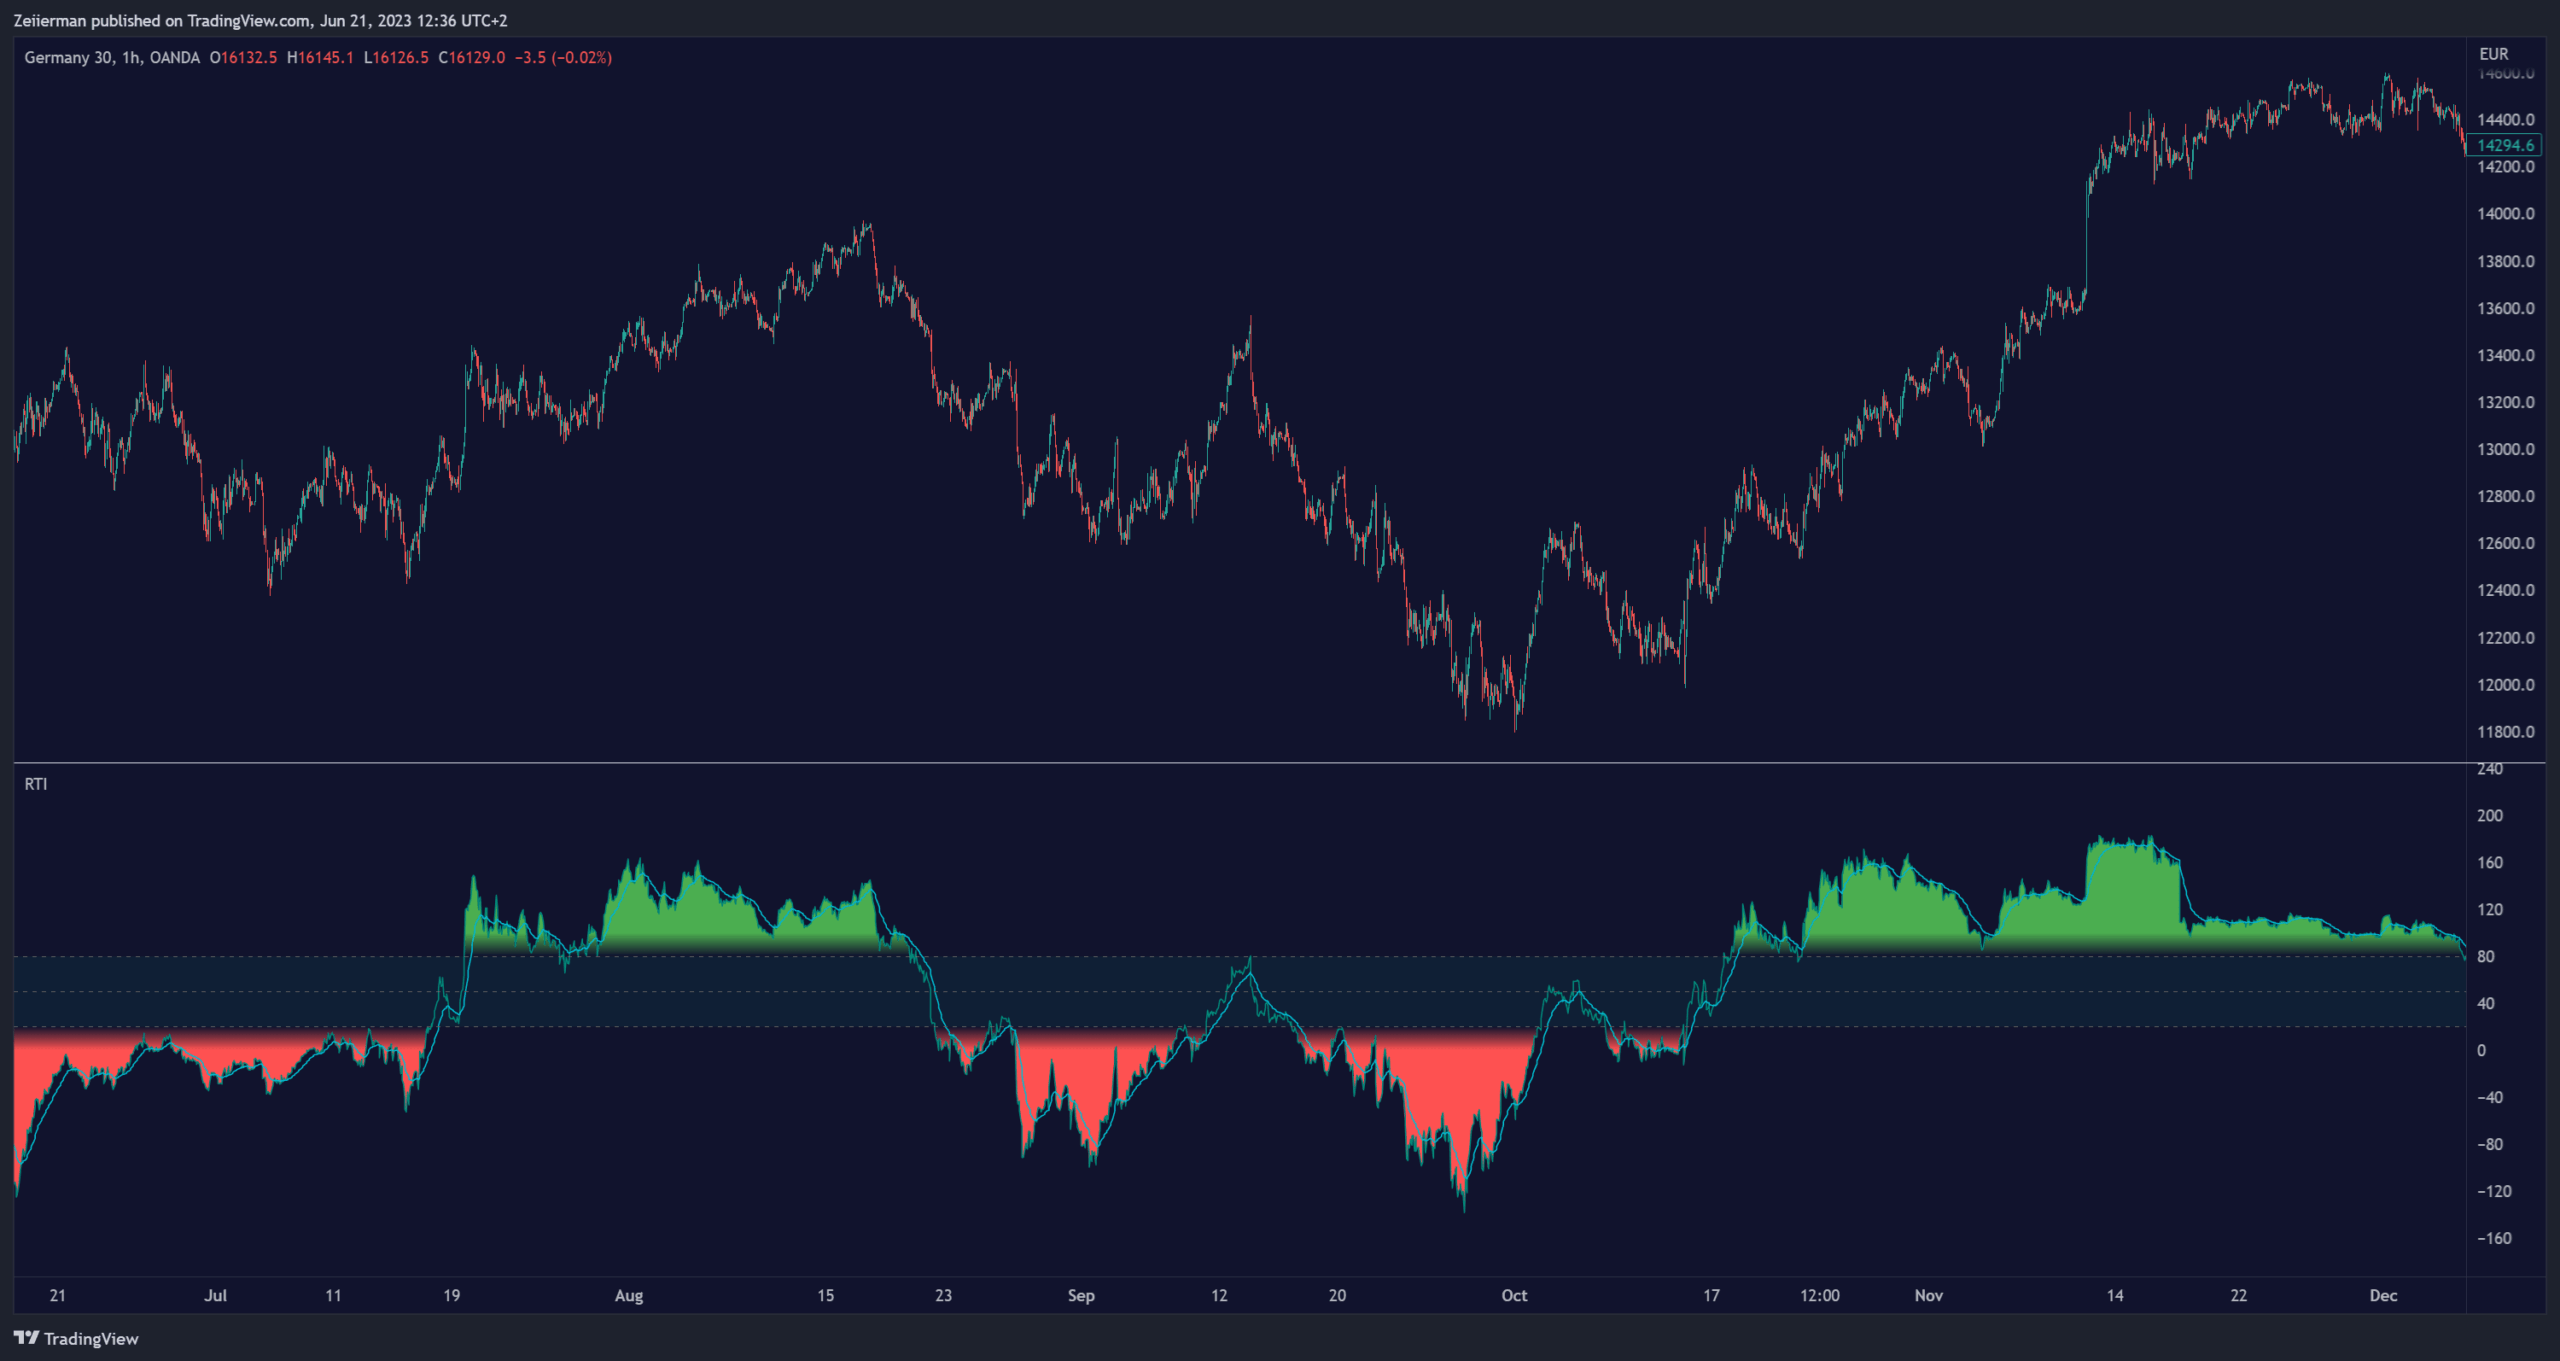
- Trend Confirmation and Reversals: If the percentage trend value is consistently closer to the upper level, it can indicate a strong uptrend. Similarly, if it’s closer to the lower level, a downtrend may be in play. If the percentage trend line begins to move away from one trend line towards the other, it could suggest a potential trend reversal.
- Identifying Overbought and Oversold Conditions: When the percentage trend value reaches the upper trend line (signified by a value of 1), it suggests an overbought condition – i.e., the price has been pushed up, perhaps too far, and could be due for a pullback, or indicating a strong positive trend. Conversely, when the percentage trend value hits the lower trend line (a value of 0), it indicates an oversold condition – the price may have been driven down and could be set to rebound, or indicate a strong negative trend. Traders often use these overbought and oversold signals as contrarian indicators, considering them potential signs to sell (in overbought conditions) or buy (in oversold conditions). If the RTI line remains overbought or oversold for an extended period, it indicates a strong trend in that direction.
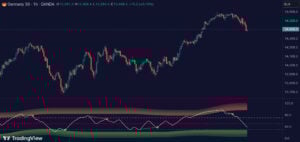
Settings: One key feature of the RTI is its configurability. It allows users to set the trend data length and trend sensitivity.
- The trend data length represents the number of data points used in the trend calculation. A longer trend data length will reflect a more long-term trend, whereas a shorter trend data length will capture short-term movements.
- Trend sensitivity refers to the threshold for determining what constitutes a significant trend. High sensitivity levels will deem fewer price movements as significant, hence making the trend less sensitive. Conversely, low sensitivity levels will deem more price movements as significant, hence making the trend more sensitive.
Zeiierman
With over 16 years in the market, Zeiierman has extensive experience as a full-time trader and risk advisory consultant for hedge funds. He has developed many profitable trading strategies, drawing on his background in risk management and strategy execution.
More from Zeiierman