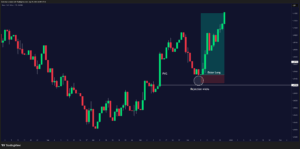
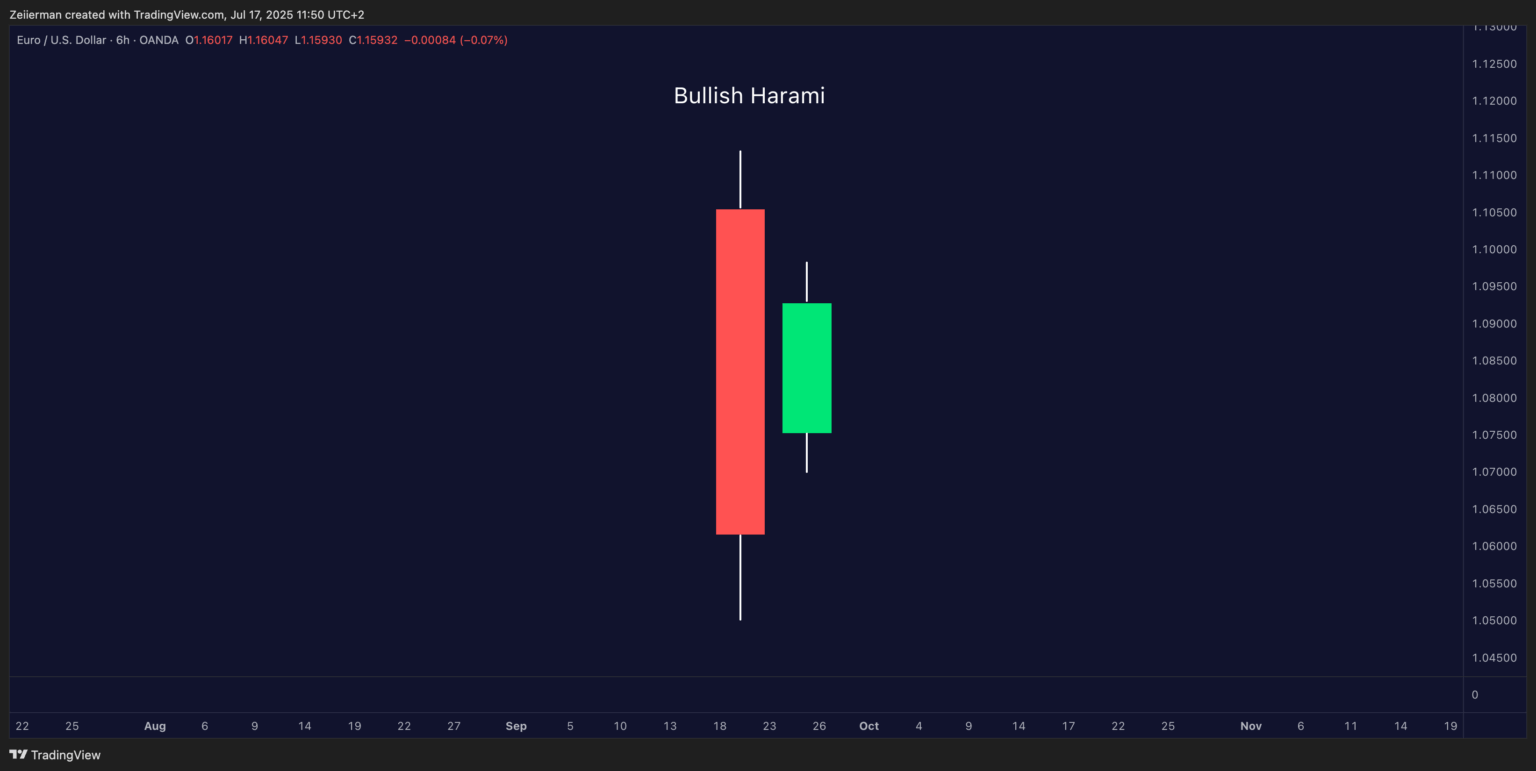
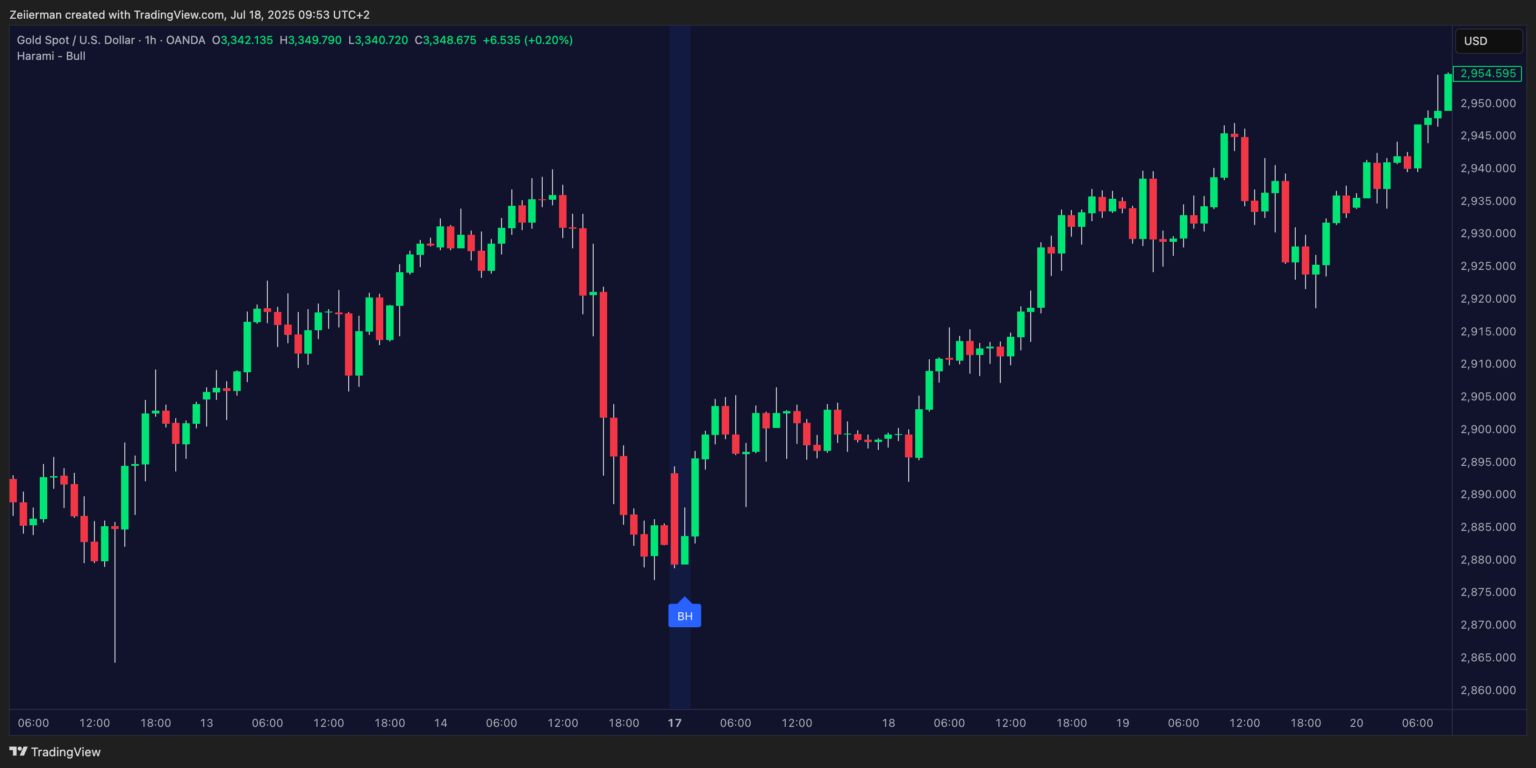
The Bullish Harami is a two-candle reversal pattern that shows up at the bottom of a downtrend. The first candle is long and red (bearish), which is an indicator of strong selling pressure. The second candle is small and green (bullish) and sits inside the body of the first candle.
The Bullish Harami candlestick gets its name from the Japanese word “harami,” meaning “pregnant.” Think of it as a mother candlestick carrying a baby – that visual will make perfect sense once you see the pattern.
1. How to find (and validate) a Bullish Harami Pattern?
Spotting a legit Bullish Harami pattern in the wild isn’t as simple as finding any red candle followed by any green candle. This pattern happens frequently but VERY randomly. In my last few decades of being a trader, I have made a small checklist to find and validate the pattern:
Prior downtrend: A Bullish Harami only works its magic when it shows up in a clear downtrend. Finding this pattern in the middle of an uptrend or sideways market is not worth reviewing and re-adjusting your trading strategy. That’s like finding a life jacket in the desert – incredibly interesting but not quite useful.
First candle: The mother candle needs to be a strong, bearish one that shows real conviction from the sellers. We want a candle with a notable body, not some wimpy little red line.
Second candle: Now, for the baby candle, this is where your criteria must be even more specific. This must be a bullish candle that fits completely within the body of the mother candle.
Volume: In terms of the volume profile, you will see a lower volume on the red candle and a slight uptick on the green candle. This shows bearish exhaustion and adds credibility to the reversal.
No gap down: Ideally, the second candle opens and closes within the previous candle’s body with no major gap.
2. The Psychology Behind the Pattern
It has been my long-standing belief that understanding what’s happening behind the scenes in the market and a pattern makes you a better trader. The mother candle represents bears in full control: they’re confident, aggressive, and pushing prices down hard. Sellers are everywhere, and buyers are nowhere to be found.
And then…the next session opens. Suddenly, the bears can no longer push prices down as aggressively anymore. Perhaps some bargain hunters may have stepped in, or perhaps the sellers simply grew tired. In any case, that small bullish candle represents indecision and weakening bearish momentum.
What does that tell us? First, sellers are hesitating. Second, buyers are testing the waters. And third, momentum is shifting. It’s a tug-of-war, and while the bulls haven’t won yet, the bears aren’t in full control anymore either.
3. How to trade the Bullish Harami Candlestick correctly?
Alright, class, enough theories; it is now time for the money-making part. Let’s talk about trading this pattern the correct way. If you have been reading my guides, you know that I always try to present two approaches: conservative and aggressive. You can choose either depending on your trading style and risk appetite.
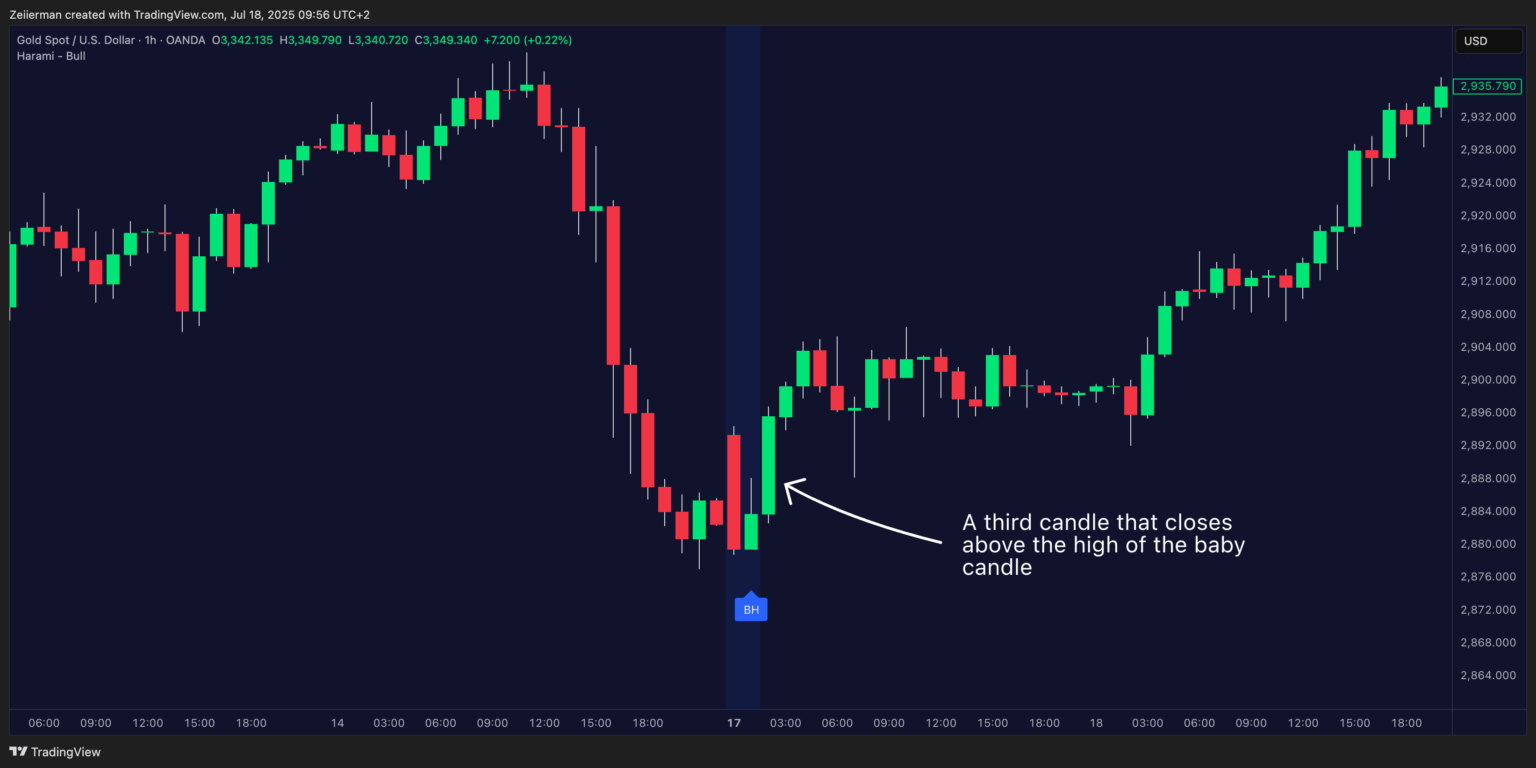
A. Conservative Approach: Wait for Confirmation
The smart money move is to wait for a confirmation candle after spotting Bullish Harami. We want to see a third candle that closes above the high of the baby candle. This would confirm that bulls have broken the stalemate and are now pushing higher. Once this is confirmed, you can enter your long position.
📌 Pro Tip: Enter a 50% position on the third candle close above the high of the second handle. Add the remaining 50% on a pullback to or slightly above the second candle high.
Place your stop loss 1-2 ticks below the LOW of the Harami candle (second candle). If the price breaks below the Harami candle low, the reversal attempt has likely failed, and the bears are back in charge. It’s crucial that you cut your losses as fast as possible. Additionally, you can add a little buffer in case of a volatile market, such as crypto.
You could put the target 1 (T1) at the nearest major resistance level. The nearest major resistance level can be calculated based on the previous swing high, key moving average, or the psychological price level. For target 2 (T2), aim for a 1:1.5 or 1:2 Risk/Reward Ratio. Once T1 is hit, move your stop to BREAKEVEN. Finally, as the price climbs towards T2, trail your stop near or below T1 to lock in profits.
Read: Why TradingView is Perfect for Beginners in 2025B. Aggressive Approach: Enter at the Close
If you’re comfortable with higher risk for potentially higher rewards, you can enter your position right at the close of the baby candle. This gets you through the door much earlier, thereby maximizing your profit potential if the reversal plays out. The catch is that you’re taking on quite a risk. Without confirmation, you’re essentially betting that this Harami candle will work based purely on the pattern itself.
This approach works best when you’ve other supporting factors, such as oversold RSI readings or strong support levels nearby. Some traders prefer placing their stop below the low of the baby candle to reduce their risk per trade. However, it also increases the chances of their stops being triggered by normal market noise. Regarding the profit target, you can proceed with the previous resistance levels. Alternatively, the Fibonacci retracements work quite well, too.
📌 Pro Tip: Use this approach only when you’re very confident in the setup.
4. What is a Bullish Harami Cross?
A Bullish Harami Cross is a special variation of the traditional Bullish Harami pattern. While the classic version involves a small-bodied candle inside the range of a larger bearish candle, the Harami Cross replaces that second candle with a Doji. For those unfamiliar, a doji candle has almost no body because its open and close prices are nearly identical. The Doji itself is a symbol of market indecision.
When paired with a preceding strong bearish candle, it signals that selling pressure is losing steam, and the market may be ready to reverse. Compared to a standard Bullish Harami, the Harami Cross is generally considered a stronger reversal signal, especially when it occurs after a prolonged downtrend or at key support zones.
A. How to identify a Bullish Harami Cross on the chart?
Here’s what I would look for:
- A long bearish candle showing strong downward momentum.
- A Doji candle that forms entirely within the high-low range of the previous bearish candle.
- The pattern should appear after a downtrend, not in consolidation.
- Ideally, the volume should dry up during the Doji formation, which confirms the indecision and potential exhaustion of the current market trend.
📌 Pro Tip: Mark the midpoint of the first candle. If the next few candles close above it, the pattern gains even more strength.
B. How to trade the Bullish Harami Cross?
The trading setup for a Bullish Harami cross is quite similar to a traditional Bullish Harami candlestick pattern. Here’s what my setup usually looks like:
- Entry: Enter long when the price closes above the high of the Doji candle.
- Stop-loss: Place your stop below the low of the entire pattern (i.e., the low of the first candle).
- Take-Profit (Target): For conservative traders, your target would be the recent swing high or a nearby resistance level. Alternatively, you can use a measured move, projecting the size of the first candle upward from the breakout – only if you wish to be aggressive with your targets.
I recommend that you study the broader market context in addition to identifying and validating the pattern. Use RSI divergence, MACD crossover, or a Smart Money Concepts (SMC) CHoCH as additional confirmation. Avoid trading Harami Crosses that form in the mid-range or inside a chop. The setup works best when prices are overstretched and the market sentiment is clearly leaning toward exhaustion.
5. How to identify a failing Bullish Harami pattern?
Let’s be real—no pattern works 100% of the time. And the Bullish Harami is no exception. False signals often occur in strongly trending markets where the overall bearish momentum is just too strong. That small bullish candle might represent nothing more than profit-taking from short sellers, not actual buying interest from bulls.
Market conditions matter greatly. During major geopolitical events, earnings disasters, or broader market crashes, technical patterns often get overwhelmed by fundamental factors. The pattern is not foolproof. It fails, especially in choppy (sideways) markets, and performs best in clear downtrends.
Here are some tips to properly trade Harami Candlestick pattern:
- Backtest: Open historical charts. How often did confirmed Harami candles lead to bounces? Where did they fail? Note the context when considering the volume, trend, and support levels.
- Combine with other indicators for stronger signals. An oversold RSI reading (below 30) or a bounce off a major support level can add clarity to your Harami candle trade. Don’t rely on the pattern alone – stack the odds in your favor.
- Volume analysis can make or break your trade. Look for the mother candle to form on above-average volume (heavy selling) while the baby candle forms on lighter volume (selling exhaustion).
Get access to Zeiierman’s Trend & Pullback Toolkit!
6. How to Trade Bullish Harami with Technical Indicators?
When you’re doing technical analysis for your next trade, it’s incredibly important to confirm the pattern you’re seeing with additional tools. It adds an extra layer of security and filters against false market signals. Since the Bullish Harami is a momentum-reversal signal, it works best when paired with momentum indicators and supported by volume-based confirmation.
As for @Zeiierman and I, we prefer using indicators such as the Relative Strength Index (RSI), Stochastic RSI, and the Moving Average Convergence Divergence (MACD). These momentum-focused indicators work well with the Bullish Harami pattern, as the pattern in front of you can be validated by confirming the overbought and oversold levels that the momentum-based indicators signal.
A. Trading Bullish Harami with RSI and Stochastic RSI
RSI is one of the cleanest ways to validate a Bullish Harami setup, especially when you’re unsure whether the market is showing real strength or just pausing before moving further south. Here’s how to use the two RSI indicators for Bullish Harami:
Firstly, wait for the pattern to form after a downtrend. Assuming it doesn’t appear in the chop or mid-range, check if the RSI is near or below the oversold threshold (30), indicating exhaustion. Next, open your Stochastic RSI and look for a bullish crossover below the 20 level. This is typically a rapid and early indication.
📌 Our Relative Strength Index (RSI) and Stochastic Signal indicators are absolutely free and available for everyone. Check them out today.
For added confirmation, wait for RSI to begin rising or break back above 30. We’re looking for confluence here, not a random crossover.
📌 Pro Tip: On lower timeframes (5m–15m), these indicators can create noise. If you’re scalping, combine with volume and SMC levels for stronger confirmation.
Read: RSI vs Stochastic RSI: A Comprehensive Guide for Trading BeginnersB. Trading Bullish Harami with MACD
Moving Average Convergence Divergence (MACD) is particularly effective when you’re trying to gauge the momentum shift behind a potential reversal. Here’s how I use MACD in this context:
Wait for the Bullish Harami pattern to form after a proper downtrend, not in the middle of chop or sideways noise. Next, check if MACD is showing a bullish crossover. It is when the MACD line crosses above the signal line. Bonus points if the crossover happens below the zero line because it typically signals a stronger reversal potential.
📌 The crossover must happen either during or within a few candles after the Harami formation to count as real confirmation.
We also offer a combination of indicators that combine RSI and MACD to utilize momentum and crossover logic in a single, streamlined view. It is perfect for those seeking to simplify their charting experience without missing any important data. Check out our two free indicators by getting access through our website:
C. Trading Bullish Harami with Fibonacci Retracements
Fibonacci Retracement is a powerful way to validate support zones and projects where the price might react or reverse. When a Bullish Harami forms near a key Fib level, it adds weight to the setup. Here’s how to use it effectively:
Draw the Fibonacci tool from the recent swing low to the swing high of the preceding trend (for deeper pullbacks) or from the most recent impulse wave (for short-term trades). Check this article to learn how to calculate Fibonacci Retracement levels. Watch closely if the Bullish Harami forms near the 38.2%, 50%, or 61.8% retracement levels — these are the most commonly respected zones. Ideally, the Doji or small-bodied candle of the Harami pattern should align with one of these levels, which reinforces the idea of market defending that zone.
📌 Pro Tip: If price bounces from the 50% or 61.8% level with a clean Harami and confirmation from a momentum indicator (like RSI or MACD), it’s one of the better confluence setups you’ll come across.
Read: Fibonacci Retracement Levels: Best Settings and Timeframes for TradingViewD. Trading Bullish Harami with Volume Profile
Volume Profile gives you insight into where the market participants are most active. After spotting a Bullish Harami near the end of a downtrend, open the Volume Profile for the recent swing or range. If the Harami has formed near a high-volume node (HVN), it suggests strong institutional interest. This is where major players are likely to accumulate.
It’s even better if the pattern forms just below or near a low-volume node (LVN) and then reclaims the higher-volume zone. This indicates a potential breakout from inefficiency or illiquidity.
📌 Pro Tip: If the price reacts positively at a point of control (POC) or reclaims a volume cluster after forming the Harami, that’s a solid confirmation.
Check out our plethora of Volume & Volatility indicators (both free and premium) to uplift your trading game.
E. Trading Bullish Harami with Moving Averages (MA)
Moving Averages (MAs) are not just for trend detection; they can also offer high-conviction confirmation for reversal patterns, such as the Bullish Harami.
Start by applying the 20-period and 50-period EMA to your chart. When a Bullish Harami forms above one of these EMAs, and the price holds above it on the next candle — that’s early confirmation that buyers are defending the level. If the Harami forms below the MAs but is immediately followed by a candle that breaks above the MA (with decent volume), treat it as a breakout setup instead.
📌 Pro Tip: A bullish crossover (20 EMA crossing above 50 EMA) after a Harami confirmation is one of the strongest mid-trend reversal signals.
F. Trading Bullish Harami with Bollinger Bands
Bollinger Bands help you contextualize when the market is overstretched or compressed. This makes the bands perfect conditions for Harami setups. If the first (bearish) candle of the Harami closes outside the lower Bollinger Band and the second candle closes back inside, it’s a strong mean reversion signal. This indicates that sellers have overextended themselves, and the market is rejecting lower prices.
For targets, the middle band (20 SMA) often acts as a magnet — this is your first logical take-profit. Aggressive traders can trail up to the upper band, especially if the price accelerates with volume.
📌 Pro Tip: Avoid Harami setups forming in the center of the band range. You want the pattern to occur during periods of extreme volatility.
7. Difference B/W Bullish and Bearish Harami
While both patterns are part of the Harami candlestick family, they signal opposite outcomes and appear in different market contexts.
| Feature | Bullish Harami | Bearish Harami |
|---|---|---|
| Market Context | Appears after a downtrend | Appears after an uptrend |
| First Candle | Large bearish candle showing strong selling pressure | Large bullish candle indicating strong buying pressure |
| Second Candle | Small-bodied bullish candle within the prior candle’s body | Small-bodied bearish candle within the prior candle’s body |
| Signal | Suggests trend reversal to upside | Suggests trend reversal to downside |
| Psychological Meaning | Bears are losing control, bulls are gaining ground | Bulls are losing steam, bears are stepping in |
| Stronger Variation | Bullish Harami Cross (second candle is a Doji) | Bearish Harami Cross (second candle is a Doji) |
Frequently Asked Questions (FAQs)
A. Is the Bullish Harami a strong reversal signal on its own?
Not always. The Bullish Harami is more of a warning sign than a decisive reversal. It indicates that bearish momentum is slowing, but reversal confirmation from the next candle or other indicators is crucial before taking action.
B. Is the bullish harami reliable?
The bullish harami candlestick pattern is a reliable early signal when it appears after a sharp downtrend or near a strong support zone. However, its reliability increases significantly when combined with other trading analysis tools (indicators), such as volume spikes, RSI divergence, or follow-through candles.
C. Is waiting for confirmation necessary for a Harami trade?
Waiting for that third confirmation candle can significantly improve your win rate and help you avoid dangerous false signals. Experienced traders might enter on the close of the baby candle if they have strong supporting factors, but patience usually pays off better than speed in this game.
D. What happens if the baby candle is a doji instead?
A doji baby candle actually strengthens the Harami pattern because it shows even more indecision in the market. This type of formation is sometimes referred to as a “Harami Cross” and often produces stronger reversal signals. The same trading rules apply – you just have even more evidence that the bears are losing steam.
SM_Trader
SM_Trader is a highly experienced coder and strategy developer who brings the most complex algorithms to life. As a member of MENSA, the prestigious organization for individuals with intelligence scores in the top 2% of the world, he combines exceptional analytical skills with a keen eye for numbers and statistics, empowering businesses to grow at the right pace and in the right direction.
More from SM_Trader