Works on the Following Platforms
TradingView
For use on the TradingView platform
Technical analysts use historical price data to predict the market and identify trading opportunities in price trends and patterns. This way of reading the market is becoming more and more common. However, some traders say that technical analysis doesn’t work. Today we want o show you one of the most consistent and successful trading patterns that have been around for years. Let’s introduce the Ross Hook formation and the Free Ross Hook Pattern Indicator. This free indicator and the knowledge about how to use it will take your trend trading to the next level.
Introduction
This article will cover the fundamental of the 1-2-3 reversal formation and an in-depth discussion about the Ross Hook Pattern and the Free Ross Hook Indicator (Expo). The Ross Hook Pattern, also called RH Pattern, is a trading strategy based on a 1-2-3 pattern breakout and is 100% based on price action.
The original definition of the Ross Hook formation is:
“Whenever a market trend is interrupted by a correction, no matter how slight, it will leave behind a Ross Hook. In a down market, a failure by price to make a new low constitutes a Ross Hook. In an upmarket, failure by price to make a new high constitutes a Ross Hook.” So a Ross Hook does only occur in a trending market! We define the trend by using the 1-2-3 pattern. The RH pattern is a sign that the trend is established.
Why traders don’t use the Ross Hook Pattern
If you are new to trading, finding a Ross Hook formation on your chart may take time and effort because you have to find the right 1-2-3 pattern. Once the 1-2-3 pattern is identified, the trader has to wait for the Ross Hook to appear. It can be time-consuming for new traders to look for these patterns. Therefore we have developed the Ross Hook Pattern Indicator that automatically and in real-time displays and notifies you when a Ross Hook occurs. To understand the Ross Hook, you need to understand the 1-2-3 pattern.
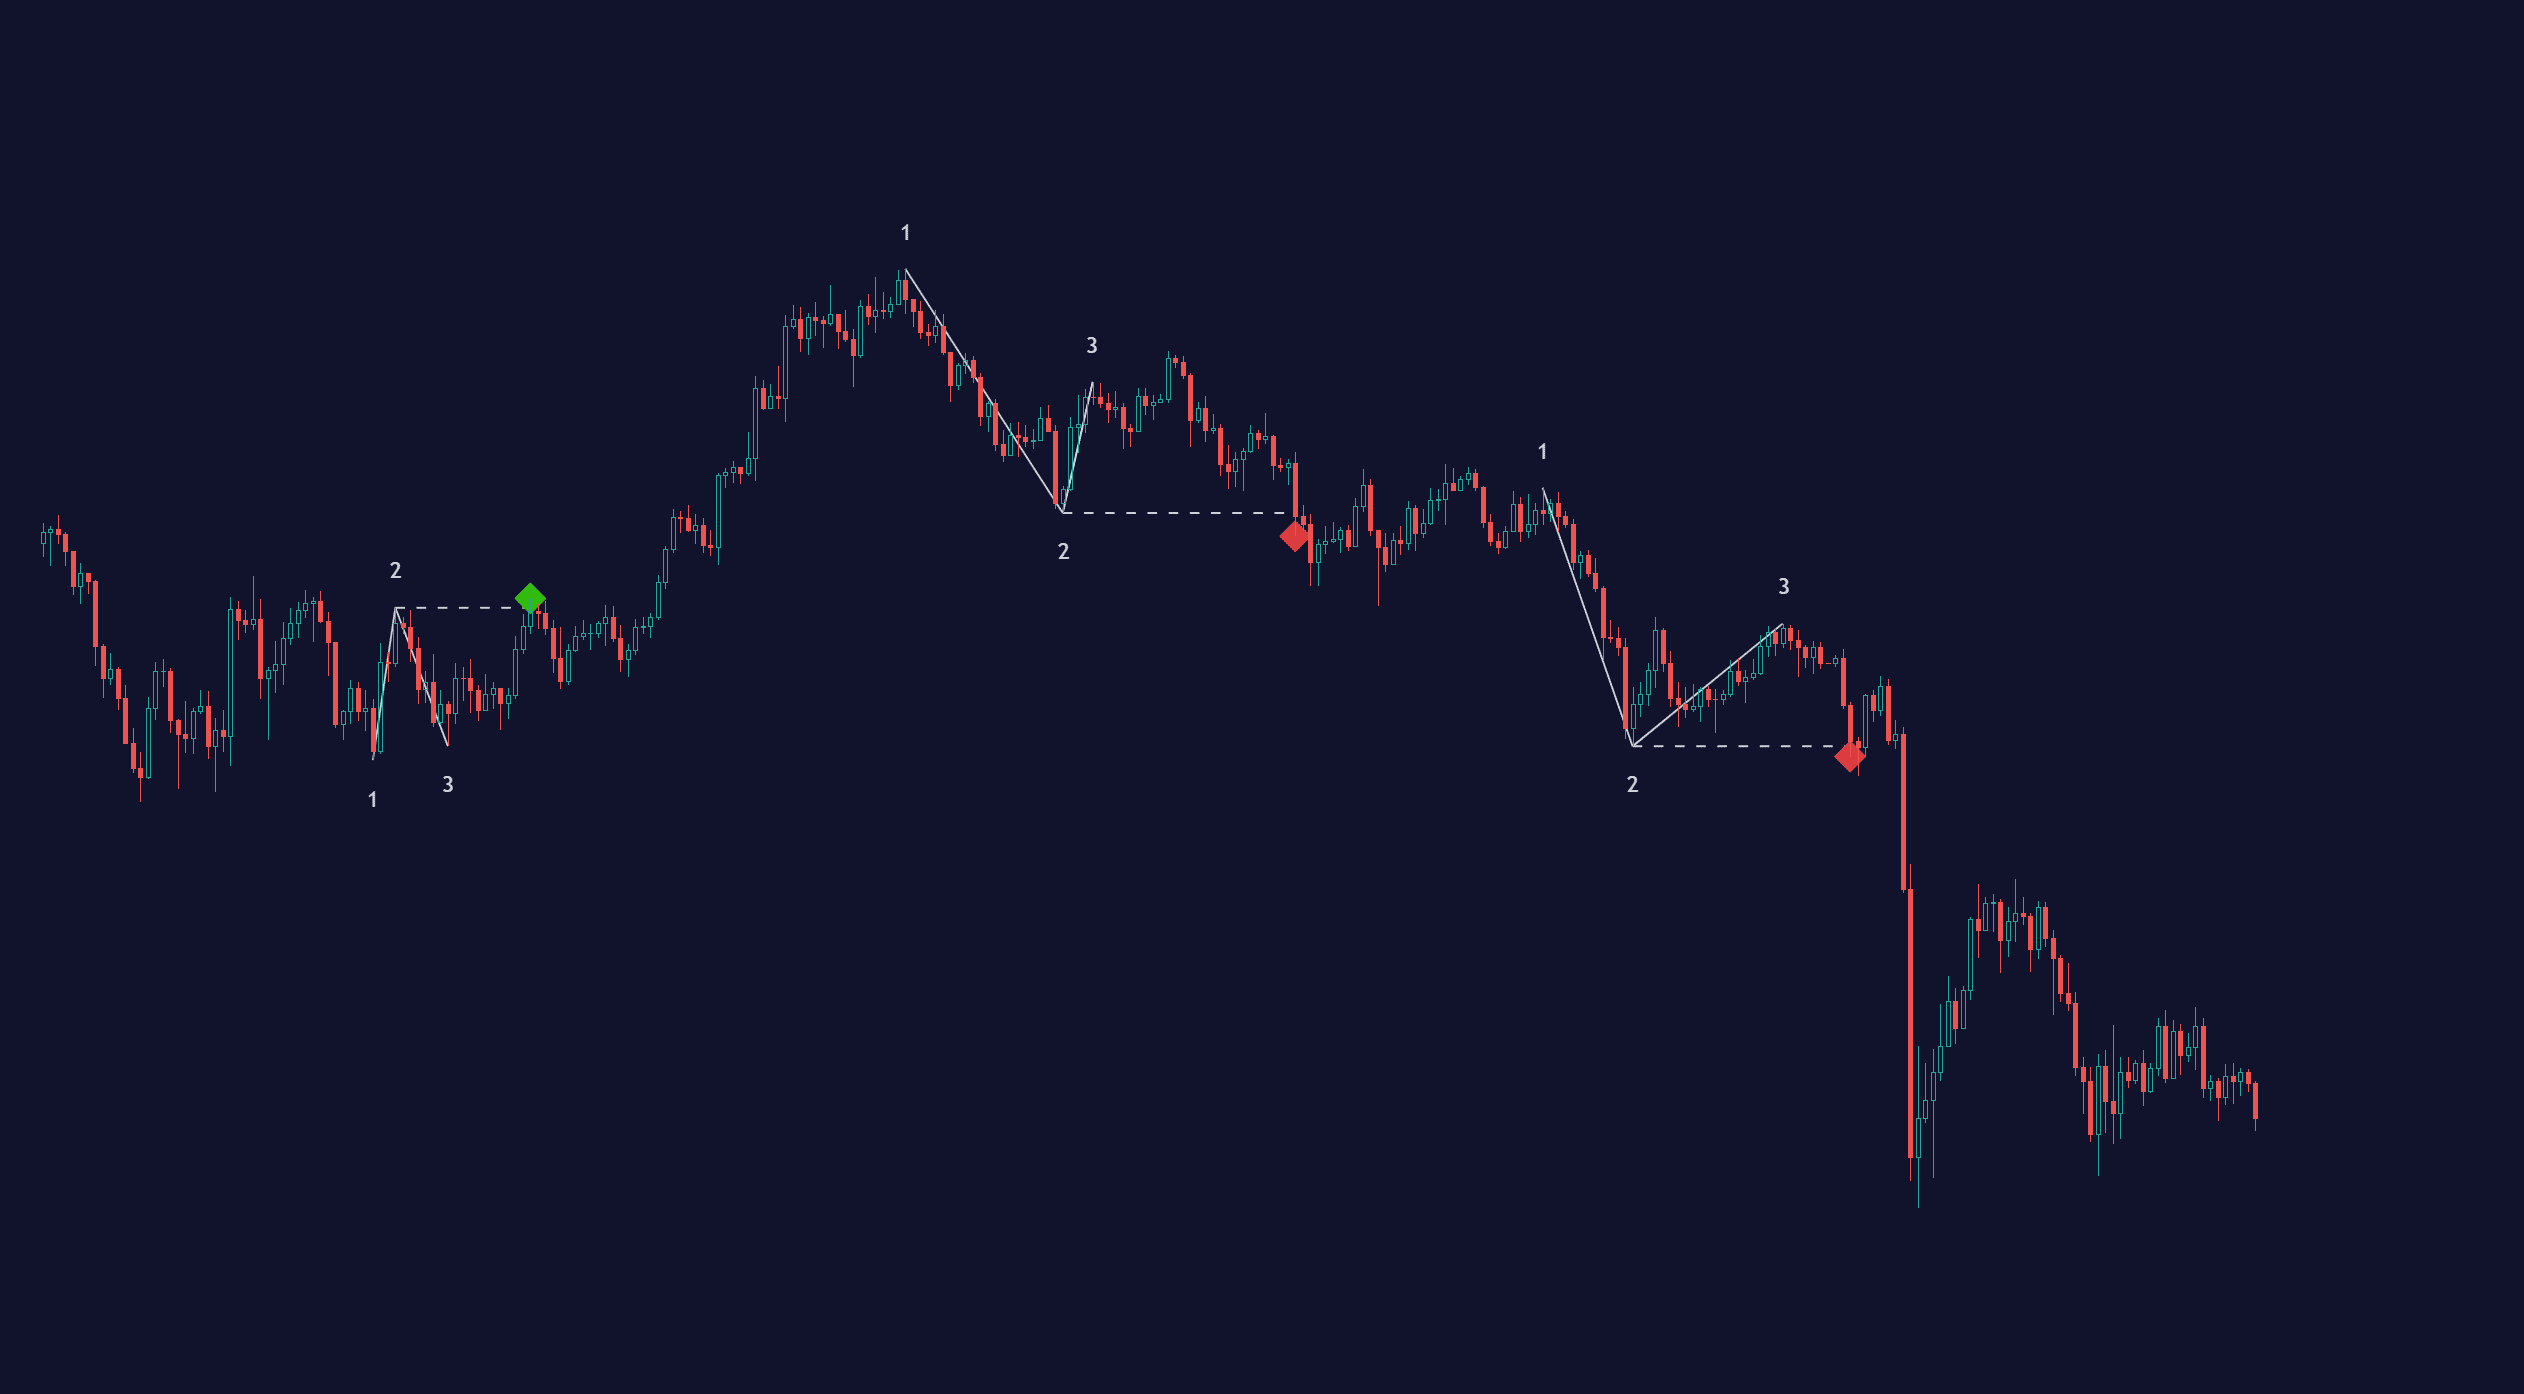
The 1-2-3 Reversal Pattern
The 1-2-3 pattern is used to identify and find trend reversals. It’s the first sign that an established trend may change, and a new one starts to form. All traders use this pattern even though they don’t know it because this is exactly the same as the price failing to make a new high or low, and a lower high or higher low follows it. HH/HL/LH -> Bearish trend shift. LL/LH/HL -> Bullish trend shift. This is a common way of identifying a trend change, which is what the 1-2-3 pattern is.
Read more about the 1-2-3 pattern!
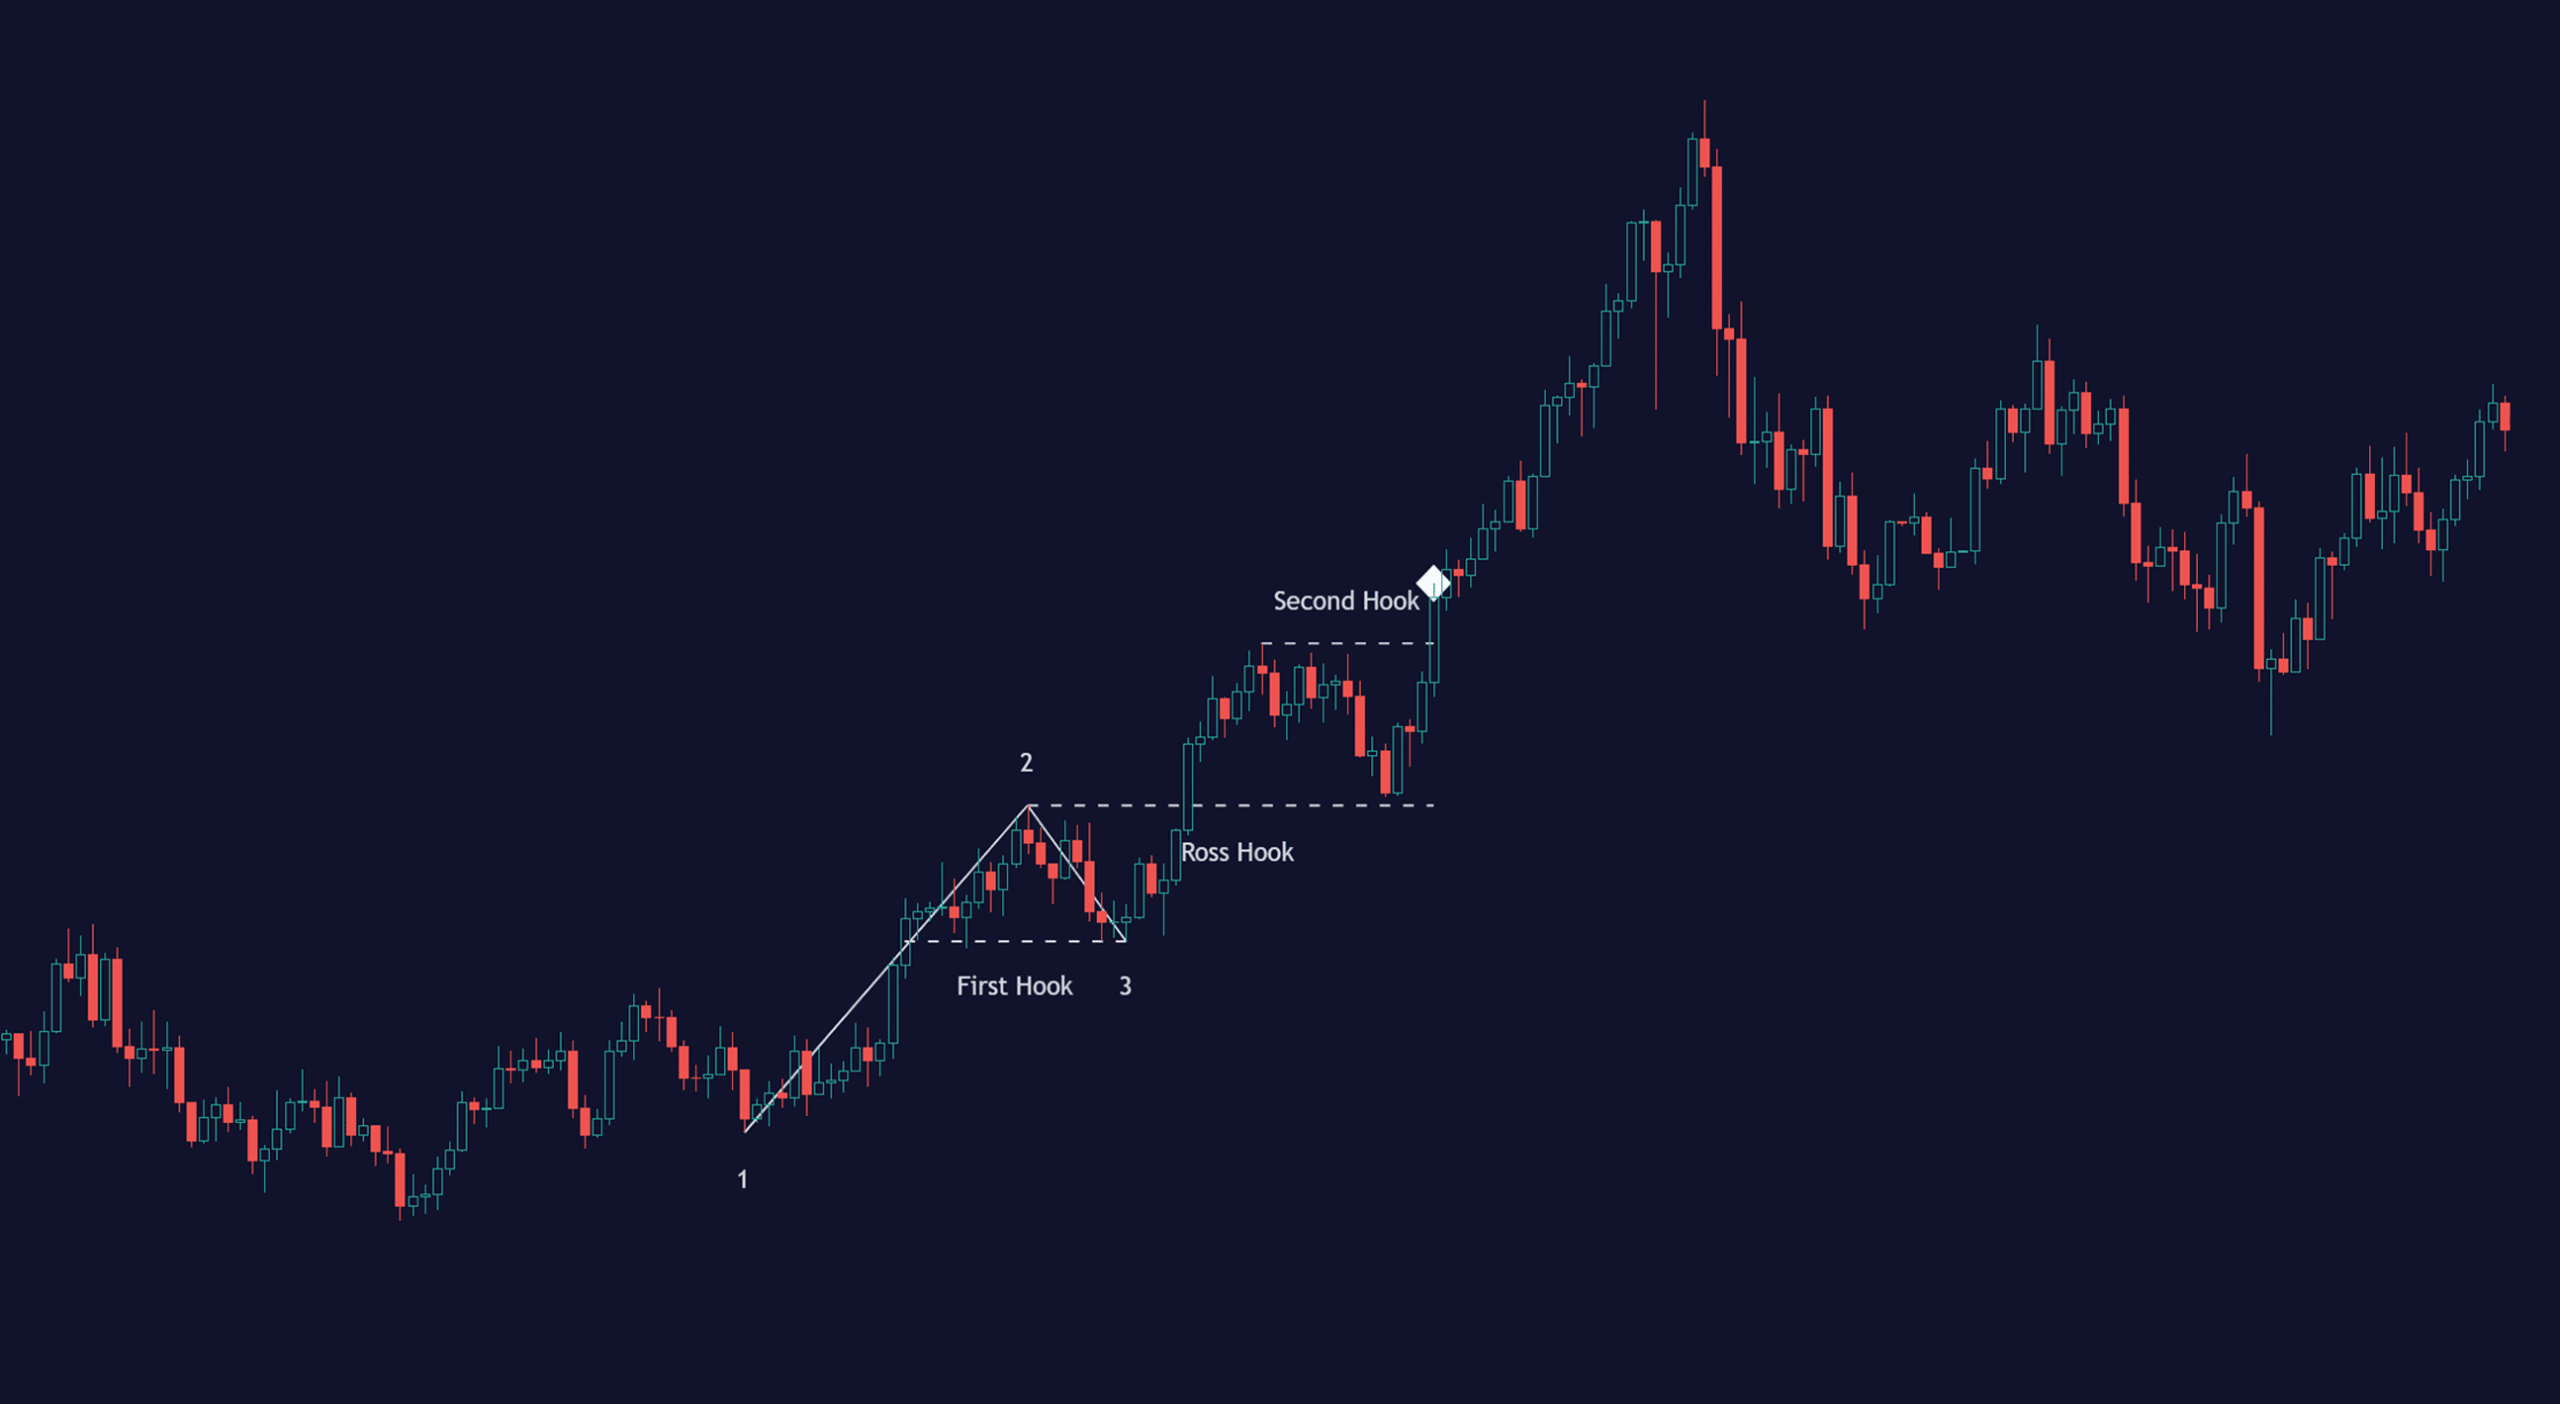
What is a Ross Hook Pattern?
The Ross Hook pattern combines the 1-2-3 reversal pattern followed by a price correction. The 1-2-3 pattern must be valid before an RH pattern can be spotted. This means that the Ross Hook only occurs in established trends.
How to identify an RH Pattern
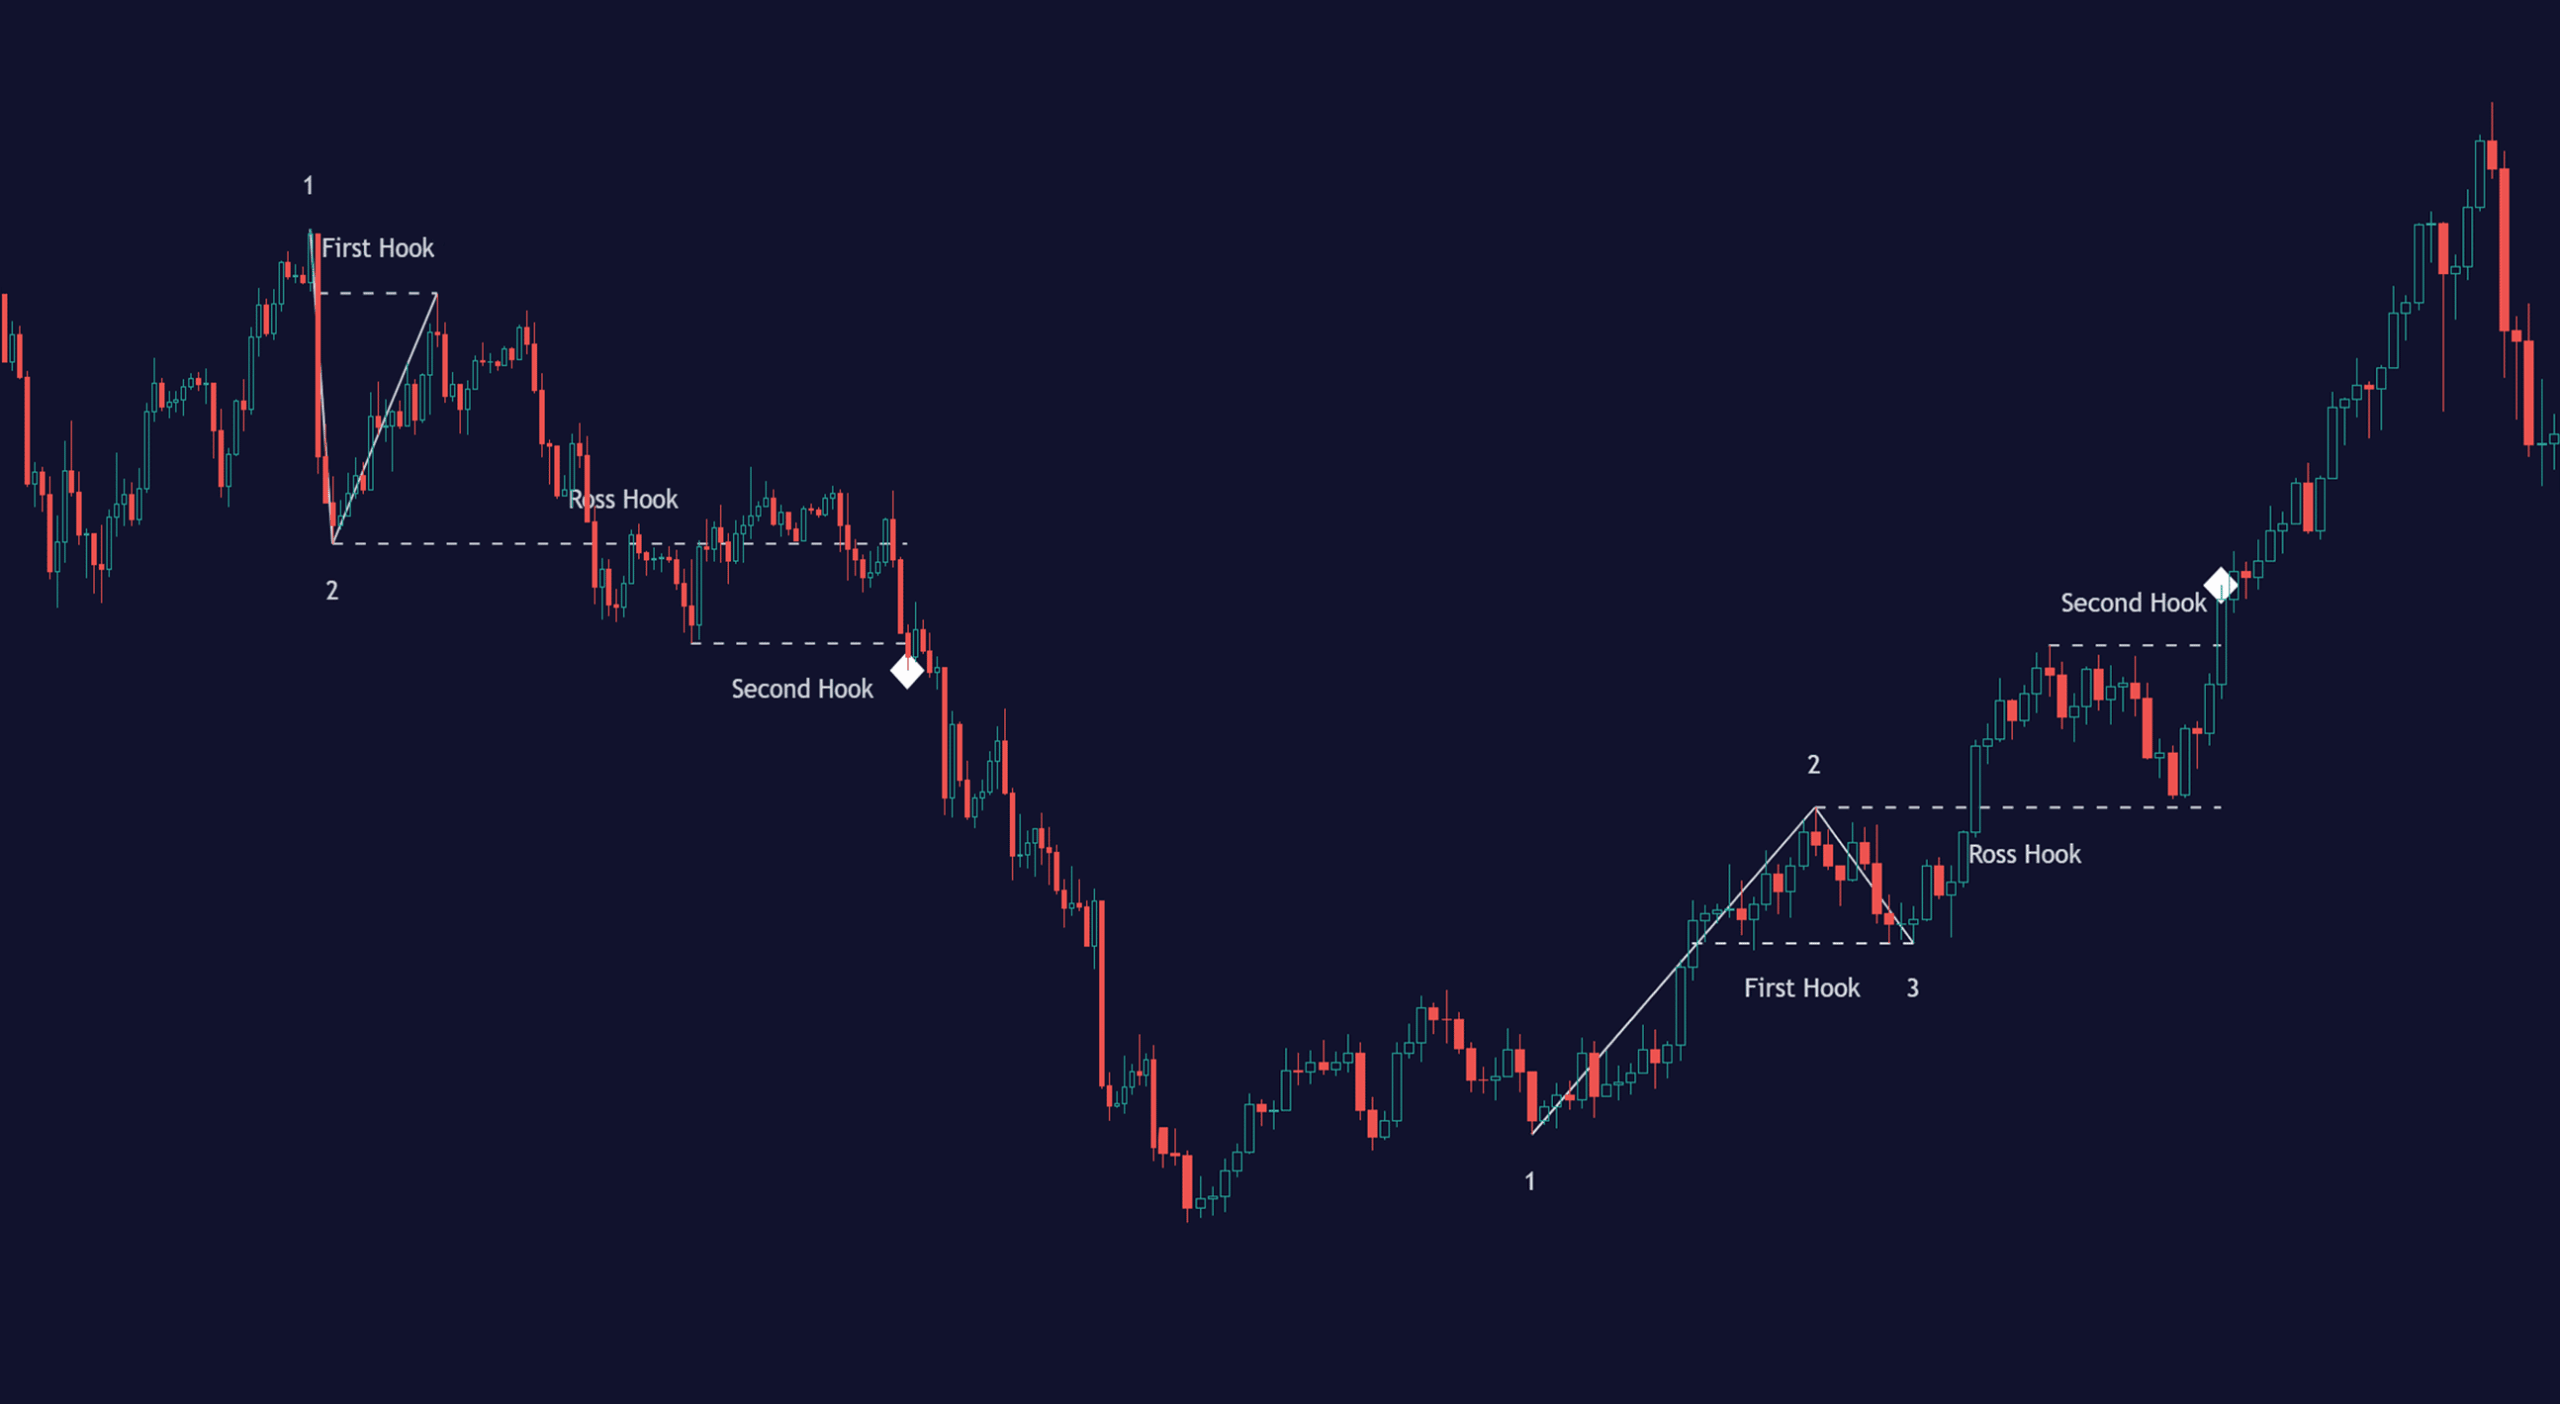
Bearish Ross Hook
First, the market topped out at point 1. That’s the highest high where supply exceeds demand. Bullish traders take profit, and the price drops to point 2. This move is enhanced by all bearish traders that go short. The price makes a move up again towards point 1, and again there are not enough traders willing to buy at these high prices, so the attempt to continue the upward trend fails. Finally, point 3 is created (a lower high). The Bearish Ross Hook (RH) occurs when the price breaks below point 2, followed by a reaction or correction. This market structure low-point is what we call a Ross Hook.
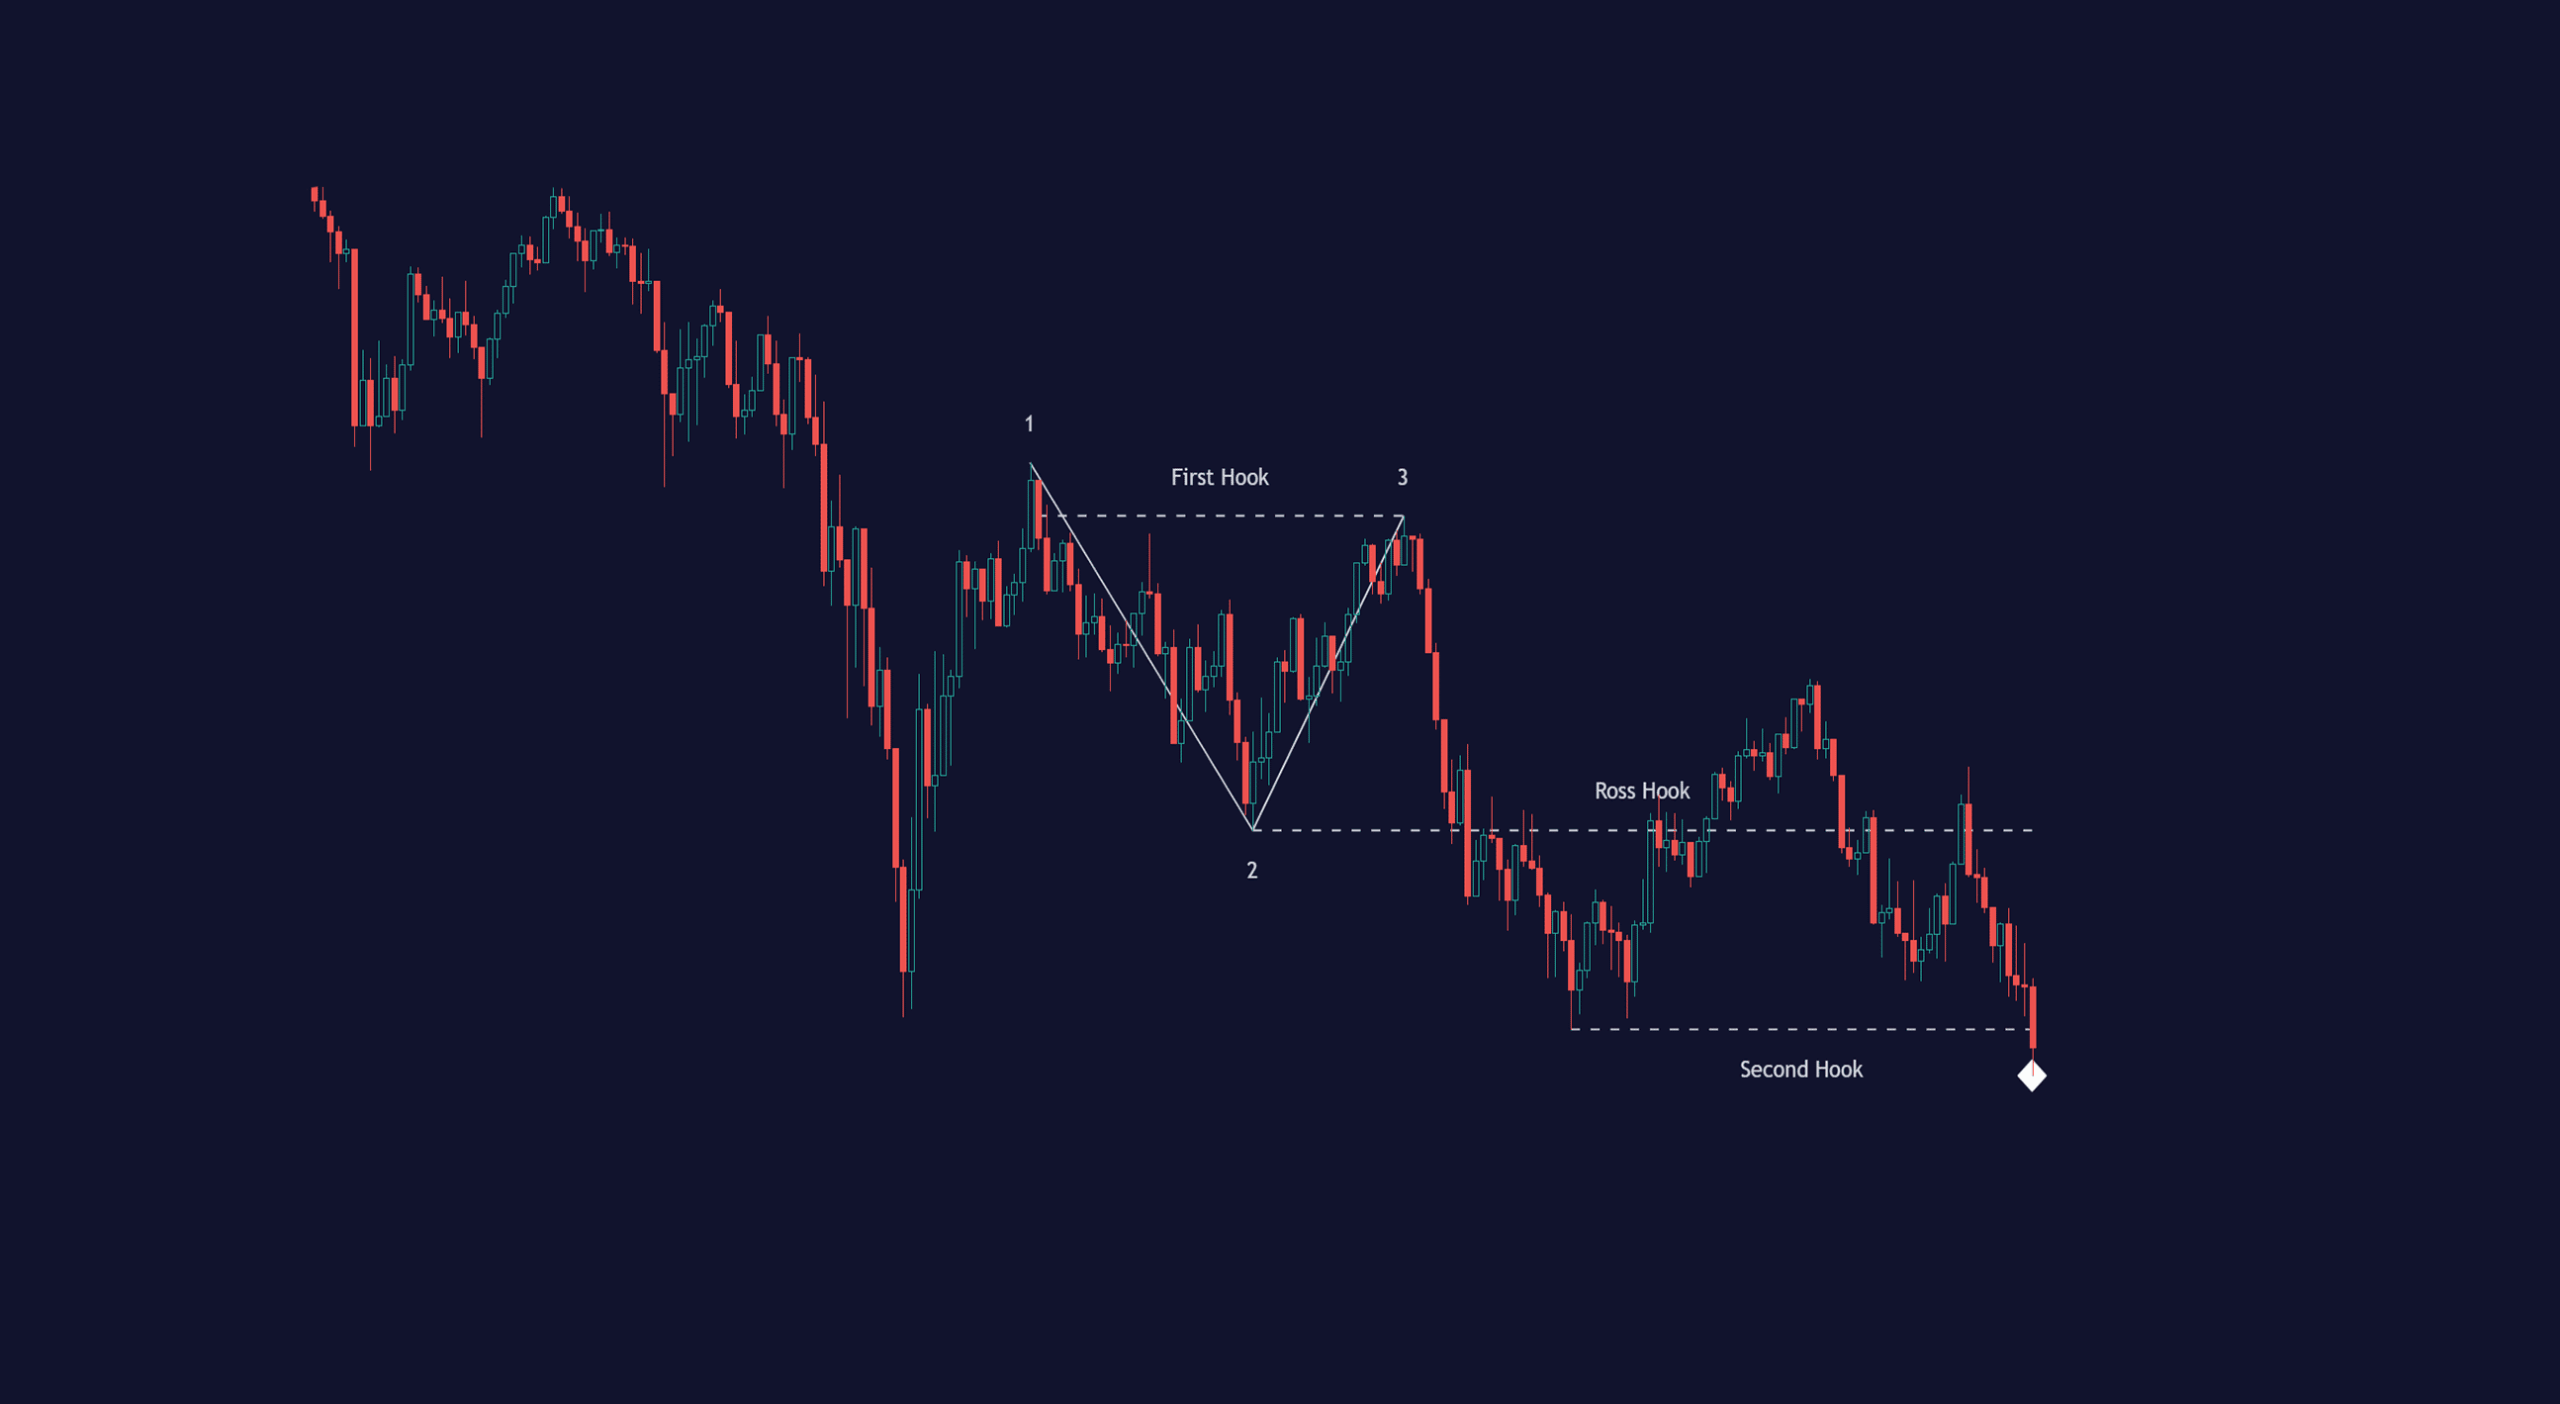
The Ross Hook pattern keeps repeating itself within the established bearish trend until a bullish 1-2-3 pattern is identified.
Bullish Ross Hook
First, the market bottomed out at point 1. That’s the lowest low where supply exceeds demand. Bearish traders take profit, and the price rise to point 2. This move is enhanced by all bullish traders that go long. The price makes a move downwards again towards point 1, and again there are not enough traders willing to sell at these low prices, so the attempt to continue the downward trend fails. Finally, point 3 is created (a higher low). The Bullish Ross Hook (RH) occurs when the price breaks above point 2, followed by a reaction or correction. This market structure high-point is what we call a Ross Hook.
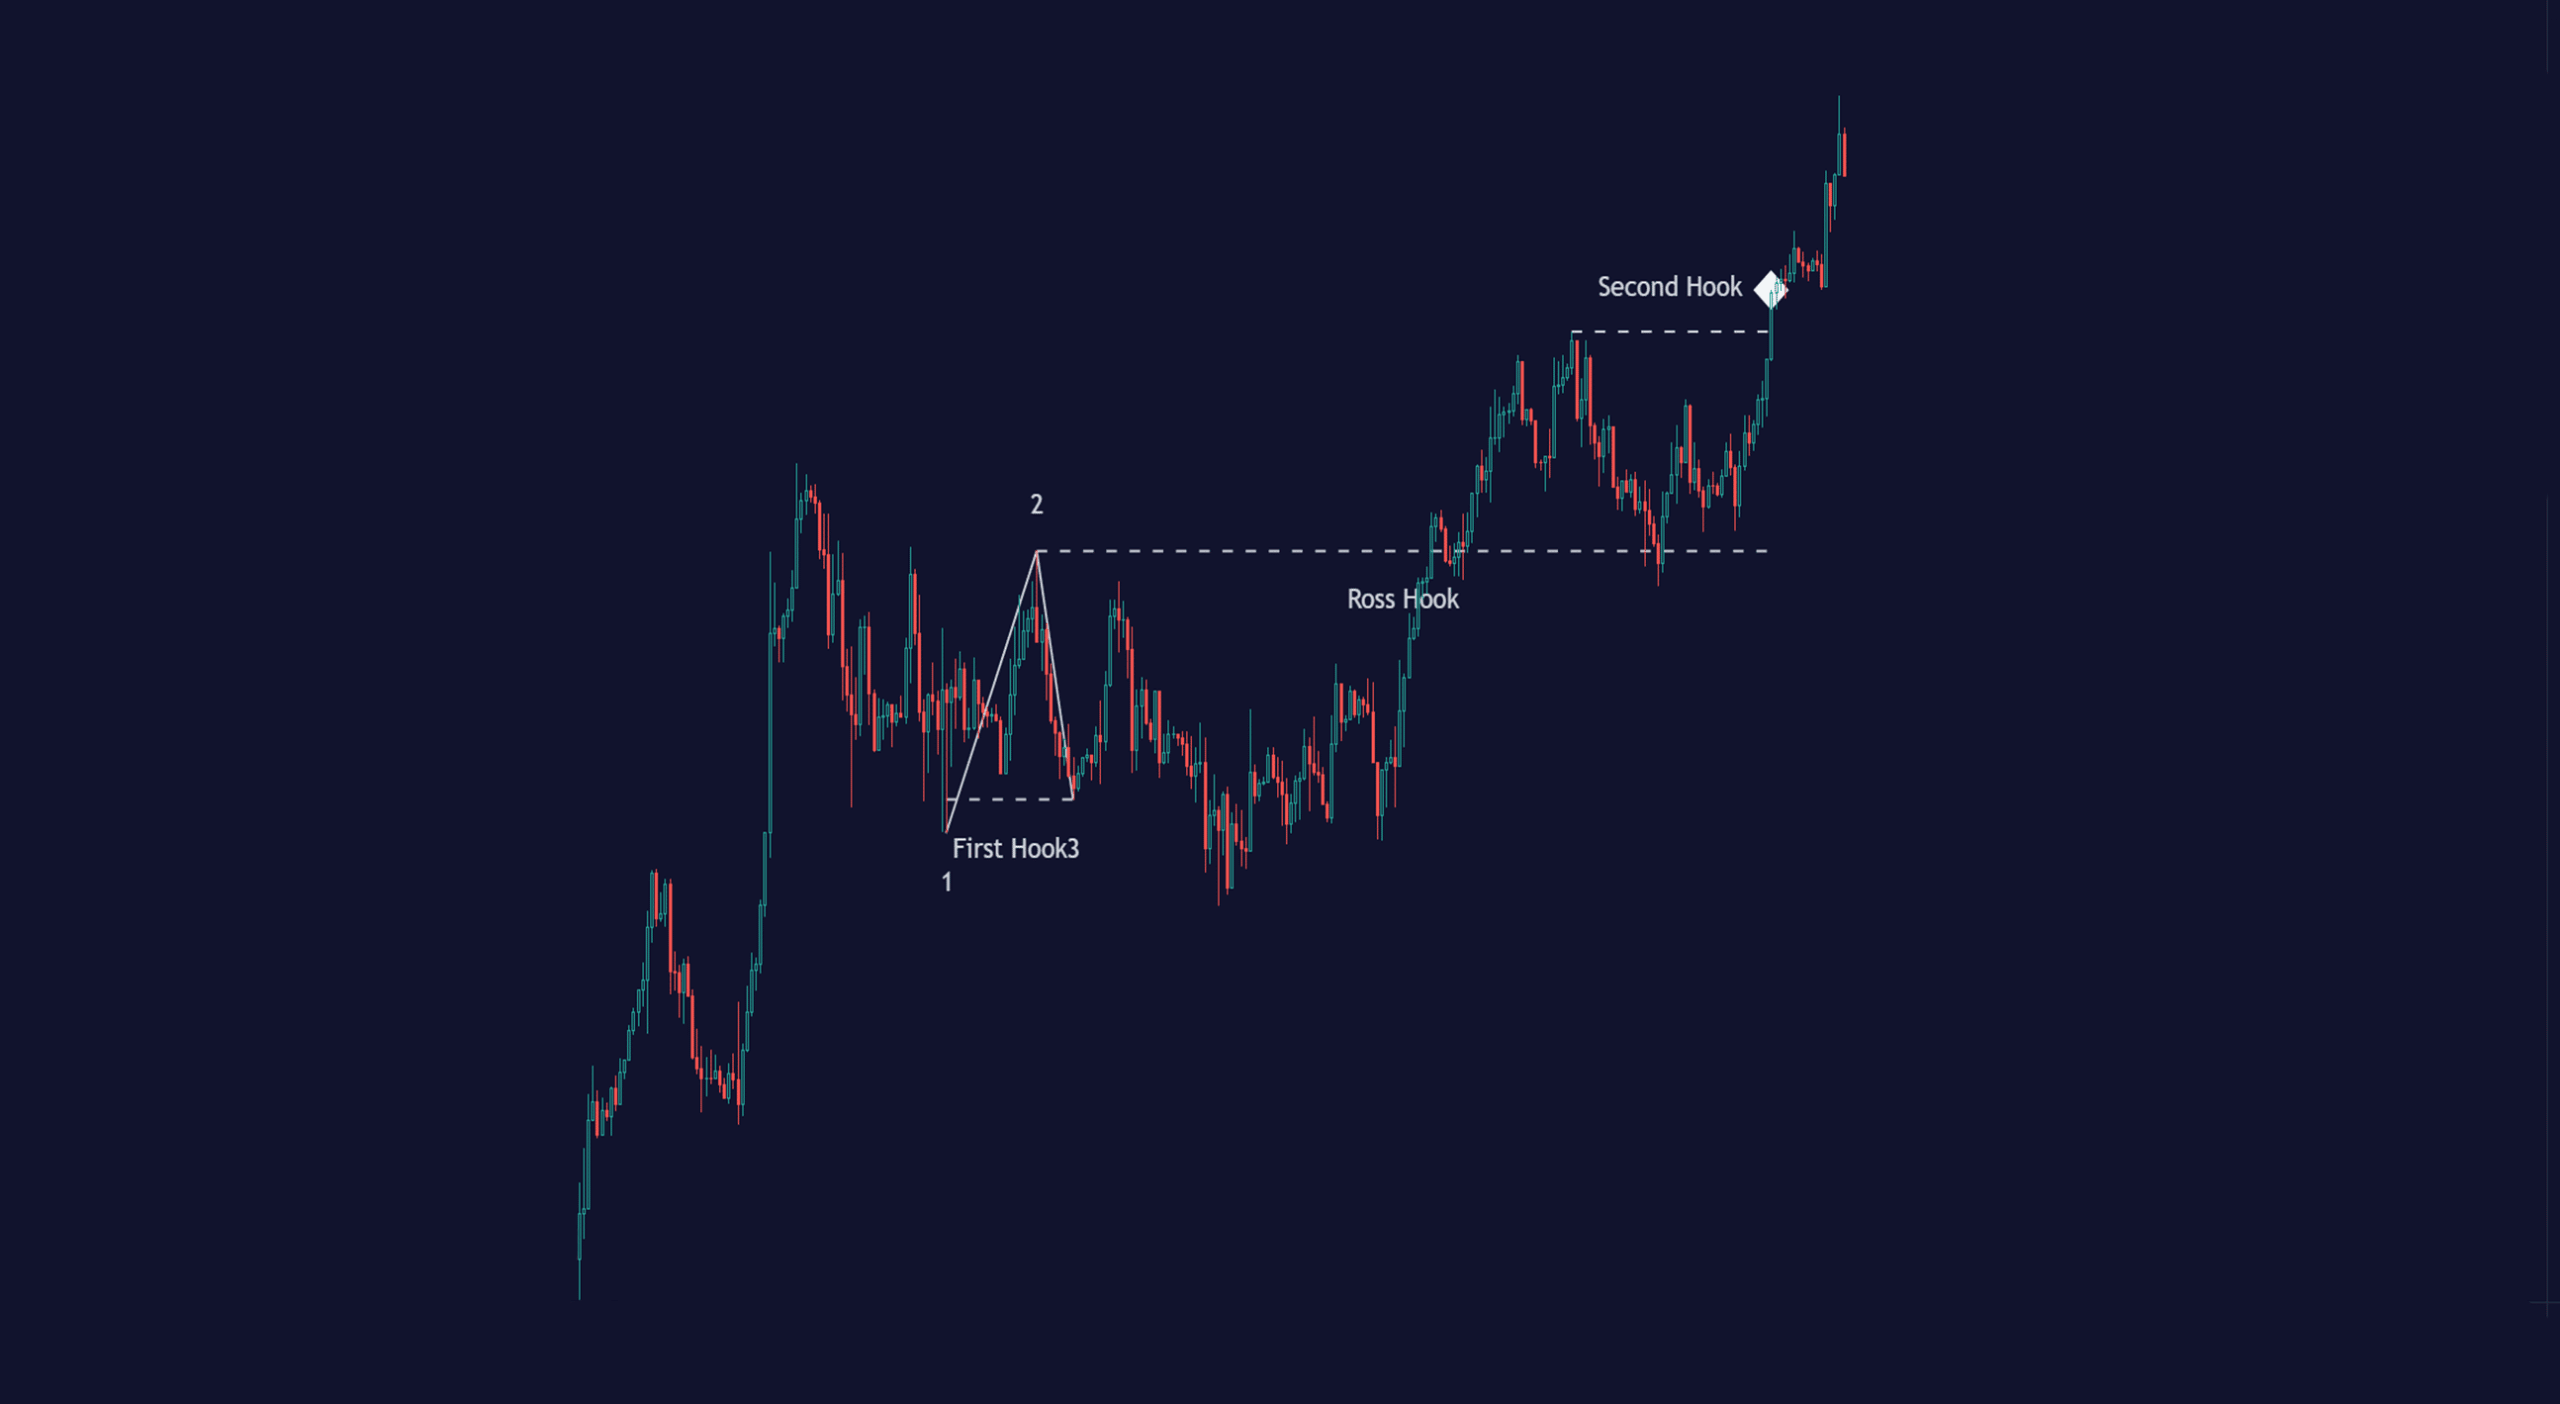
The Ross Hook pattern keeps repeating itself within the established bullish trend until a bearish 1-2-3 pattern is identified.
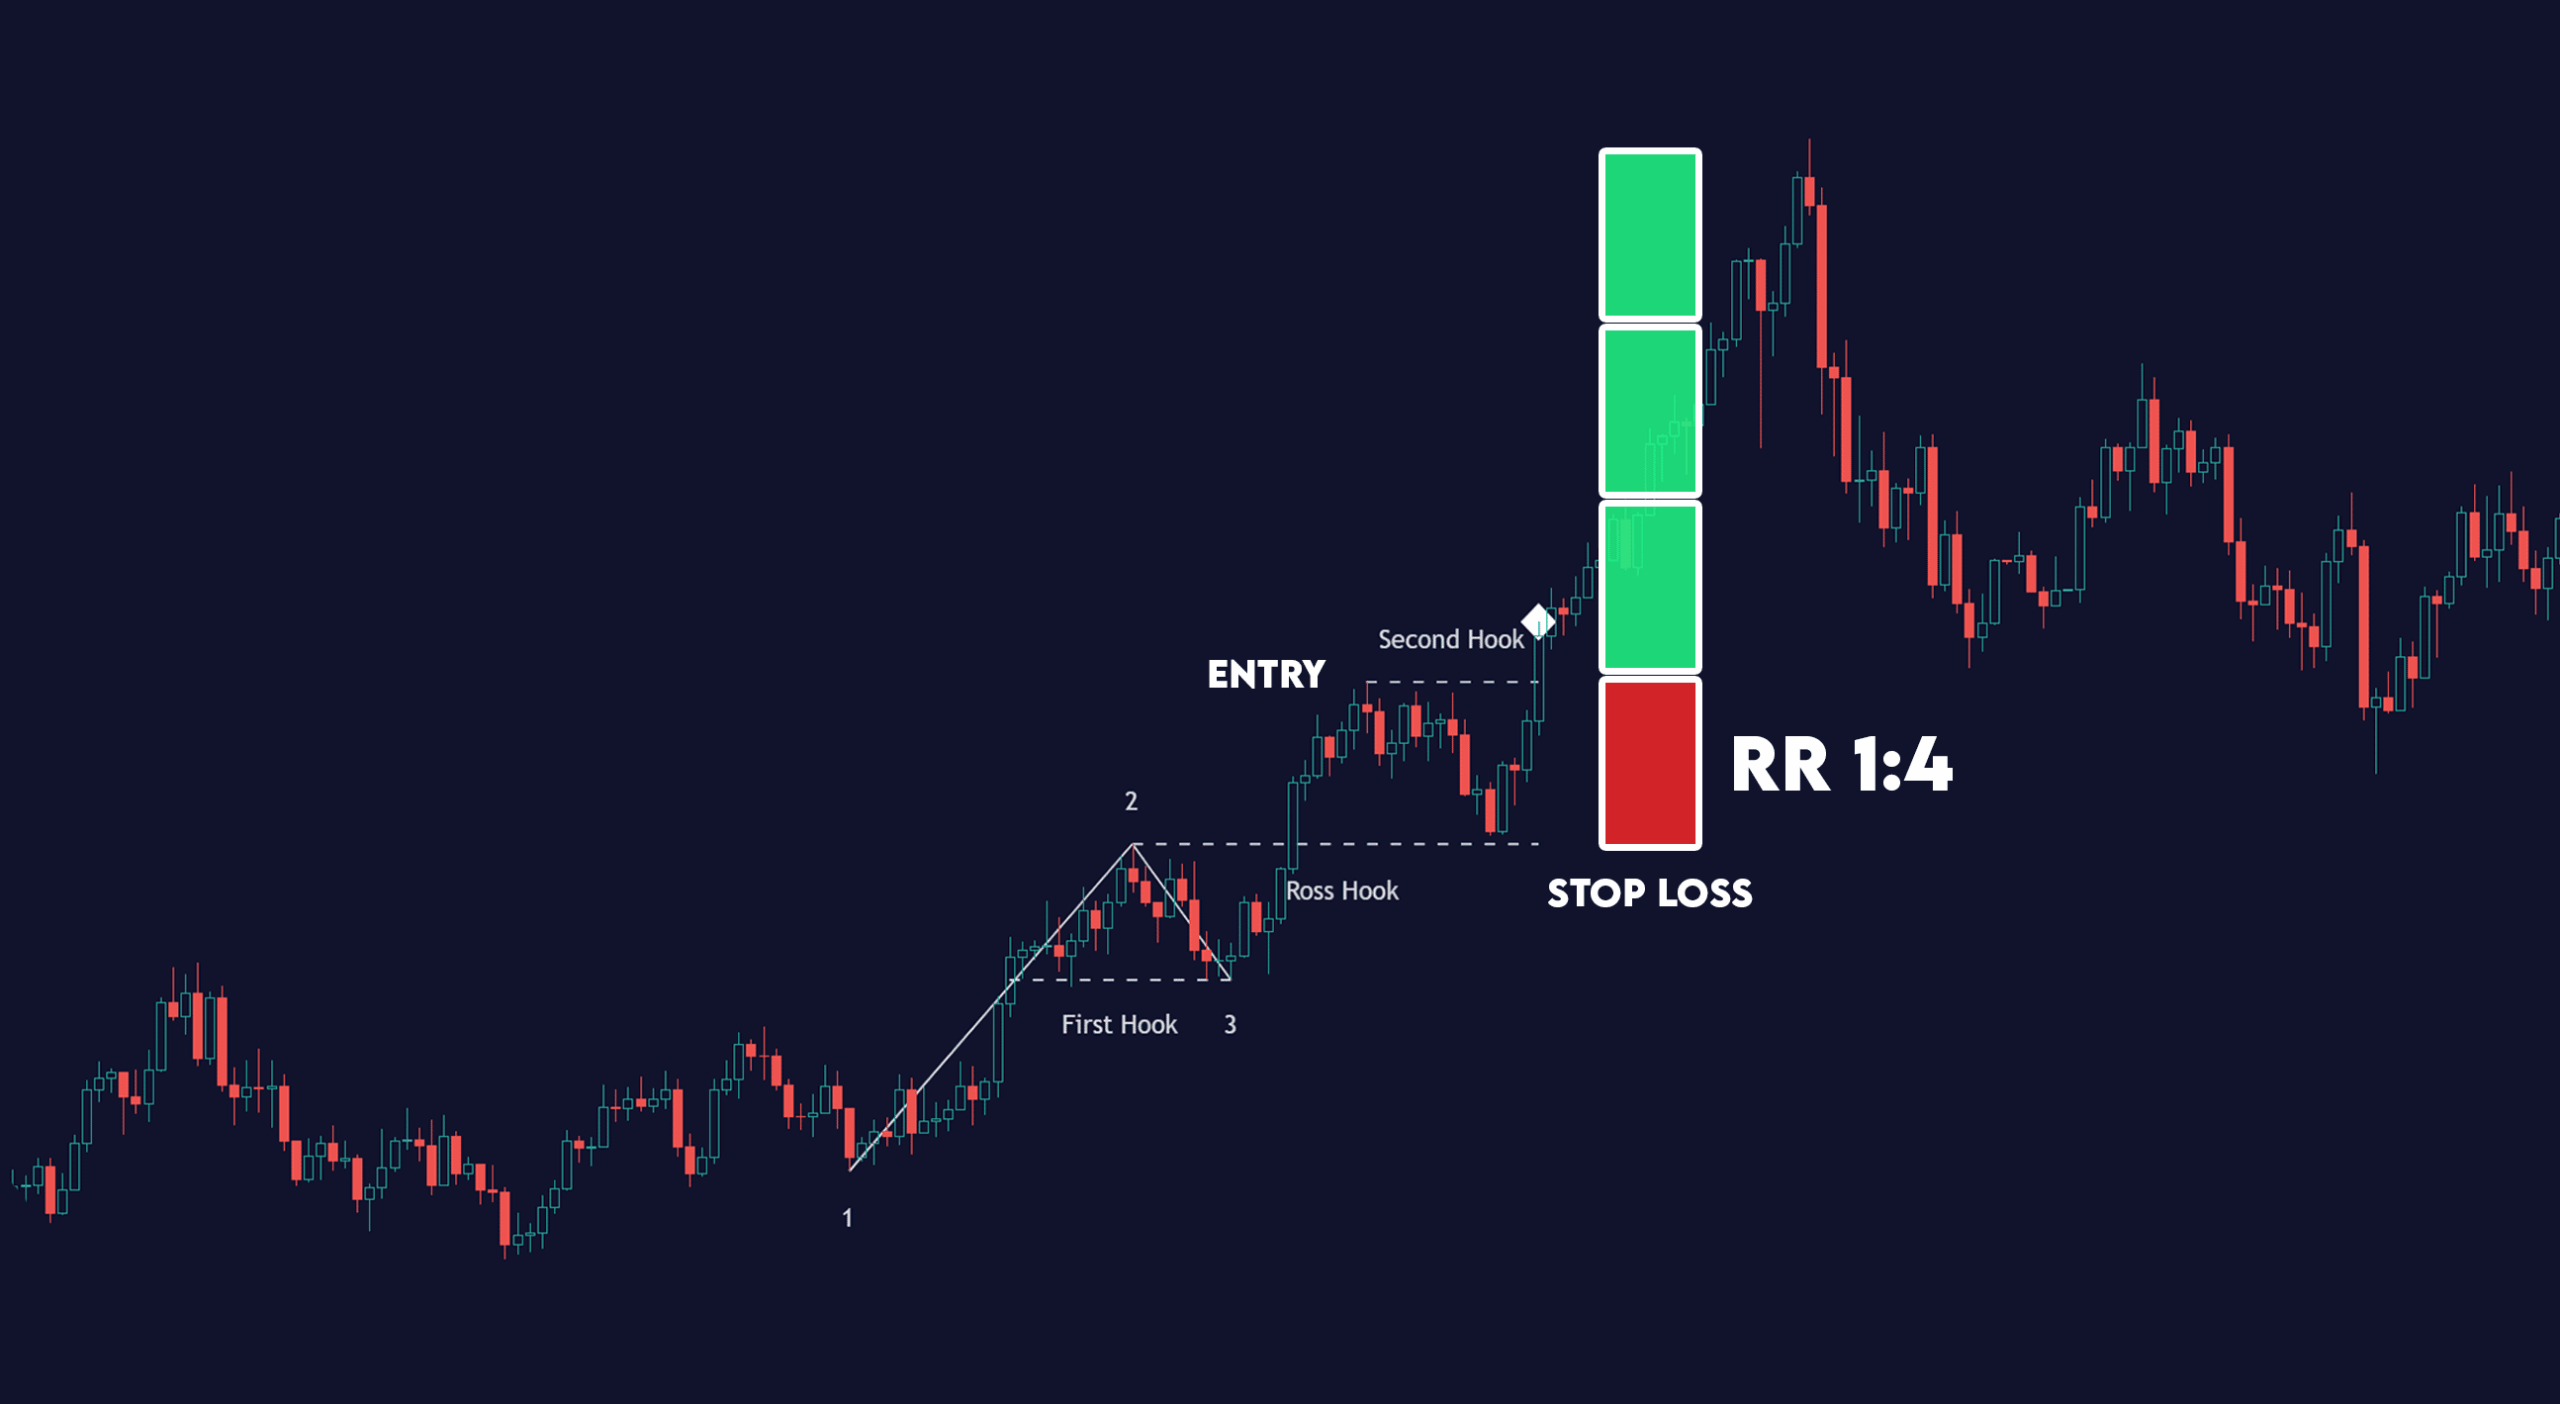
Taking a trade
For the Ross Hook pattern to work, the price must break either the most recent high or the most recent low of the price correction and create a Ross Hook. At each point, you get in when the price breaks the recent low (in a downtrend) or the current high (in an uptrend). In other words, the Ross Hook Setups is a trend continuation strategy. You can make your trading easier by setting up a pending order to buy or sell when the price creates the Ross Hook.
Stoploss placement
When you use this pattern to get into a trade, there are many ways to set your stop loss. The most common way is to put your stop loss slightly above/below the recent Ross Hook. You can use a trailing stop as well to ride the trend out. If you want to use a stop loss based on data insights, we recommend you use our Curved Stop Loss, which analyses the market momentum and set’s the best stop loss for you.
Taking profits and Exit the trade
The risk-reward ratio is the most common way to set the take profit or exit point. Have a risk reward of at least 1:1.5-1:2. Use our Trade & Risk Management Tool to set a target based on risk-reward automatically.
A traditional way of securing profit is around previous support and resistance or using a trailing stop. We at Zeiierman Trading have developed many innovative and handy take-profit indicators that help you secure profit at the best times.
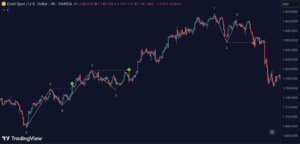
Ross Hook Pattern (Expo) Indicator
How to use the Ross Hook Pattern (Expo) Indicator
The indicator helps the traders identify the Ross Hook Pattern fully automatically. As a result, you save tons of valuable time using our Free Ross Hook indicator. With the inbuilt alert feature, the Ross Hook Pattern (Expo) Indicator analyzes the market for you and notifies you when the Ross Hook formations have been found.
Indicator Features
- Select the pivot period that identifies highs and lows. A low-value returns short-term price moves. A high value returns long-term price moves.
- Display HH/HL/LL/LH pivots points.
- The user can also set alerts and get notified when the pattern is confirmed.
Zeiierman
With over 16 years in the market, Zeiierman has extensive experience as a full-time trader and risk advisory consultant for hedge funds. He has developed many profitable trading strategies, drawing on his background in risk management and strategy execution.
More from Zeiierman