Let’s be real— we’ve all been there. You spot what looks like a breakout. Momentum’s building, the candles are stretching, and you jump in… only to watch the price snap back like a rubber band and wipe out your wallet. You’re not alone.
Markets thrive on tricking traders; the 2B reversal pattern is your cheat code to spot these traps. It’s a tool smart traders use to catch false breakouts before they burn their capital. Mastering the 2B reversal in the Forex and cryptocurrency markets could be an essential skill in your arsenal. It teaches you how to spot patterns, avoid common mistakes, and efficiently trade the 2B pattern.
1. What Is the 2B Reversal Pattern — And Why Should You Care?
Try Our 2B Reversal Indicator on TradingView for FREEAssuming you haven’t read the first guide, 2B Reversal Pattern Trading Strategy Explained for Beginners, let’s do a quick review. Otherwise, you can head ahead to the next section.
Here’s how it works:
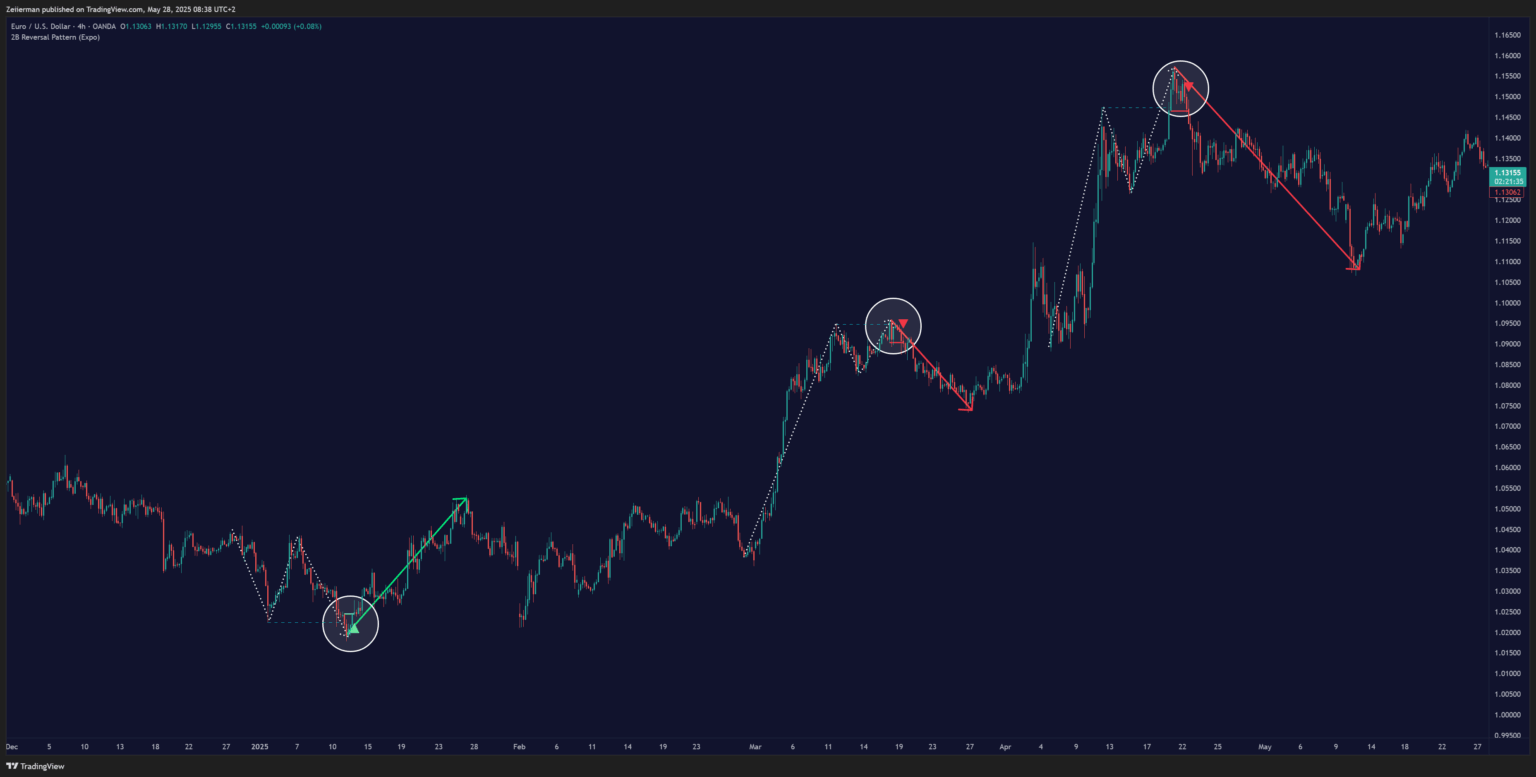
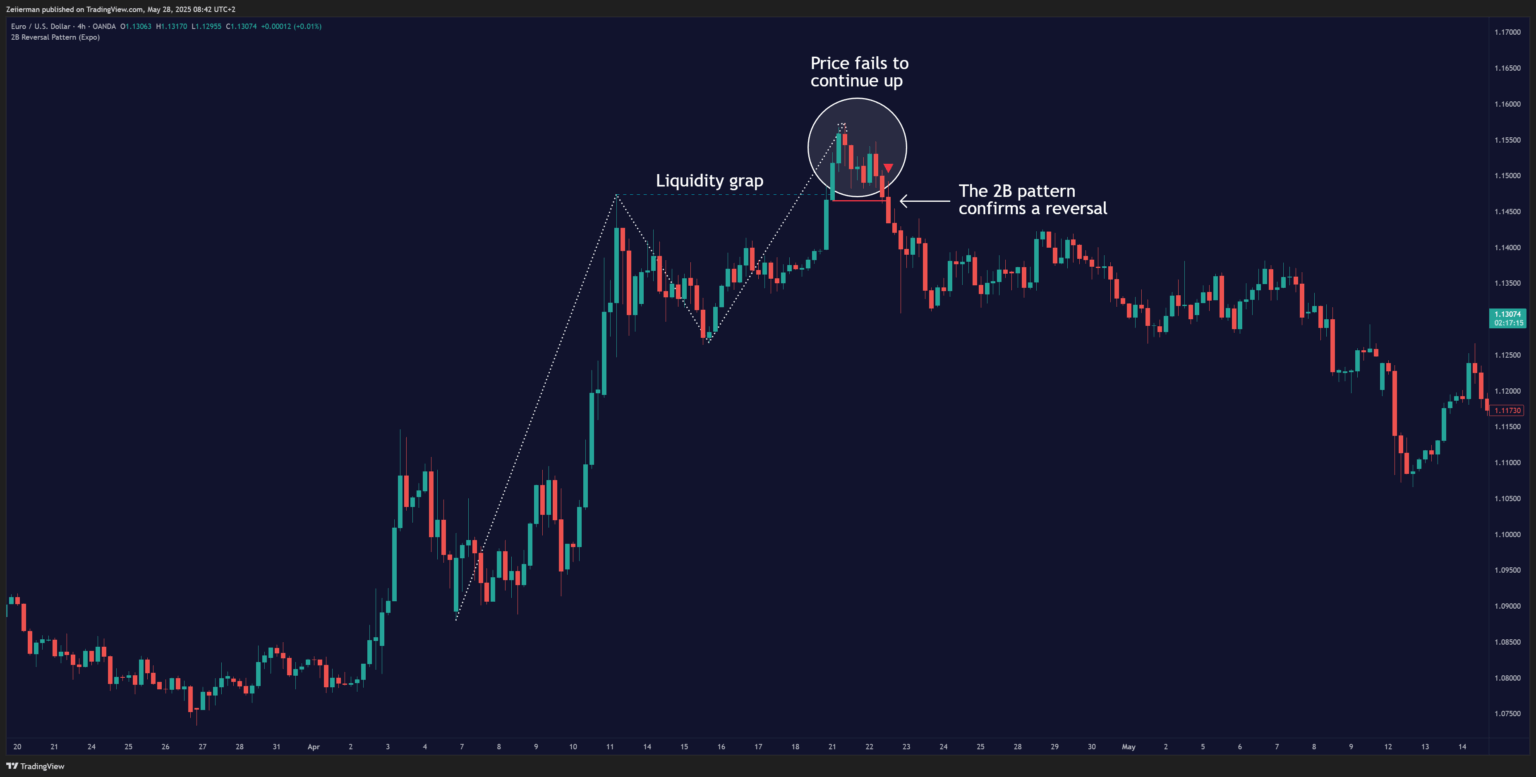
- In a 2B Top, the price breaks above a previous high but fails to stay above it and quickly drops below the breakout level.
- In a 2B Bottom, the price dips below a prior low, fakes lower trend out, then reverses to move higher.
The 2B pattern plays on the psychology of trapped traders — those who buy the breakout or panic and sell the breakdown.
Let me explain with an example – let’s say the EUR/USD hit a high of 1.1200 last month. Now it’s approaching that level again and nudges up to 1.1210. Everyone’s thinking it’s breaking out. But instead, it starts falling. That’s your 2B pattern—and potentially your opportunity.
Read: 2B Reversal Pattern Trading Strategy Explained: How to Enter, Exit and ProfitWe saw so many of these false breakouts during the “work-from-home” era and that’s when many Zeiierman community members made a lot of money as well.
Let’s break it down with a bullish 2B reversal (bottom):
- Price makes a new swing low, pushing below a previous support level.
- It quickly reverses and re-enters the prior range.
- The second low fails to get follow-through — that’s your trigger to watch.
- Confirmation comes when the price closes above the swing low or breaks a short-term resistance.
In short, it is a fakeout, followed by a shakeout, then a breakout in the other direction. Now let’s get to the important part, how you can strategize with the 2B pattern in the forex and crypto markets.
2. Adapting the 2B Strategy for Forex Markets
Forex markets like structure, which certainly works in your favor when using the 2B pattern indicator. Always remember timing is key.
Here’s how I select timeframes in the forex market for the 2B reversal pattern strategy:
- 15-minute charts: Great for day traders, but you might come across noise and false signals.
- 1-hour charts: A sweet spot for most traders is the EUR/USD and GBP/USD pairs.
- 4-hour charts: Ideal for catching major reversals with staying power.
- Daily charts: For position traders looking for 100+ pip moves.
Some of the traders in our community exclusively trade the 4-hour GBP/JPY 2B setups. Honestly? I think they’re onto something.
A. Considering Liquidity in Forex
The 2B pattern usually thrives on liquidity traps. You gotta choose your hunting ground carefully. If it were me, I would focus on session overlaps. The London-New York overlap is one of the windows where 2B patterns are frequent. Additionally, avoid low liquidity zones like the Asian session. You might not find a reliable 2B pattern there. And if you’re going to swim, dive towards the institutional money flow.
📌 Monitor major pairs like EUR/USD, GBP/USD, and USD/JPY to find cleaner 2B patterns.
B. Forex Entry Strategy for 2B Reversal Pattern
Entry matters enormously in any market, be it forex or cryptocurrency. You can achieve precision by combining multiple indicators like SuperBollingerTrend and Stochastic MACD – Signal with the 2B reversal pattern.
There are three primary considerations when entering based on the 2B strategy,
- The Pullback Entry: Wait for the price to reverse below the previous high (in a 2B top) and pull back to test it as resistance. This gives you a much better risk-reward ratio.
- The Break of Structure Entry: You can enter when the price breaks the most recent swing low (for tops) or high (for bottoms) after the failed breakout.
- Volume Check: Use the Cumulative Delta to confirm the flow of smart money. If the price reverses without volume, it’s likely noise.
C. Forex Exit Strategy for 2B Reversal Pattern
You will quickly understand that the market noise may disturb the trajectory, so with consideration, place stops 15-25 pips beyond the extreme point of the pattern.
To trade for the maximum profit, sell half your position when the price moves in your direction by the same margin as your risk. Bring your stop loss to the entry price to avoid losing money on the other half of your position. Leave the other half running to take bigger moves aimed at twice your initial risk or three times your initial risk.
3. Adapting the 2B Strategy for Crypto Markets
Volatility is why most traders end up wrecked in the cryptocurrency market. Trading with the 2B reversal pattern here is certainly more challenging than Forex. However, using a strong and battle-tested approach can make greater profits.
A. Opportunities for Exchange Arbitrage
A unique aspect of crypto 2B reversal patterns is the opportunity for exchange arbitrage. Look for 2B patterns that form on one major exchange but not others – this divergence often precedes major moves.
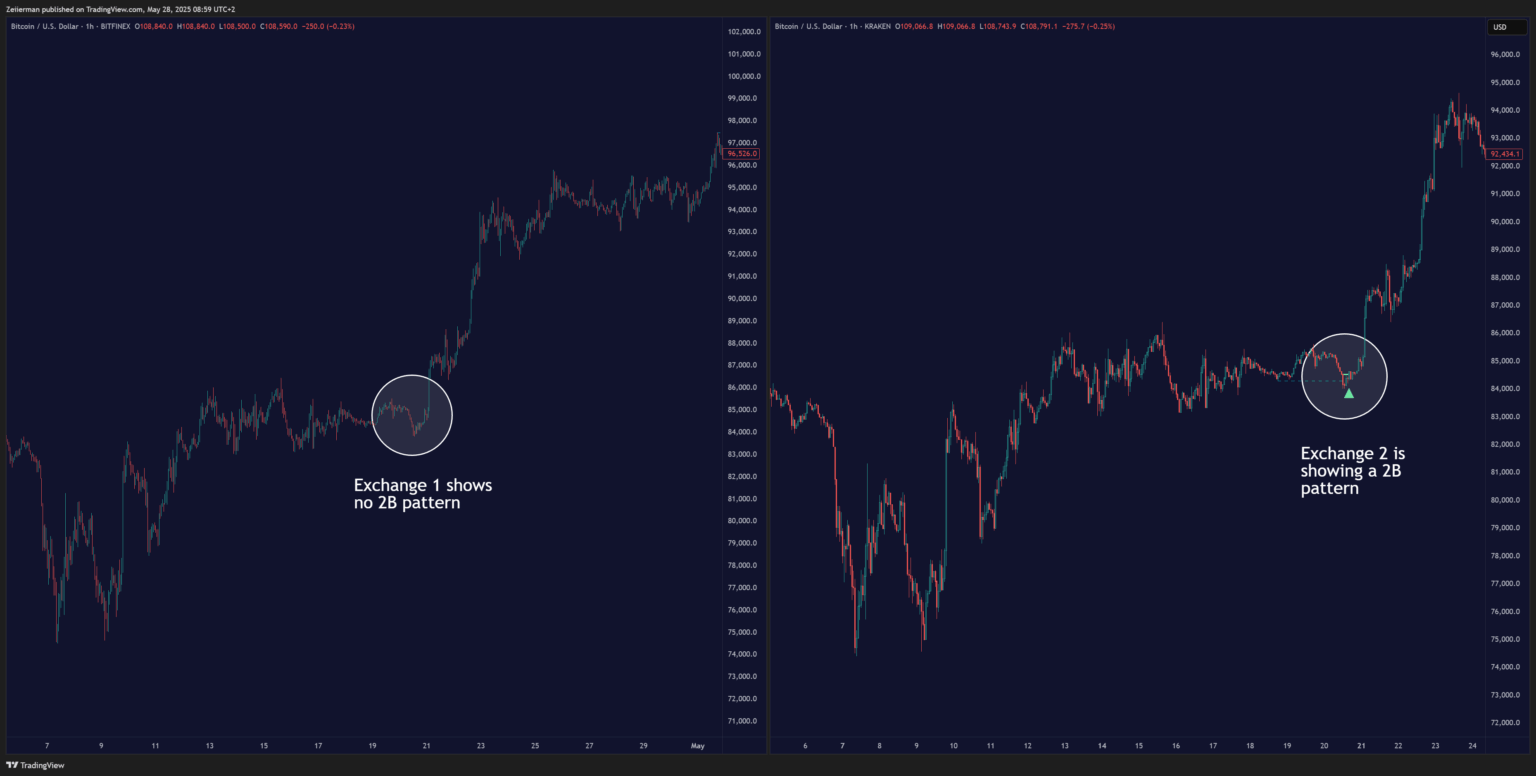
To track divergence, open charts on 2-3 big exchanges such as Binance, Coinbase, Kraken, or Bitget. Check for pattern mismatch, rejection timing, and volume comparison. Higher-volume exchanges usually dictate price action, showing a possible pattern mismatch. This is where you strengthen your setup.
B. Adapting for Volatility
Focus on established assets like BTC, ETH, and LTC. You can’t find a reliable pattern among memecoin(s) as they are highly manipulated. I always recommend using a larger timeframe for pattern confirmation. 15 minutes for entries, 4 hours, and 8 hours for context. Use percentage-based stops instead of fixed amounts; I use 3-5% stop losses for BTC and ETH and 7-10% for altcoins.
Never take up on a crypto 2B reversal trade without seeing higher-than-normal volume on the reversal candle. Specifically, look for a volume at least 40% higher than the average of the previous few candles. For altcoin 2B patterns, confirm that Bitcoin isn’t making strong moves that would override your setup – this is where most traders “miss” the actual action by not accounting for Bitcoin’s movements.
📌 Do not overleverage. Crypto’s 50x leverage can turn a 2% drop into a 100% loss. Instead, make sure your risk is ≤1% per trade. It may be boring but it will be profitable.
C. Executing 2B Reversal Traders in Crypto
Wait for 2-3 candles to close beyond the fake high/low for confirmation. We use pullback or break-of-structure entries after confirmation. The safest way is to wait for the rejection candle to close. More experienced traders can enter mid-candle for a better price, but it (obviously) carries more risk. Always confirm with moving averages to avoid false signals.
The next important factor is volume spike – waiting for that confirmation is non-negotiable. Use liquidation heatmaps like CoinGlass to spot whale traps. Look for red clusters (short liquidations) above the price and green clusters (long liquidations) below the price.
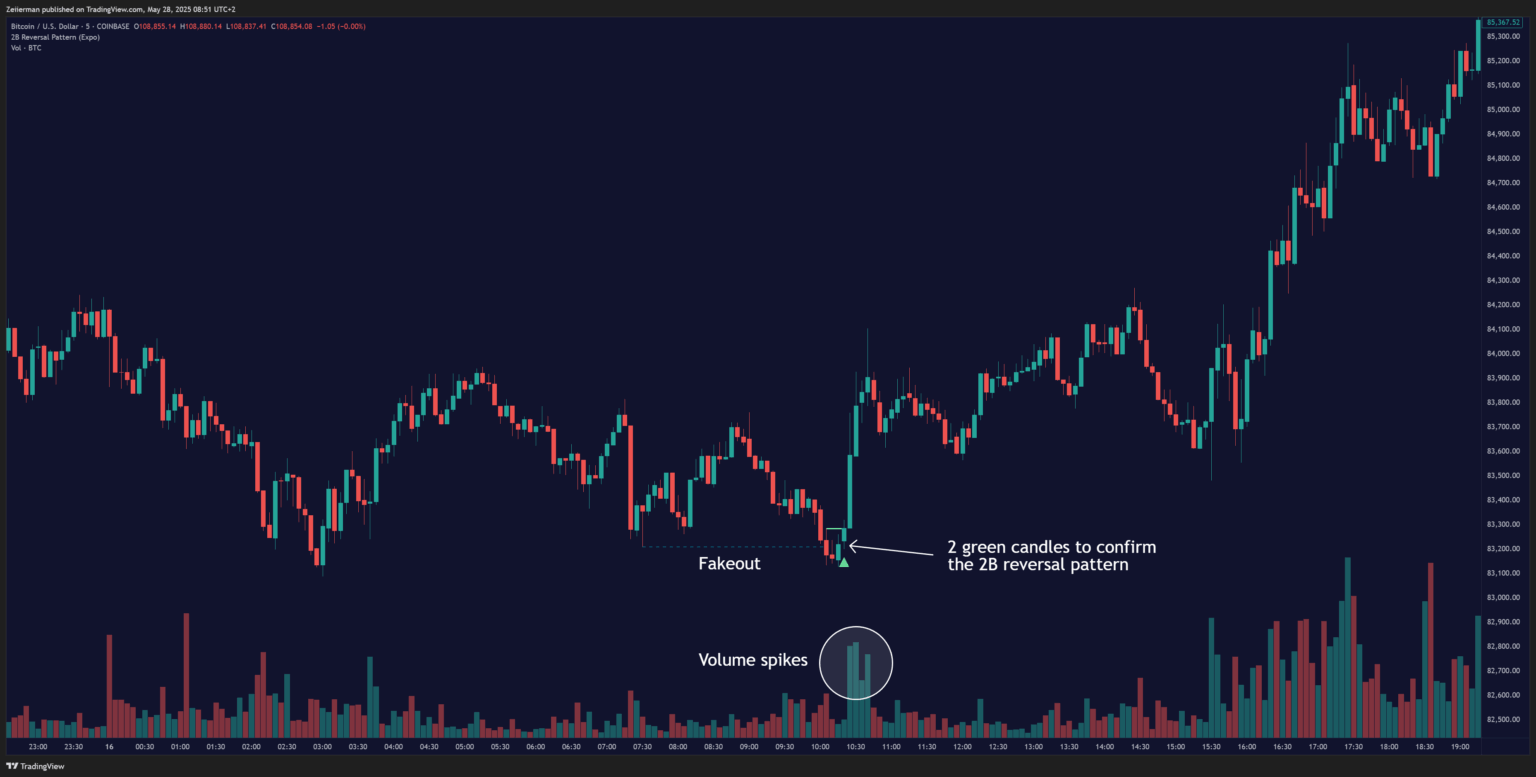
📌 In my experience, a 2B reversal often coincides with a volume surge in the reversal candle and liquidation cascade hitting those clusters.
Monitor the funding rate on major exchanges. It is a reliable sign to spot overcrowded trades. To get an edge over the crowd, remember this:
Long squeeze setup: Funding rate > 0.1% → look for 2B tops.
Short squeeze setup: Funding rate < -0.1% → hunt for 2B bottoms
With enough experience, trades, and practice, you can spot these setups around resistance re-tests, range extremes, or after parabolic moves.
4. How to create 2B reversal alerts on TradingView?
- Identify Your Key Level: Find that obvious high or low that stands out on your chart. This is your reference point. You can use the Range Bands in conjunction with the 2B Reversal Pattern indicator for accuracy.
- Set Your Approach Alert: Create an alert that triggers when the price comes within 0.5-1% of your reference level. This gives you the heads-up that a potential 2B might form.
- Configure Your Breakout Alert: When price exceeds that previous high/low by a small amount (I use 0.3% for forex, 1-2% for crypto), you want another notification. This is your “pay attention now” moment.
- The Money Maker – Reversal Alert: This is where the rubber meets the road. Program an alert that triggers when the price reverses by a specific amount after making that new high/low. For forex, I use a 15-20 pip reversal threshold; for crypto, about 2-3%.
Additionally, you can try pairing the 2B pattern with powerful indicators like Bellcurves, Dynamic Volume Clusters and Reversal Bands & Zones.
5. Forex vs Crypto: Does the pattern work the same way?
| Forex | Cryptocurrency |
| Low volatility, patterns are generally cleaner and slower. | You’re dealing with higher volatility, especially on altcoins and memecoins. |
| More reliable on higher timeframes due to institutional movement. | The 2B pattern often forms faster and more violently, so you’ll want tighter stops and quicker reactions. |
| Macroeconomics and News-driven (NFP, CPI) | Hype-driven (memecoins, influencers) |
| Trade during the London/New York sessions (liquidity peaks). Keep an eye out for “trap doors” from the central bank, such as Fed comments that cause phoney breakouts. | Focus on major exchange rates (Binance’s BTC vs. Coinbase’s). News triggers? Coinbase listings, SEC judgments, and celebrity tweets. |
📌 Much like its traders, crypto loves chaos. Forex, on the contrary, respects structure. Adjust your expectations and risk management accordingly.
Read: How to scalp forex like a pro?Here are some pro tips that I have had to learn the hard way:
Don’t rely on the 2B alone — combine it with other signals like support zones or fib retracements. Additionally, an alert is just a heads-up, not a green light. Once triggered, pull up the chart and ask yourself the following questions: Has price reversed and re-entered the range? Is there a strong rejection candle? Any confirmation from volume or divergence?
If the answer’s yes, you may have a solid 2B setup brewing. 😉
Zeiierman
With over 16 years in the market, Zeiierman has extensive experience as a full-time trader and risk advisory consultant for hedge funds. He has developed many profitable trading strategies, drawing on his background in risk management and strategy execution.
More from Zeiierman