In every trader’s life, there comes a moment when you feel the lightning has been successfully caught in the bottle. The stop loss is placed in what appears to be a safe zone. What could possibly go wrong? Well, the price did go in the direction you predicted, but not before tapping your stop loss.
An incident like this always leaves me wondering if it was just bad luck or if I got caught in a stop hunt. Or maybe something deeper, like a liquidity sweep.
What’s the solution? We start from the fundamentals. What exactly is a stop hunt?
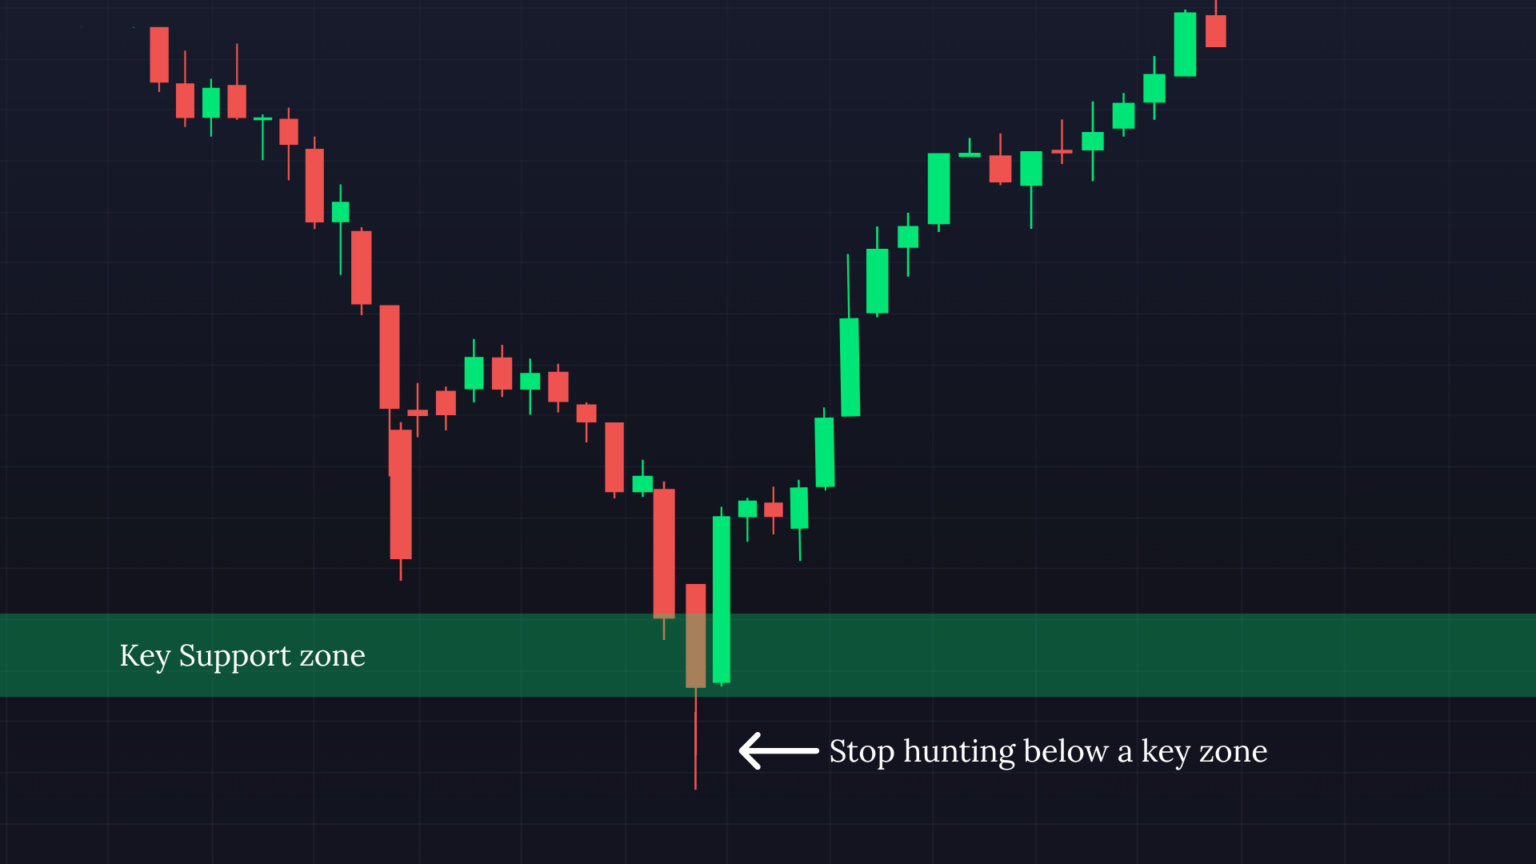
A stop hunt is a price move designed to trigger stop-loss orders of retail traders before reversing in the opposite direction. If you’ve been around for some time, you know it’s one of the oldest tricks in the playbook of institutional traders, hedge funds, and market makers.
When retail traders take a trade, they often identify a clear support or resistance level and place their stop-loss just beyond it. For example, if a stock is bouncing off $100, a long trader might place their stop loss at $99.50. A stop hunt here is a quick, often aggressive move by price that shortly pushes below $99.50, triggering all those stop losses, only to then reverse sharply and move higher.
There’s also what we call a ‘liquidity grab.’ A liquidity grab is the broader act of tapping resting orders (stops/limits) to access liquidity. Both stop hunts and sweeps are forms of liquidity grabs, but they aren’t the same.
And that brings us back to the topic of this conversation: liquidity sweeps. If you didn’t know, this is a third installment in this series with the others being Liquidity Sweeps in Trading, and Liquidity Sweeps in Cryptocurrency.
If you don’t want to read all that, let me start with a quick summary.
What are liquidity sweeps?
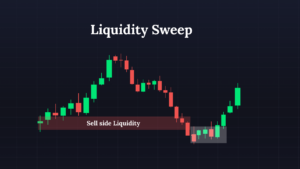
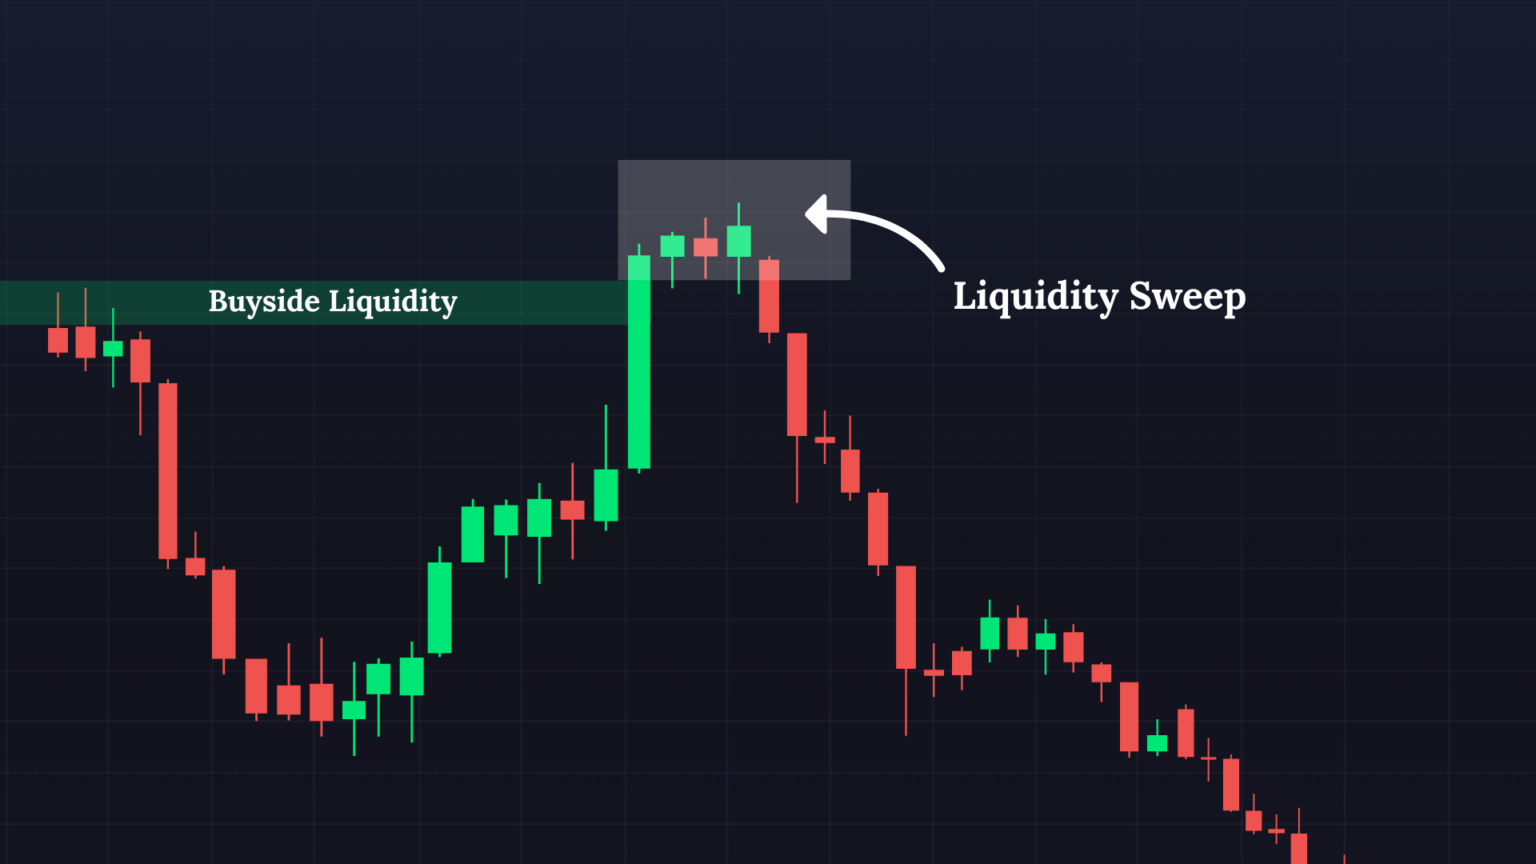
A liquidity sweep is an intentional run on resting liquidity (buy-side or sell-side) to facilitate large fills with minimal slippage, typically followed by displacement and a market-structure shift in the direction of the smart-money intent.
Its goal is to efficiently gather the liquidity needed by big players to execute large orders without moving the market against them. Institutions deal with order sizes ranging from millions of shares to millions of contracts. Executing these large orders all at once can drastically affect the price (due to slippage and other factors). To avoid this, they need liquidity, which is basically a pool of willing buyers or sellers at specific price points.
Imagine a hedge fund wants to sell a massive number of shares. Instead of just dumping them on the market and crashing the price, they often look for areas with many pending buy orders (buy-side liquidity). They push the price up slightly, triggering stop-loss orders for short sellers (which turn into buy orders) and attracting new buyers to build a pool of liquidity they can then sell into. Once they have collected enough sellers, the large order can now be released, often leading to a more sustained move in the intended direction.
Key Differences Between Stop Hunts and Liquidity Sweeps
| Aspect | Stop Hunt | Liquidity Sweep |
|---|---|---|
| Primary goal | Trigger crowded retail stops for a quick liquidity tap | Collect sufficient buy/sell liquidity to fill large institutional orders |
| Signature price action | Sharp wick beyond an obvious level, quick snap-back | Run of buy-side/sell-side liquidity, then displacement away |
| Timeframe tendency | Most visible on LTF (1–15m), short-lived | Clearer on HTF (1h/4h/D), leaves structure footprint |
| Context (SMC) | Isolated trap; not a structure event by itself | Often tied to BOS/CHoCH, FVG tap, or OB interaction |
| Likely outcome | Fast reversal back into prior range | Follow-through in smart-money direction (continuation or a new trend leg) |
| Volume character | Spike then fade (exhaustion) | Sustained/decisive volume during and after the sweep |
| Trader risk | Chasing fake breakouts; tight, obvious stops | Fading displacement; stops too close to swept level |
A. Timeframe Reliability
One of the most reliable ways to separate stop hunts from liquidity sweeps is by simply zooming out. The timeframe tells you a lot about smart money’s intent. Stop hunts are usually short-term tricks by big players. You’ll see them most often on lower timeframes, such as the 5-minute or 15-minute chart.
In my experience, they are often the sharp wicks that last for only a few candles, or even a single candlestick, before the price shoots back the other way. Liquidity sweeps, in comparison, can occur on lower timeframes but are more reliable when seen on higher timeframes (1-hour, 4-hour, daily charts).
This is because the execution of large institutional orders leaves a stronger mark on longer timeframes, leading to more decisive moves that clear out significant liquidity zones. You’ll notice the market running a high or low, collecting liquidity, and then resuming the major trend.
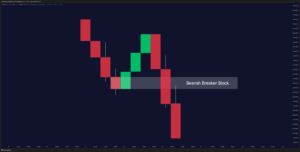
Read: Breaker Blocks in Trading: How to Identify, Confirm, and Trade Them Like a ProB. Context in Smart Money Concepts (SMC)
The context makes the difference between stop hunts and liquidity sweeps clearer. Stop hunts (often) occur at very obvious, low-hanging fruit liquidity points, like:
- previous session highs or lows,
- psychological round numbers,
- or single swing highs/lows.
It’s the market punishing predictable retail behavior, but it doesn’t really define the bigger direction. If you’re stuck trading only the noise, you’ll keep getting beaten up. In the smart money concept, liquidity sweeps are among the main components. It often provides context for the overall market direction, as it is part of a larger market structure shift, a move back to a fair value gap (FVG), or an order block (OB).
For example, after sweeping the lows of a consolidation, a liquidity sweep might occur before the market reverses and moves toward a higher-order block. The sweep provides both the liquidity and the momentum needed to break through significant structural levels.
C. Outcomes after the Stop Hunt and Liquidity Sweeps
After a stop hunt, the price mostly reverses quickly, often moving back into the range it came from, or continuing in the direction it was heading before the hunt. This leaves traders who chased the breakout (or were stopped out) on the wrong side of the market.
On the other hand, after a true liquidity sweep by institutions, the market often continues in the direction that aligns with the institutions’ order flow. If institutions sweep sell-side liquidity (absorbed sell orders and triggered long stops) at a key low, the market is likely to rally with conviction. If they swept buy-side liquidity (absorbed buy orders and triggered short stops) at a key high, the market is likely to fall.
In short, the sweep clears the path for the next major move.
How to Avoid Confusion in Real Trading?
1. Check the timeframe first and foremost.
This should be your starting point whenever you look for liquidity sweeps or stop hunts.
- On the 5-minute chart, a single wick below support could easily be a stop hunt. Lower timeframes are full of noise, and you’ll see plenty of fakeouts that reverse almost instantly.
- On the Daily chart, when price takes out a multi-week high and then holds above it, that’s a strong clue you’re watching a liquidity sweep in action.
2. Read the larger market context.
Price action never happens in isolation. Context tells you whether a move is more likely a sweep or a hunt. As a veteran of the game, I always advise traders to align themselves with smart money. Most traders use tools like the Smart Money Concepts indicator to identify key structural events in the market.
- If the market is already trending strongly and then pushes through a previous high, chances are it’s a liquidity sweep fueling continuation. A break of structure may be marked by the indicator after the sweep, which adds reliability to a continuation move.
- If the market has been chopping sideways for hours and suddenly spikes in both directions, that’s a stop hunt clearing out both sides of the range.
3. Use confirmation tools.
Zeiierman AI Analyzer: After uploading a chart, the Analyzer gives you a data-driven analysis of market structure. It can mark liquidity zones, momentum scores for breakout confirmation, volatility to avoid stop hunts, and other key market structures to give you an overall market overview.

ICT Market Structure Screener: This tool will help you identify key market structure levels and patterns using Smart Money Concepts. It marks bullish and bearish structures, premium and discount levels, and generates alerts for significant market changes, which is important during a liquidity sweep.
Volume as a Context Filter: Always monitor the volume patterns closely. Stop hunts show volume exhaustion, which is indicated by a spike in volume followed by an immediate decline. Liquidity sweeps maintain strong volume as institutions continue executing their large orders.
Both stop hunts and liquidity sweeps revolve around liquidity, but their intents differ. Stop hunts are short, sharp traps, while liquidity sweeps are strategic liquidity collection moves by institutions that often set up the next big move. Spotting the difference in real time is how most traders can successfully avoid the trap.
SM_Trader
SM_Trader is a highly experienced coder and strategy developer who brings the most complex algorithms to life. As a member of MENSA, the prestigious organization for individuals with intelligence scores in the top 2% of the world, he combines exceptional analytical skills with a keen eye for numbers and statistics, empowering businesses to grow at the right pace and in the right direction.
More from SM_Trader