Cryptocurrency is a liquidity-driven market. Compared to equity or even forex markets, where depth is more structured, the order book in crypto can be thin and fragmented. This creates an ideal ground for liquidity sweeps by big players, which are quick moves designed to grab stop losses and collect orders before the real trend resumes.
If you’re unfamiliar with what liquidity sweeps are, don’t worry – I have you covered. This is the second part of my Liquidity Sweeps (Identify, Confirm, and Execute) series. In the first article, I explained the concepts and shared trading techniques in great detail.
Regardless, here’s a quick refresher:
A liquidity sweep occurs when the price moves into areas with heavy order flow, often stop losses, breakout entries, or pending limit orders. The sweep clears those orders, provides liquidity to large players, and often reverses direction.
Imagine a crypto whale needs to buy 5 million USD of Bitcoin. They can’t just click “buy” at the market level without spiking the chart, because it would be a messy entry. Instead, they attempt to drive prices into areas where retail traders have put their sell stops. Those stops trigger, releasing a wave of liquidity that the whale can use to fill their buy orders at a better price.
Once again, if that confused you, read my previous article on liquidity sweeps before proceeding.
1. How to spot liquidity pools in crypto markets?
To find potential sweeps, you will need to determine where liquidity pools are most likely to sit on the chart. In crypto, they often get collected around the four most obvious technical levels:
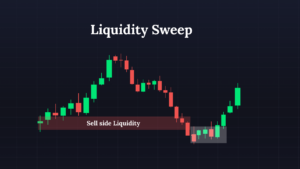
- Consolidation ranges: Sideways markets are ranges waiting to bounce when a whale moves. Traders who go long place stops below the range, and short traders place them above. When price finally spikes, it almost always takes one side’s liquidity to turn it around. This is why ranges are one of the main playgrounds for sweeps.
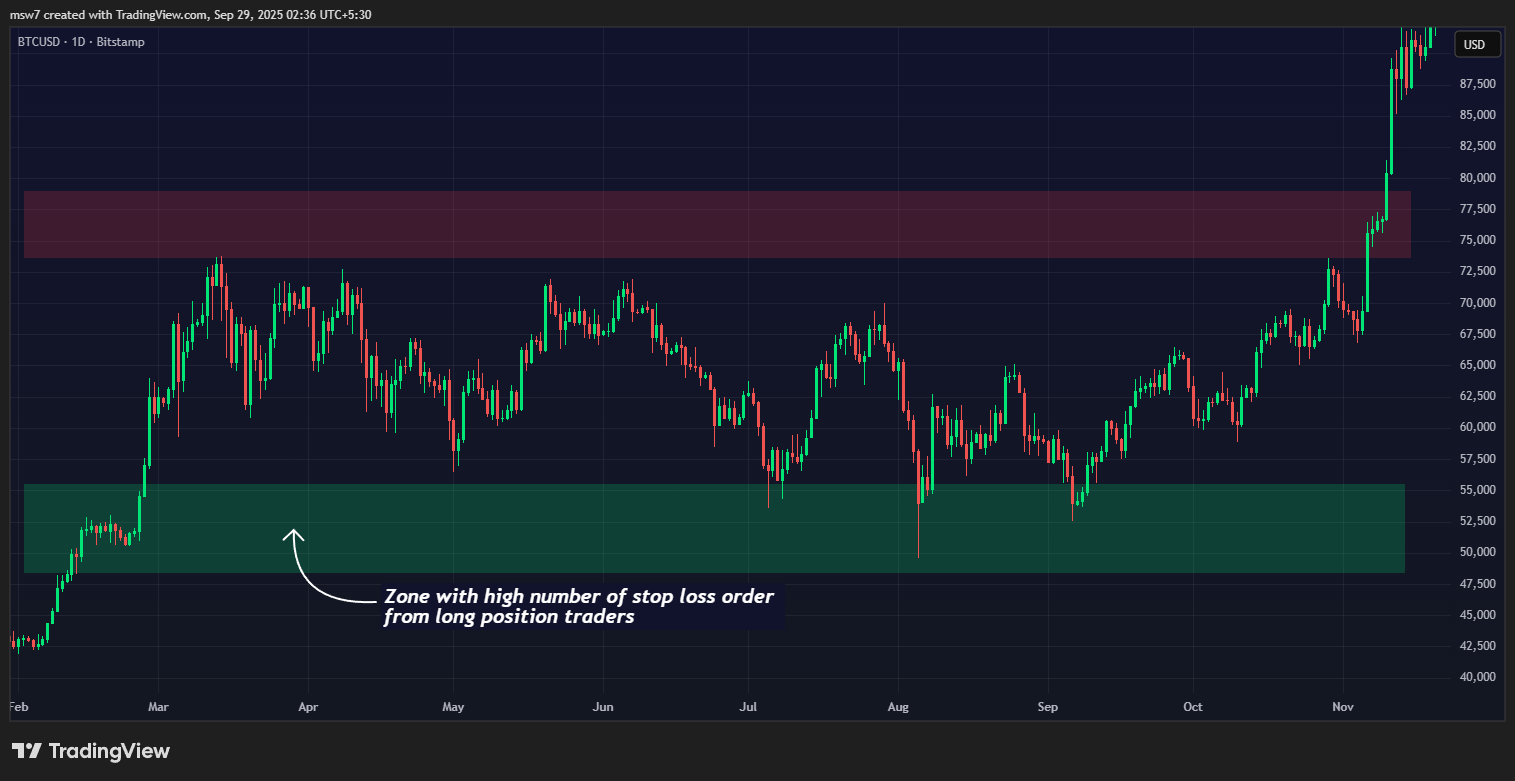
- Swing highs and lows: When Bitcoin breaks a new daily high, say $120,200, where do you think all the short sellers place their stops? Right above that high, probably around $120,300-$120,400. The market makers (whales) know this psychology better than retail traders know themselves in crypto.
📌 Trader’s Tip: In my experience, most violent sweeps often occur at swing points that have been tested multiple times. Each test adds more traders to the stop loss hunt above or below that level.
- Round numbers: Everyone loves a clean, round number. It’s not just Bitcoin hovering around $100,000 and $120,000; you can also look at altcoins. Solana is around $200, and Ethereum is near $4000. You will see a lot of bounce or ranges around these ranges in higher time frames. Round levels attract stops and breakout orders because they “feel” psychologically important. Big players know this and often push the price just beyond these numbers to harvest liquidity.
- Recent breakout levels: After a breakout, many breakout traders trail their stops just below the breakout line. That area often becomes a liquidity pool waiting to be tapped.
2. How to confirm liquidity sweeps in crypto markets?
Repeat after me, folks: not every sweep is tradeworthy. Sometimes, price pushes through a level…
…and just keeps going, turning what looked like a sweep into the beginning of a breakout trend. That’s why confirmation is your safety net.
Read: The Best Crypto Strategies for TradingView (Step-by-Step Guide)Step 1: Confirm with candlestick signals.
After a sweep, we are looking for signs that the asset price rejected the liquidity grab instead of accepting it as part of a breakout. Here are my most trusted checks:
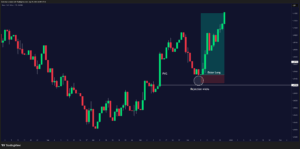
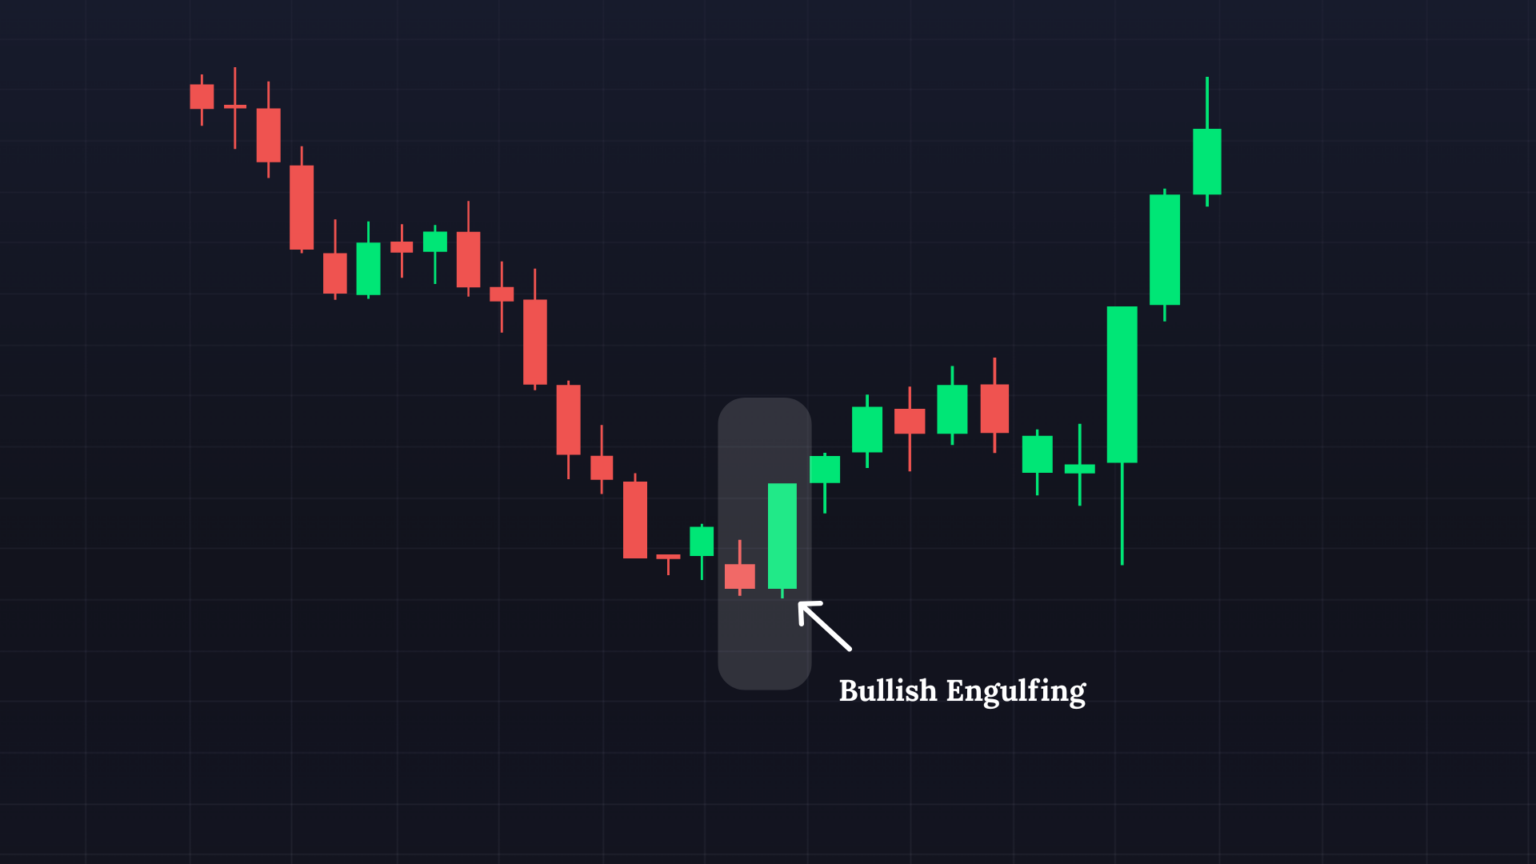
Long wicks (rejection tails) are your biggest giveaway. If Bitcoin dips below $104,800 but snaps back to close above $105,000, the lower wick screams rejection. Sellers got trapped, and buyers stepped in hard. Here is an example:
A bullish engulfing candle after a downside sweep, or a bearish engulfing candle after an upside sweep, is a strong reversal signal. It shows that not only did the sweep fail, but the opposite side took control immediately.
Doji or pin bar formations reflect indecision turning into rejection. A pin bar with a long tail below the liquidity often marks the point at which traders realized they were baited.
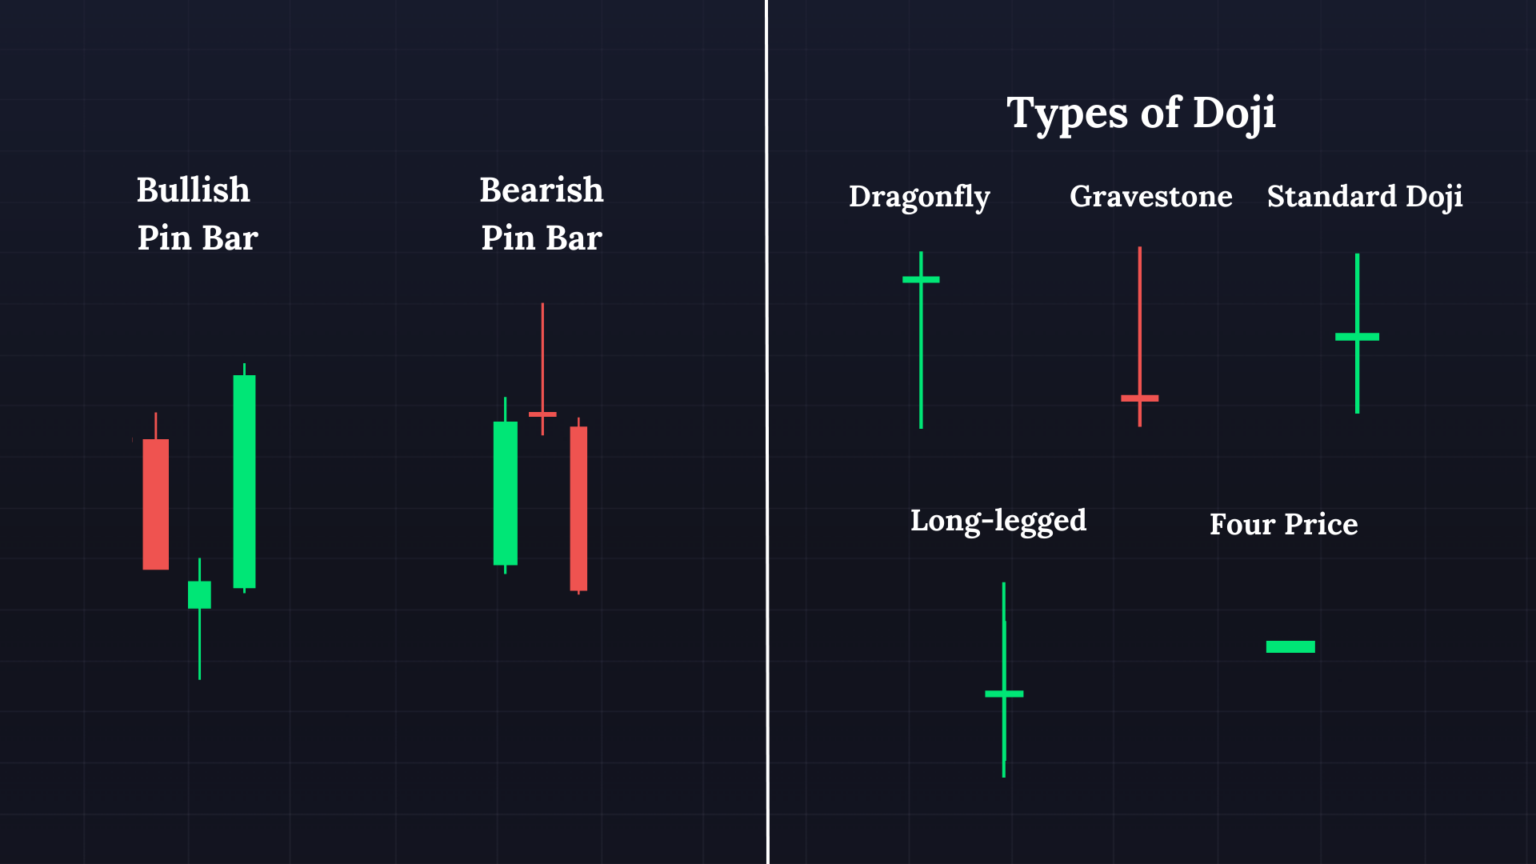
Caption: The Bullish and Bearish Pin Bar pattern and the types of Doji patterns to look for when price action enters a liquidity pool.
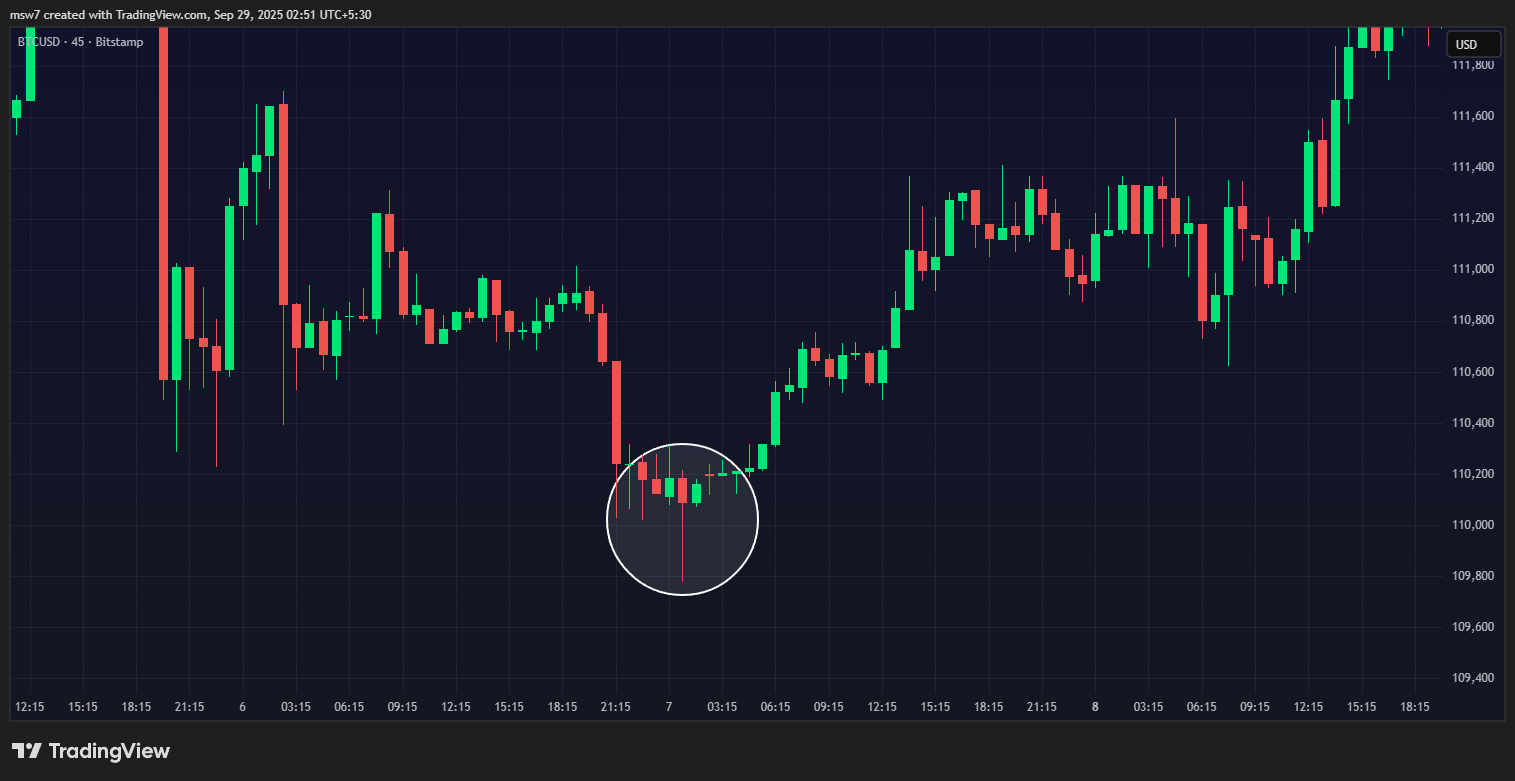
Let’s take a quick example. Suppose Bitcoin is trading in a tight range for three days. Suddenly, it spikes below the low end of the range at $102,200. Many traders may assume the range is breaking down and end up shorting aggressively. But the candle closes back inside the range with a long lower wick. That’s a classic sweep rejection. Anyone who shorted is now trapped, and savvy traders look to play the reversal higher.
The main idea here is that you don’t just react to the wick. Watch how the candle closes. A closed back inside the prior structure is your first layer of confirmation.
Step 2: Confirm the coin’s momentum.
Candle patterns can sometimes seem convincing, even when they aren’t. Without momentum backing your analysis, a candlestick pattern might just be noise, which is certainly a common occurrence in cryptocurrency. If I were looking to confirm a sweep through momentum, I would check three things:
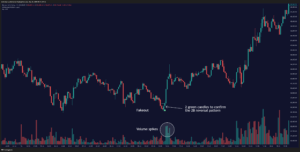
- When there’s a valid sweep, you’ll typically see a spike in trading volume. It’s because stops getting triggered means that orders are actually filling the book. If the candle from the sweep has low volume, it’s way more likely to be a false signal.
- Keep an eye out for divergence on indicators like RSI or MACD. For example, if Bitcoin makes a new low during a sweep but the RSI remains above its previous low, that’s a sign of strength, not weakness. It hints that the sweep might actually lead to a reversal.
- If you’re working with whale footprint charts, delta volume, or order book data, you’ll often notice traders getting trapped right after a sweep. For example, a wave of aggressive selling on the wick, followed by buyers quickly stepping in to absorb it, is a classic sign of a potential reversal.
As a final third check, you can upload the chart to the Zeiierman AI Analyzer. This step streamlines the process of identifying and confirming these sweeps by backing your bias with objective analysis.
3. How to execute liquidity sweep trades in crypto markets?
Step 1: Identify Key Liquidity Zones (The Setup)
Alright, we’ll start from the very top! You first need to find liquidity pools, which are the obvious swing highs or lows where a group of stop-loss orders is likely crowded.
Let’s say ETH is bullish right now. Identify a major swing low or a zone of equal lows (Sell-Side Liquidity). Say, ETH price has been consolidating and has created a clearly defined support level around $3,200. Retail traders who are long are likely placing their stop-loss orders just below this $3,200 level.
Step 2: Wait for the Liquidity Sweep (The Trap)
Next, we MUST wait for the price to aggressively move past the liquidity zone. This move is mostly the whales taking out the resting stop-loss orders.
Let’s continue with our ETH scenario. I’ll paint you a picture:
The price suddenly drops, printing a long wick that shoots below the $3,200 support, possibly hitting $3,180, before quickly snapping back higher. This aggressive, temporary breach is the Liquidity Sweep. But remember, the candle needs to close back inside the previous range, not below the swept low.
Read: Best Zeiierman Trading Indicators for CryptocurrencyStep 3: Confirm the Market Structure Shift (The Confirmation)
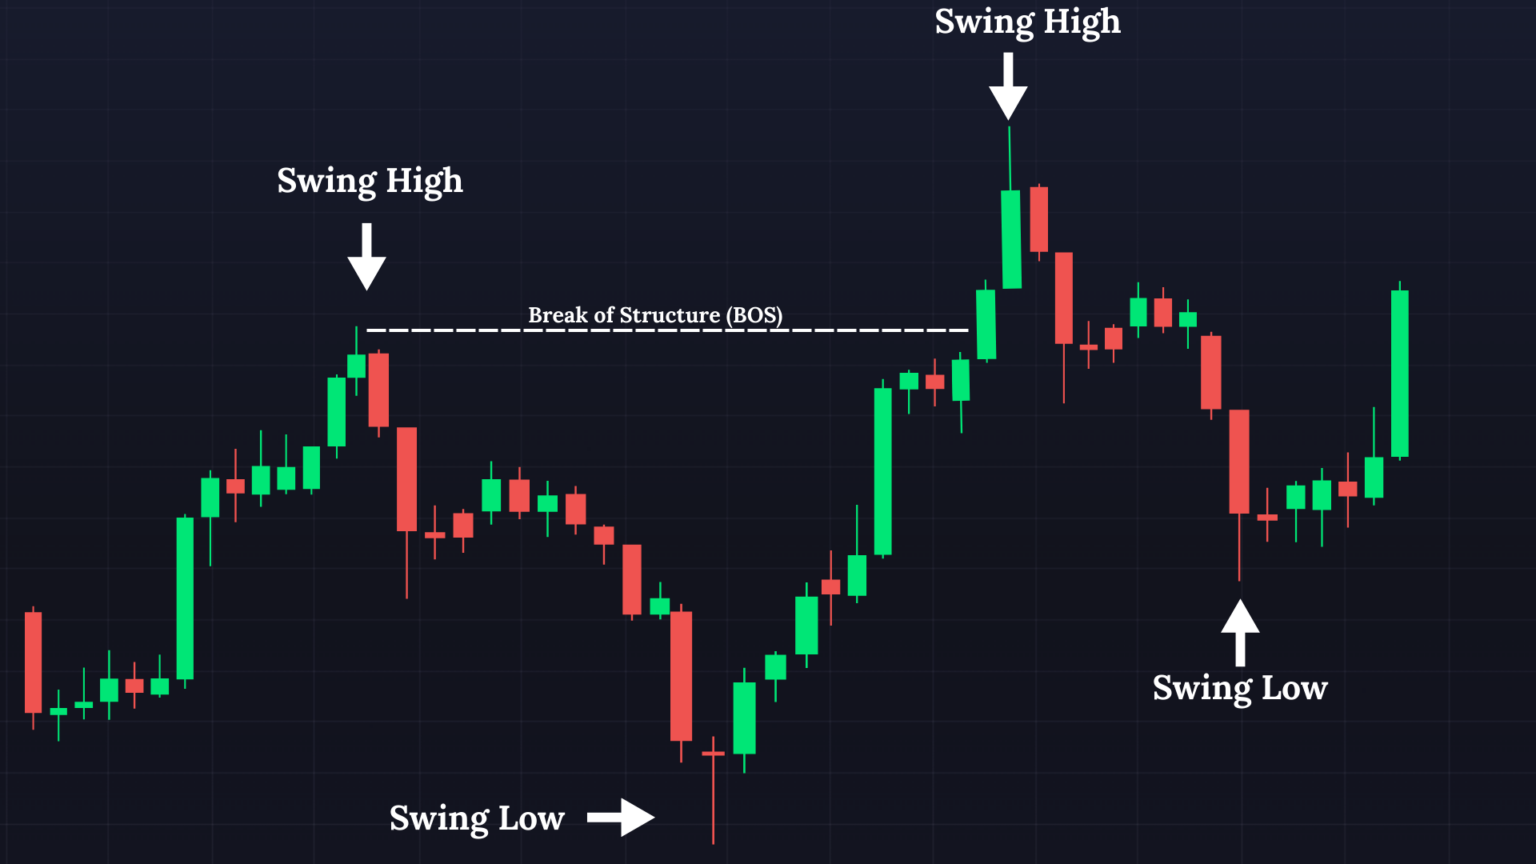
The aggressive reversal after the sweep needs confirmation that the institutional move is clearly complete and that the market is ready to move in the opposite direction. This is often called a Change of Character (CHoCH) or Break of Structure (BoS) on a lower timeframe.
In our ETH scenario, we would now switch to a lower timeframe ( 5-minute or 15-minute). After the sweep down to $3,180, you look for the price to break above the most recent swing high that occurred before the sweep, confirming the new, bullish momentum. Let’s say the price breaks above a recent minor high at $3,230. This break of structure confirms the buyers have taken control.
Our ICT Market Structure Screener comes in handy when you want to mark these key structures. This tool will provide signals for Change of Character (CHoCH), Break of Structure (BoS), and even Bullish/Bearish Market structure in real time.
Here’s a quick overview checklist for when you run your tests:
- Displacement strength: body size ≥ 1.5–2.0× ATR(14) on the signal timeframe.
- Volume confirmation: Volume (or Volume Delta) ≥ 80th percentile vs last 50 bars (or ≥ +1σ over 50-bar mean).
- Sweep penetration: Wick takes prior swing H/L by ≥ 0.25–0.50× ATR(14) then closes back inside prior range.
- Structure shift (LTF): CHoCH/BOS on the execution TF within 1–3 bars after sweep.
Step 4: Execute the Trade (Entry)
After the confirmed shift, you look for a retest back to a key institutional area that the sweep and shift created.
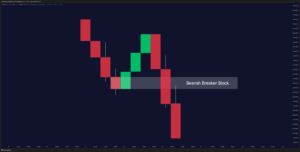
For high-probability entry zones, we want to look for an Order Block (OB) or a Fair Value Gap (FVG) that was formed during the aggressive reversal move. These blocks (or gaps) usually occur when the candle is displaced during the sweep.
ETH Scenario (Retest Entry): After the price breaks above $3,230 (the BoS), you wait for a pullback to the order block (the last bearish candle before the strong move up) or the Fair Value Gap formed by the displacement candle in the push to $3,230. Place your buy limit order in this zone, like something around $3,215.
It is highly recommended to use only 1-2% of your capital on trades with not more than 3x leverage. This way, when the position is active, it will be less affected by extreme volatile moments in crypto.
Step 5: Define Risk and Target
Stop Loss Placement: Your stop-loss must be placed safely beyond the extreme of the sweep’s wick, as this is the price point that invalidates the entire institutional move if it’s reached. In our ETH scenario, your stop-loss would be just a few dollars below the sweep’s low, say $3,175 (which is below the $3,180 wick low).
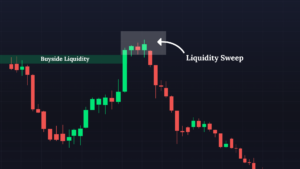
Take-Profit Placement: The logical target is the next central liquidity pool in the opposite direction, which is typically a significant swing high or an area of equal highs (Buy-Side Liquidity). You can also target with the Fibonacci Retracement, where the price usually shows up at potential support and resistance levels.
Identify a previous major swing high or a zone of equal highs at, for example, $3,350. Aim for a minimum 2:1 risk-to-reward ratio. If your risk is $40 ($3,215 entry – $3,175 stop), your target should offer at least $80 in profit. Since the $3,350 target is well above this minimum, it’s a valid, high-probability target.
4. Why are liquidity sweeps more violent in crypto?
The most common question we get (in our Discord community) about liquidity sweeps is why are they so brutal in crypto markets? I have realised that the difference lies in how liquidity is structured in crypto compared to other markets. Here are a few reasons behind it:
1. Fragmented liquidity: In forex, liquidity is provided by huge banks and institutional players. In stocks, centralized exchanges hold deep books. But in crypto, liquidity is scattered across Binance, Coinbase, Bybit, OKX, and countless other smaller platforms. This fragmentation makes it easier for the price to push quickly through thin spots.
2. Leverage Culture: In crypto, leverage is used left and right, even by traders who have very small capital. On most platforms, you can find them offering leverage of up to 50x or even 100x. This means that stop losses are much closer to the market, making them easier to hit. Just a small 1% price movement can completely wipe out over-leveraged positions, adding more liquidity to the market.
Read: Liquidity Sweeps vs Stop Hunts: Key Differences Explained3. Lower regulation: Regulation is a bit loose in crypto compared to equities or forex, where regulators keep a tighter grip on things to prevent manipulation. In crypto, it’s a different story. Large liquidation cascades can coincide with higher trading activity (and fees), and perpetual futures use funding and an auto-deleveraging (ADL) mechanism that can amplify moves during thin liquidity.
Liquidity sweeps are a major part of the crypto market, and you can’t avoid them. But once you understand how and why they happen, you can stop being the trader who constantly gets trapped and instead trade alongside the big players.
Whether it’s spotting liquidity pools, waiting for confirmation, or managing risks with clear stops, your edge comes from smart approaches and smart tools like the Zeiierman AI Analyzer, which can help you validate whether a sweep is worth trading, so you can act with more confidence.
SM_Trader
SM_Trader is a highly experienced coder and strategy developer who brings the most complex algorithms to life. As a member of MENSA, the prestigious organization for individuals with intelligence scores in the top 2% of the world, he combines exceptional analytical skills with a keen eye for numbers and statistics, empowering businesses to grow at the right pace and in the right direction.
More from SM_Trader