One of the hardest lessons I have learned in trading is that the market isn’t designed to reward obvious strategies. If trading were as simple as buying every breakout or shorting every breakdown, everyone would be a millionaire.
Liquidity sweeps reflect how institutions target retail stop-losses before moving the market in their desired direction. This often punishes the majority just before ultimately rewarding patient participants. If you’ve ever wondered why your stop-loss got hit right before the market ran in your favor, you were likely on the wrong side of a sweep.
I am a smart money trader (well, duh!). Liquidity sweeps play a key role in Smart Money Concepts (SMC), as they help determine how large institutions influence the markets. They act like footprints left by major players looking for liquidity. By getting a good grip of these sweeps, you can not only avoid your stop hunts but also take advantage of those market moves and trade alongside the smart money.
1. Why do liquidity sweeps happen?
Let’s start with the definition first.
A liquidity sweep is a targeted move where the price intentionally breaks a key high or low to trigger stop orders sitting there. Once the stops are hit, institutions gain the liquidity they need to enter or exit large positions with minimal slippage, and the price usually snaps back in the opposite direction.
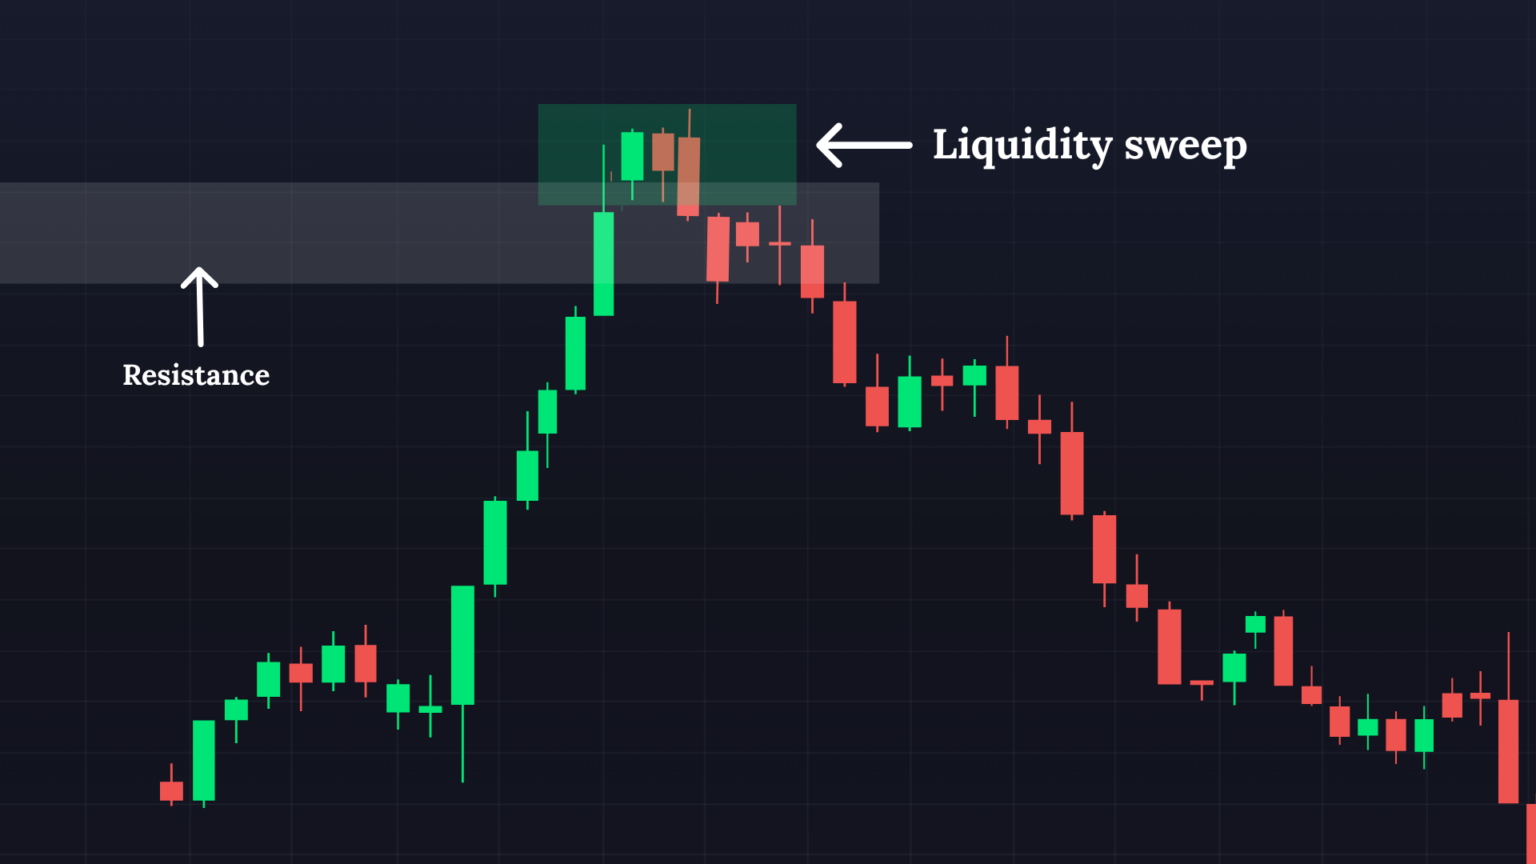
Here’s how it would play out in front of you. Retail traders put stops above the resistance or below the support of their active positions. Next, institutions drive price into that zone (also called the Liquidity pool) to trigger those stops. Once liquidity is collected, the real move begins – which is often opposite to the breakout direction.
One of the main reasons for their occurrence is to capture the money waiting on the sidelines. Here are the factors that lead to liquidity sweeps:
1. Stop Pools: Every swing high or swing low attracts stop-loss orders. Above equal highs, you’ll find buy stops from short traders. Below equal lows, you’ll find sell stops from long traders. These stop pools are like liquidity magnets.
2. Liquidity Zones: Areas of equal highs and equal lows are especially attractive for big players. They scream breakout to retail traders but signal “stop hunt” to smart money. The consolidation ranges also collect liquidity on both sides, setting up perfect sweep opportunities.
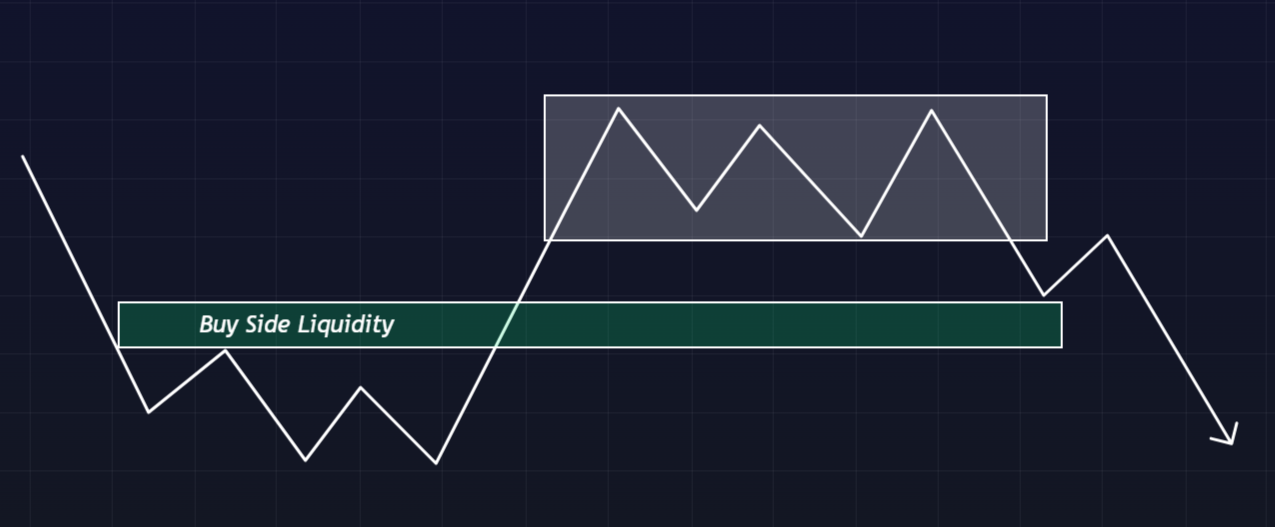
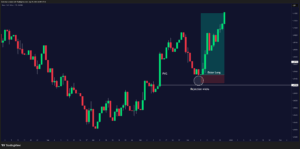
Caption: Buy-side liquidity zones are the areas where short sellers have put their stop losses. These zones are usually found in a range where the traders are most expected to take an exit (limit stop order).
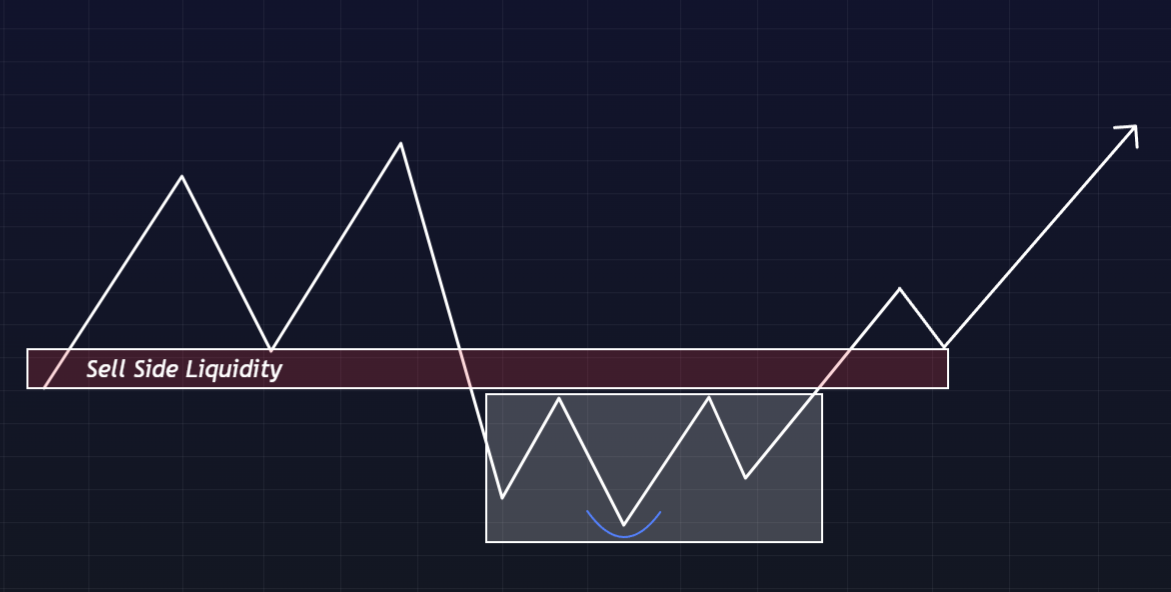
Caption: Sell-side liquidity zones are the areas where long traders have put their stop losses. Understanding these levels or zones can be quite helpful as they indicate points where large portions of sell orders can trigger, which may lead to a potential market reversal.
Read: Order Blocks Explained: The Institutional Strategy Traders Need to Know2. How to identify liquidity sweeps?
The trick is to learn to spot the setup conditions and then recognize the footprint left behind by the sweep.
Step 1: Spot Obvious Liquidity Pools
Liquidity often builds up in highly predictable places. If you know where retail traders typically put their orders, you already know where institutions will look to harvest them.
Swing highs and swing lows are basic liquidity magnets. Retail traders love to hide their stops just above the most recent swing high or just below the most recent swing low. When price revisits these levels, you should already be alert for a potential sweep.
Seeing two equal highs or lows (Double Tops/Bottoms) at the same level nearly guarantees a cluster of stops just above or below. To retail traders, this signals strong S/R, but for smart money, it’s a classic stop-loss target.
Trendlines are popular but not foolproof. Markets often cut just past a clean trendline, then snap back. A sharp move through a trendline and a quick reversal are often signs of a liquidity sweep. Also, watch round numbers, Fibonacci retracement, and significant price points where many orders gather, as these are psychological market levels.
Step 2: Confirm with Candlestick Behavior
A sweep leaves fingerprints with the candlestick patterns and volume. Once you know what to look for, you can tell the difference between a genuine liquidity raid and a regular price swing.
A long wick stabbing above a high or below a low is often the first sign of a sweep. When you see a long wick that extends beyond a significant level, but the body closes back within the range, that’s often liquidity being harvested. The longer the wick relative to the body, the more meaningful the sweep.
Look for rejection candles. Pin bars, engulfing patterns, or sharp rejections right after a wick into liquidity strengthen the case. They show that smart money immediately reversed the price once liquidity was secured.
Perhaps the most meaningful sign of a liquidity sweep is a displacement candle — a large, one-sided candle that follows the sweep. It shows that institutions didn’t just grab liquidity for fun. They had a clear directional intent and pushed price aggressively afterward.
Finally, look for volume spikes. You may not catch them on every timeframe, but when there’s a volume spike during the sweep, it can signal that big players are stepping in. Seeing a high volume during a liquidity grab, followed by steady volume in the other direction, is a clear sign of an incoming sweep.
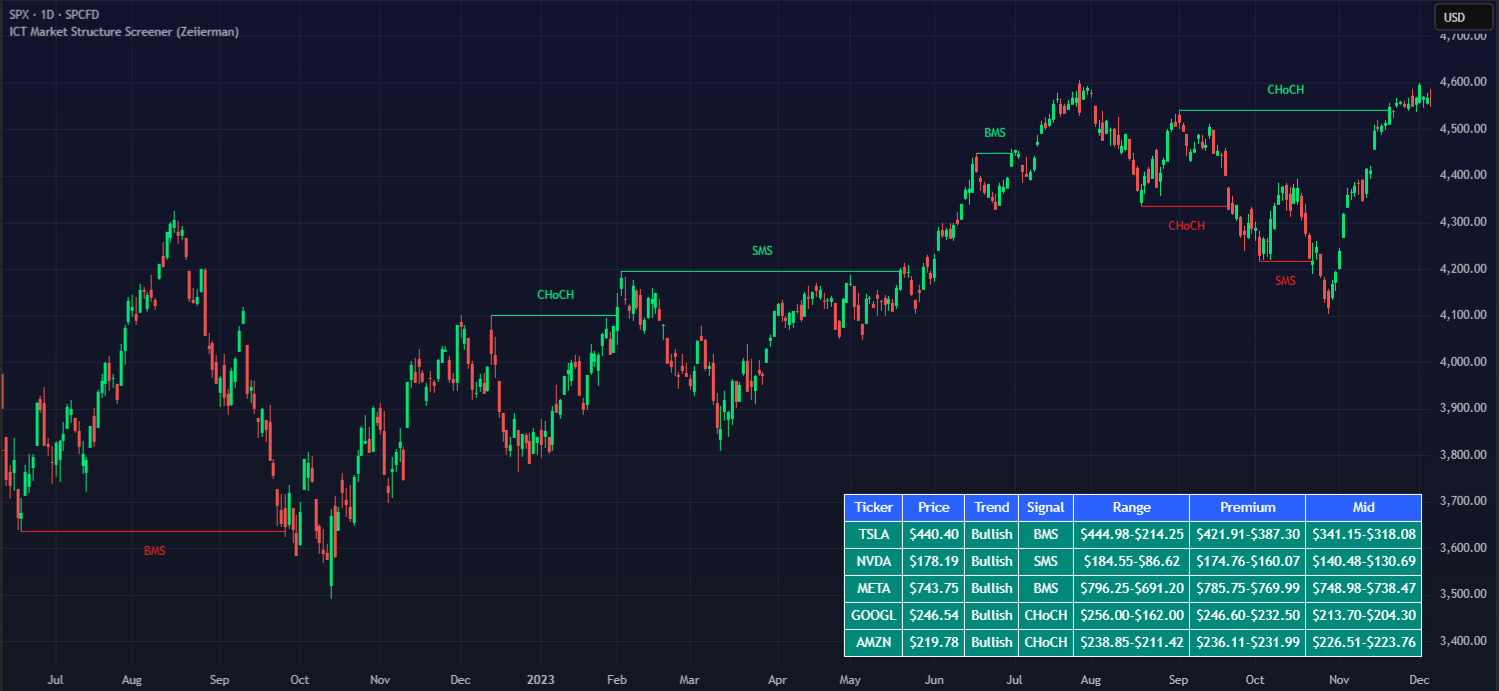
📌 Pro Tip: Combine candlestick signs with Zeiierman’s ICT Market Structure Screener on TradingView. It can alert you when a rejection candle or a displacement aligns with a structural shift, such as CHoCH or BOS, for additional confirmation.
Step 3: Look for Higher Timeframe Context
Looking up the overall market context will help you separate weak sweeps or fakeouts from high-probability ones.
A sweep that aligns with the dominant higher-timeframe trend carries more weight. For example, in a daily downtrend, a 15-minute sweep of equal highs is often the setup for continuation on the lower side. Sweeps against the higher timeframe trend are riskier. They may work, but follow-through is weaker, and targets are often missed. These are usually short-term traps with little room to ride.
While you should dive into the charts, a good trader always zooms out for macro context. Never forget that the market is dynamic. It can be affected by unaccounted variables like high-impact news (liquidity sweeps are common during major news events), session opens (especially London and New York), and high timeframes.
Instead of juggling multiple charts and timeframes, this is where you can use Zeiierman’s AI Chart Analyzer. You just have to upload the charts, and it scans across timeframes and marks out important zones that overlap with higher-timeframe bias. The double confirmation from the AI analysis can save you from the classic mistake of treating a minor sweep as a major reversal.
3. Liquidity Sweeps vs Liquidity Grabs
We often use “liquidity sweep” and “liquidity grab” interchangeably, but they’re not identical. First, the similarities: both involve prices running beyond a well-watched level to trigger resting orders (stops/stop entries) and access liquidity. The difference is mainly in scope and intent.
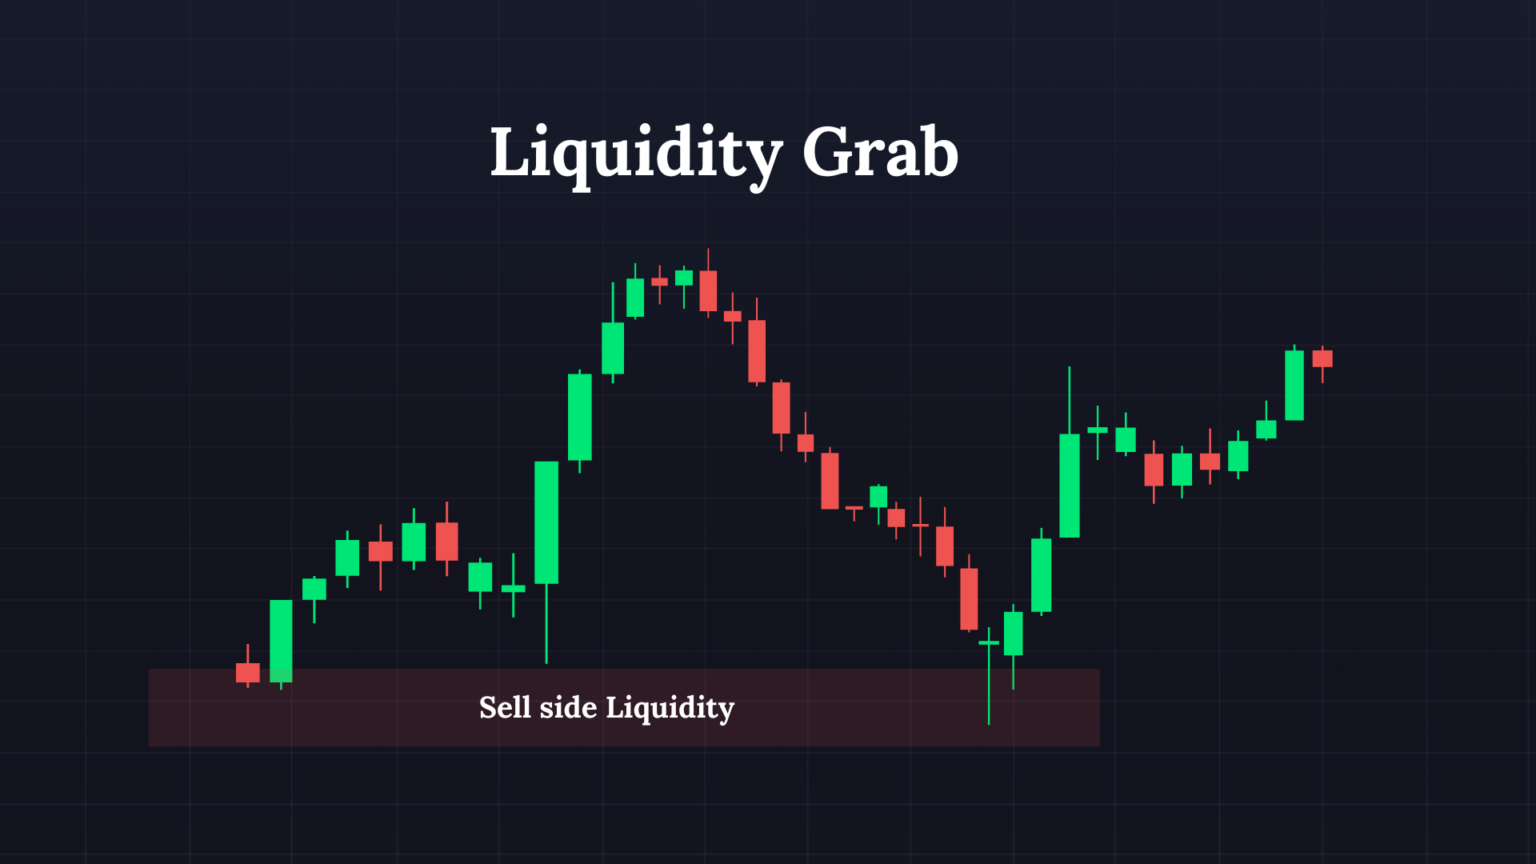
A liquidity sweep is the broader move where price intentionally pushes through a key area to absorb a cluster of orders across several ticks/levels. A liquidity grab is the tighter, surgical tag of a specific line (e.g., equal highs) that quickly reverses after harvesting those orders.
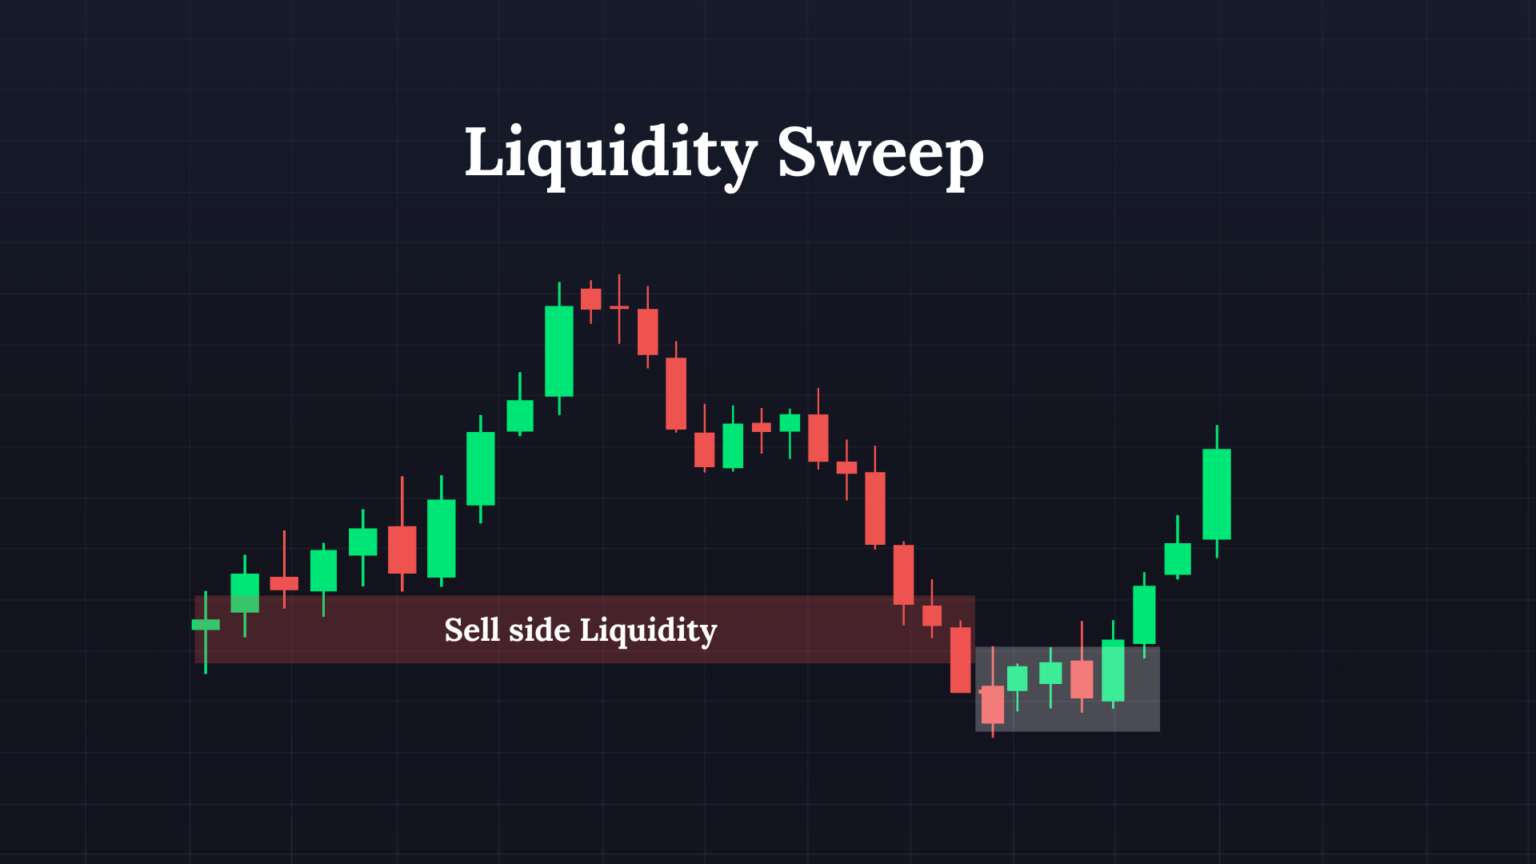
This distinction shows up in how the candles print (depth/duration), how much orderflow gets cleared, and how you time entries after the run. While both can be profitable, sweeps generally offer better risk-reward opportunities, while grabs require greater precision and tighter risk management.
| Aspect | Liquidity Sweep | Liquidity Grab |
|---|---|---|
| Scope | Broad run clearing multiple neighboring prices/levels | Pinpoint tag of a single obvious level |
| Duration/Speed | Can span several candles; not always instantaneous | Usually fast, single-candle wick beyond the level |
| Typical Signature | Large displacement candle, often leaves an FVG; body closes beyond level | Long wick beyond level, close back inside prior range |
| Intent (inference) | Absorb a larger pool of stops/liquidity before repricing | Harvest nearby stops with minimal slippage, then snap back |
| Common Locations | Above/below swing clusters, session highs/lows, prior day extremes | Equal highs/lows, round numbers, prior high/low of day |
| Post-Move Expectation | Reprice toward opposite liquidity or into imbalance; may pause first | Swift mean-reversion into the prior range |
| Risk to Traders | Fading too early; mistaking expansion for sweep | Chasing after the wick; stops too tight at the level |
| Confirmation Clues | Body ≥ ATR threshold, FVG left behind, BOS/CHoCH follow-through | Rejection wick + close back inside, micro-structure shift |
4. How to confirm liquidity sweeps before exiting?
Marking a liquidity sweep or zone is just half the battle. If you act without confirming it first, there won’t be any difference between a trade and a bet. Big institutions like it when traders jump in at the first sign of action. But smart money traders hold back until they see solid, layered confirmation before they commit to any move. Here are some factors you may want to check to confirm the sweep:
Check 1: Volume Signals
Liquidity sweeps manipulate order flow, and true sweeps are rare in low volume. If volume doesn’t pick up after a sweep at a key level, it’s just noise. Watch for a sharp volume spike at the sweep, when equal highs are taken. Follow-through volume usually appears during the rejection candle or a displacement move.
📌 Pro Tip: Use Zeiierman’s Volume & Price Profile Tool, which assists in mapping whether volume is concentrated in the wick (fakeout) or in the body (real follow-through). Sweeps that leave heavy volume behind in the wick often fail.
Check 2: Market Structure Shift (CHoCH & BOS)
Price action gives the most reliable confirmation. A sweep after a Change of Character (CHoCH) or Break of Structure (BOS) indicates a shift in the market.
A Change of Character (CHoCH) is the first sign to look for. It happens when the immediate intraday structure flips. For example, the price breaks a recent low (in a bullish sweep) or high (in a bearish sweep). A Break of Structure (BOS) will be a deeper confirmation, where price doesn’t just take out a minor level but breaks through a significant swing low/high, confirming a broader trend shift in price action.
Most traders in our community use the ICT Market Structure Screener to identify these key patterns and capitalize on institutional trading behavior.
Check 3: Wait for Displacement Candle Follow-Through
A displacement candle is your final stamp of approval. It’s a large, full-bodied candle that leaves an imbalance in its wake. You heard it here first, folks: sweeps without displacement often lead to chop.
Look for a strong, decisive candle (or a series of them) that closes strongly in the new direction. It shows that smart money is serious about moving the price and isn’t just messing around. This is your green light to make a smart move. Pun-intended.
Some quick checks for you:
- Displacement size: body ≥ 1.2× 14-ATR on execution TF.
- Wick penetration: sweep wick extends ≥ 0.2× 14-ATR beyond the taken high/low.
- Close location value (CLV): post-sweep displacement candle closes in the top/bottom 25% of its range (i.e., conviction).
- Volume: sweep + displacement shows ≥1.5× 20-bar average volume (or ≥ Z-score 1.5 if you use normalized volume).
- Structure shift: micro CHoCH within ≤ 5 bars of the sweep; BOS within 20 bars (HTF-aligned).
- Imbalance left behind: visible FVG spanning ≥ 0.5× 14-ATR; treat first revisit as the A-tier entry.
📌 Pro Tip: Mark the imbalance (fair value gap) left by the displacement candle. If the price gets back into it, that’s often the high-probability entry zone. Zeiierman’s Liquidity Void Detector will help you identify these imbalances, making it easier to prepare precise entries.
5. How to execute liquidity sweeps?
So far, we have successfully identified and confirmed that a liquidity sweep is incoming. The next step is the most crucial one: we gotta time our exit strategy properly to ensure maximum profits.
Step 1: Enter the liquidity sweep.
You can go in one of two ways: conservative or aggressive. Your choice of approach is largely determined by your market experience and risk management strategy.
Conservative Entry (Retest): Naturally, the conservative approach requires waiting for the price to retrace into the sweep zone or the fair value gap (FVG) left by the displacement candle. In practice, you wait for the sweep and drop, and then allow the price to climb back into the imbalance created by the bearish displacement before shorting.
The waiting makes it a higher-probability entry. On the flip side, it can lead to FOMO because the price may never retrace, and you miss the move without entering the trade.
Aggressive Entry: Enter immediately after the displacement candle confirms the sweep. This gets you in earlier but increases risk. After the price sweeps above equal highs, you wait for it to drop with a large bearish displacement candle, but you sell at the close of that candle.
By entering at the very beginning of the move, you’ll maximize your reward-to-risk ratio. As such, you’ll have a higher chance of being wrong if the sweep fails since there was never time to retest for confirmation.
📌 Pro Tip: I have seen many Zeiierman community members take a hybrid approach. The idea is to take a small, aggressive position with a tight stop, then scale in on a conservative retest if it comes. That way, they don’t miss the trade entirely, but they still get a safer entry if the market offers it.
Step 2: Place your stop-loss.
The stop loss placement is absolutely crucial in sweeps. DO NOT get rolled into a liquidity hunt by placing it too tight and getting wicked out again, or too loose, which kills your risk-reward. One of my golden rules is that your stop must be beyond the liquidity sweep wick.
For Bearish Sweeps (above highs), place your stop just above the highest point of the sweep wick. For Bullish Sweeps (below lows), place your stop just below the lowest point of the sweep wick.
The logic is that liquidity sweeps are designed to hunt down stops. Unless you misidentified the sweep, the market is rarely coming back for another one after the level has been covered. By placing your stop beyond the wick, you’re protected against noise but cut off quickly if your setup is invalidated.
Note: If you wish to be further conservative with your trades, place stops beyond the actual structural level that was swept, rather than just the wick high or low.
Step 3: Establish your take-profit strategy.
The golden rule is that, in most cases, a liquidity sweep is not a “market move.” It’s a planned play by institutional traders. Big institutions don’t just stop hunting for fun, but they move prices with purpose, usually to collect liquidity from one level and deliver it to another.
Here are some logical trades for you to consider for your take-profit:
I. Next Liquidity Pool
Price usually doesn’t sweep liquidity and then goes all over the place. Instead, it travels to the other side of the range to collect stops in the opposite direction. This target works because markets are efficient in the long run, but messy in the short run. You can use our ICT Market Structure Screener on TradingView to check if the BOS or CHoCH are pointing toward continuation (range expansion) or reversal (back into the old range) after the sweep.
II. Fair Value Gaps (FVGs) or Imbalances
Displacement candles create imbalances, which are zones where one side dominates. Institutions often fill these gaps to make ideal profit targets. To spot FVGs, look for a three-candle formation where the low of the second candle is above the high of the first candle (bullish gap) or vice versa.
Read: Fair Value Gaps (FVGs): The Hidden Zones Institutions Leave Behind📌 Pro Advice: Combine targets to plan smarter exits. Professional traders rarely rely on just one target. Instead, they stack targets to scale out in layers.
6. Conclusion
Most traders know the frustration of stops getting hit just before the real move starts. Liquidity sweeps cause this. Simply knowing that isn’t enough. You need clear rules for spotting them, waiting for confirmation, and then executing with discipline. Once you build that structure into your trading process, stop hunts stop feeling random. They start giving you a deeper understanding of how the market moves. For an extra layer of confidence, use tools like the Zeiierman AI Analyzer. They offer an unbiased second opinion and an edge before you even take your position.
SM_Trader
SM_Trader is a highly experienced coder and strategy developer who brings the most complex algorithms to life. As a member of MENSA, the prestigious organization for individuals with intelligence scores in the top 2% of the world, he combines exceptional analytical skills with a keen eye for numbers and statistics, empowering businesses to grow at the right pace and in the right direction.
More from SM_Trader