You may have noticed the market making a massive move and wondered why the price often retraces back into the middle of that big impulse candle, as if it had some unfinished business there. That’s not random, no sir. It’s the footprint of big players in the market, like institutions, funds, or algos moving serious size. This is what we call a Fair Value Gap (FVG).
A Fair Value Gap is a technical pattern that occurs when price makes a rapid move, because an institutional order flow left a temporary imbalance in the market. It forms with three candles, where the middle candle is a strong move with a large body, and the first and third candles are often small and don’t overlap.
Simply put, it is a zone where price action skipped over a few levels without much trading, meaning there was an unfair exchange between buyers and sellers. These areas often attract the price later on, and the market often returns to “fill the gap” like magnets, pulling the price back to that unfinished business.
Let me teach you how to interpret these FVGs and profit off of them.
1. How do Fair Value Gaps form?
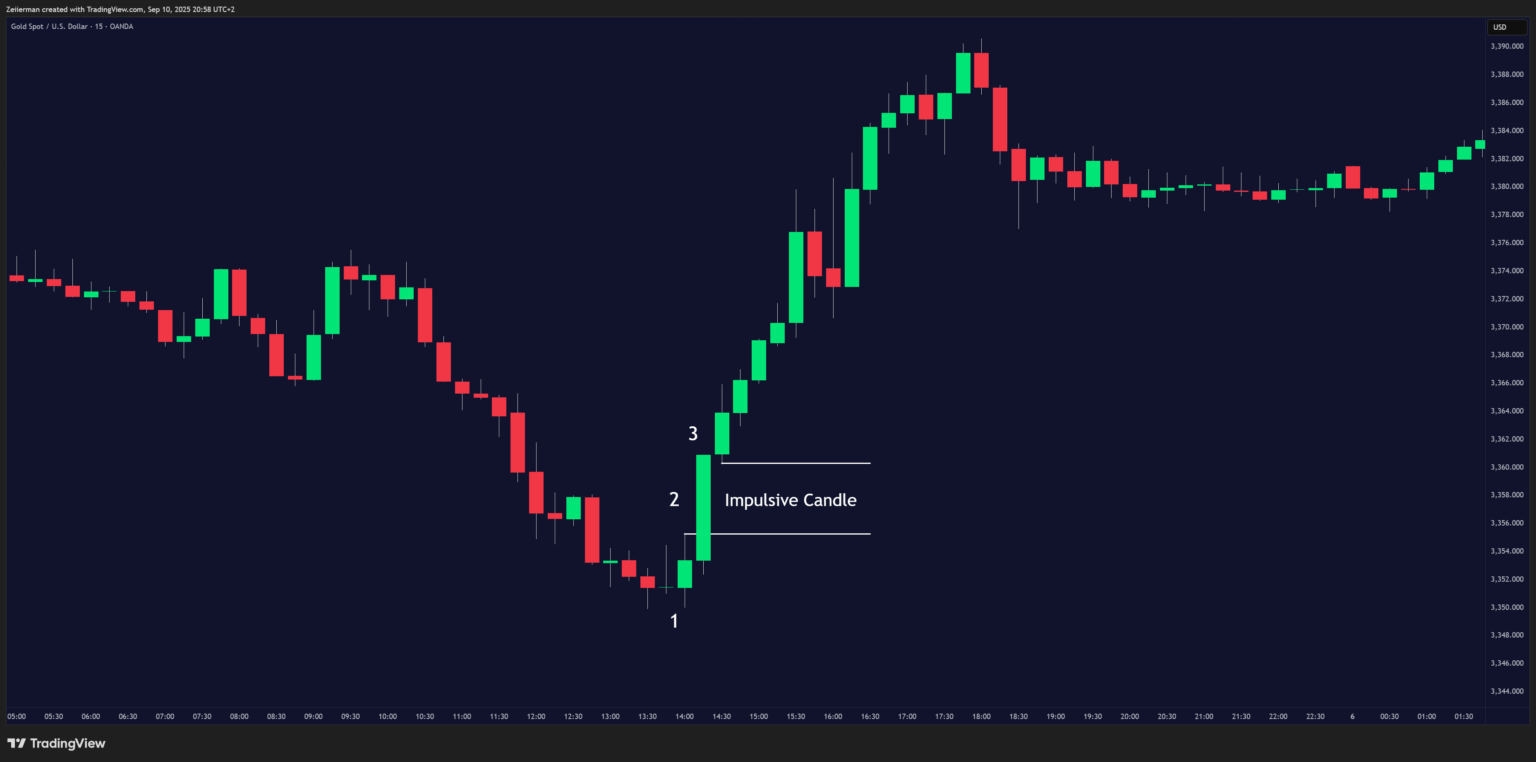
Let’s start with their anatomy. Most FVGs follow the same blueprint, which is a three-candle pattern that creates a gap in price action. Here’s how it works:
Candle 1 (The Setup): This is your foundation candle. Nothing special happens here, it’s just setting up the stage.
Candle 2 (The Impulse): This is where the magic happens. This candle makes a very strong move up or down, creating the actual gap. It’s usually a large-bodied candle that shows serious buying or selling pressure.
Candle 3: This candle often continues in the same direction as Candle 2, but here’s the key – there’s a gap between Candle 1’s extreme and Candle 3’s opposite extreme.
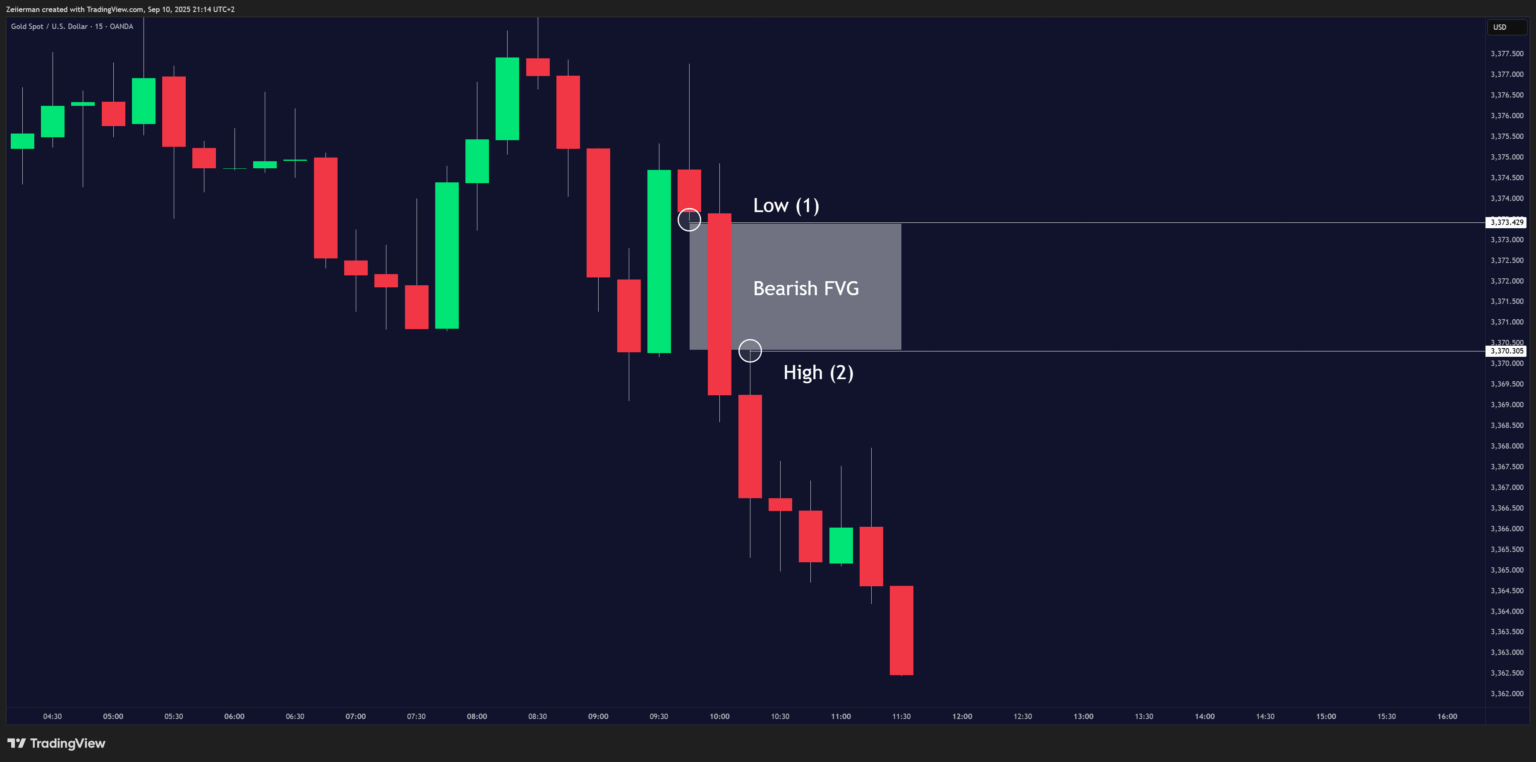
The Gap: This is the space between Candle 1’s high/low and Candle 3’s low/high where no actual trading took place. This empty space is your Fair Value Gap, which is later filled by the price action.
Markets work on the principle of fair price discovery. Every price movement is an auction where buyers and sellers battle it out to find a balance. There are three common scenarios that often lead to the formation of such a gap:
1. Institutional Order Flow
Big players like hedge funds, and central banks don’t execute like retail traders. They use size, and their orders can dominate the available liquidity. When that happens, the price may jump levels. Like when a big whale decides to dump millions worth of BTC/USD, price gaps down fast, leaving behind unfilled areas.
2. High-Impact Economic News
Major announcements like those from the FOMC, rate decisions, earnings surprises, inflation reports (CPI), or jobs numbers. A surprise figure can send prices screaming in one direction, leaving a massive FVG.
3. Low Liquidity Zones
Sometimes, there just aren’t enough limit orders to fill a market order, especially during off-hours or in thinly traded assets. This causes the price to “gap”.
Read: Adding Liquidity vs. Taking Liquidity in Trading2. How to identify FVGs like a pro?
Here’s your step-by-step system for identifying high-probability FVG.
Step 1: Scan for 3-candle sequences. Don’t overthink this. You’re looking for any three consecutive candles where the middle one creates a strong move with a large body and leaves a space in price action.
Step 2: Measure the gap precisely. There must be absolutely no overlap between Candle 1’s extreme and Candle 3’s opposite extreme. Even a single point of overlap disqualifies the setup.
Step 3: Confirm the market context. Is the market trending strongly or chopping around sideways? This makes a lot of difference in whether your FVG will hold.
Step 4: Check the significant time frames for reliability. A Fair Value Gap on the daily chart carries much more weight than one on a 5-minute chart. Higher timeframes equal stronger FVGs.
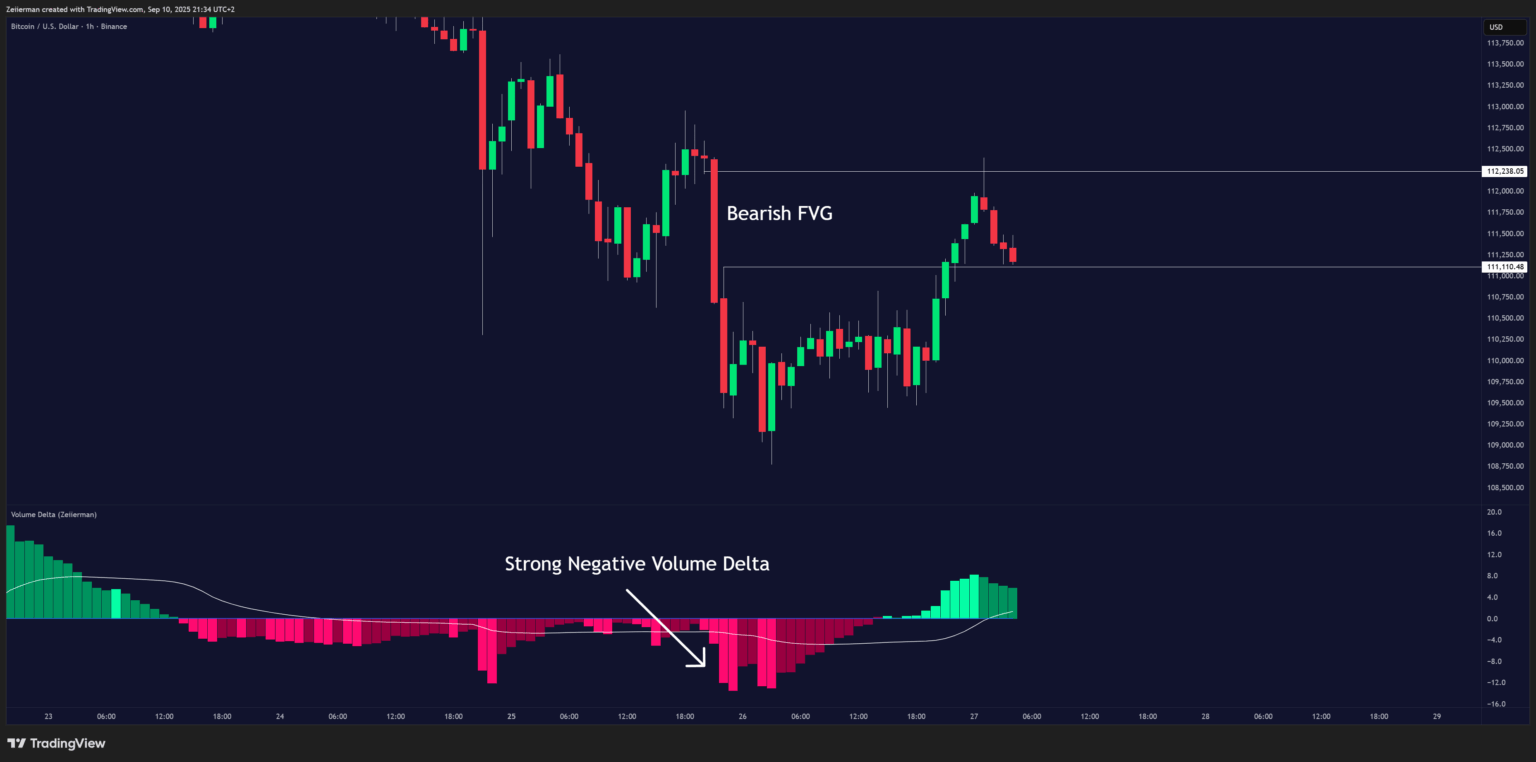
Step 5: Validate with volume. Use the Volume Delta indicator to check the impulse candle (Candle 2) for a strong delta reading. This shows whether aggressive buyers or sellers truly stepped in, confirming genuine institutional interest behind the move.
Easy now, tiger. It’s actually more important to understand when you should avoid these Fair Value Gaps. Similar to everything else in the market, they’re not always going to be on your side.
When to avoid Fair Value Gaps?
- Periods when the market is range-bound or consolidating. During these times, FVGs lose their predictive power because there’s no clear directional bias.
- Low volume periods like major holidays or summer Fridays often produce false FVG signals that don’t behave according to normal rules.
- Major economic announcements can invalidate previous FVGs instantly, so be careful when trading them around high-impact news.
3. FVG vs Other Technical Concepts
It’s incredibly easy to confuse FVGs with similar concepts such as Traditional Gaps or Liquidity Voids. So, how does one differentiate between the two? Well, it’s actually easy.
I. FVG vs Traditional Gaps
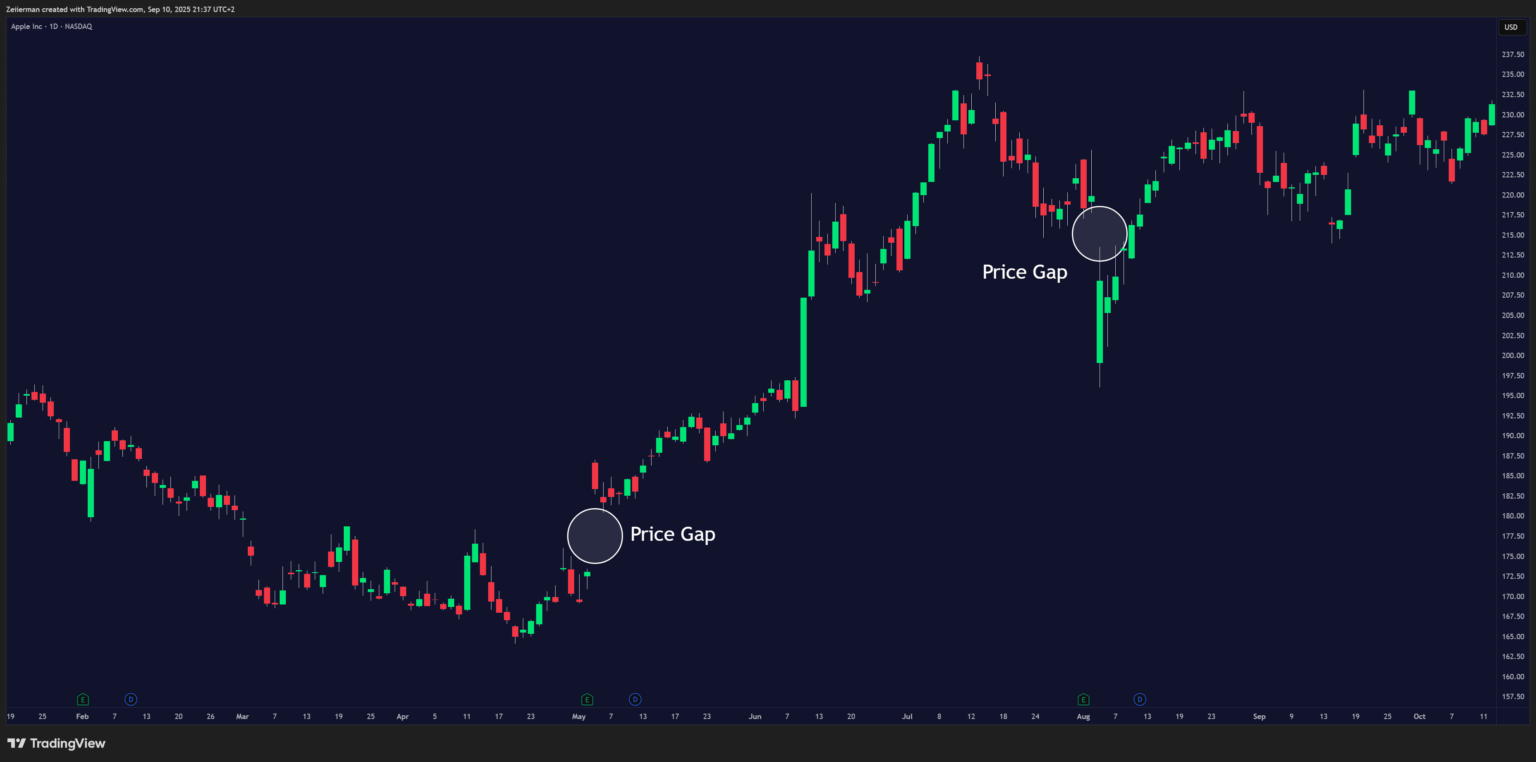
The regular gaps usually occur because of what happens after the break in trading hours, like when the market closes in New York and reopens in Tokyo. These show up as large blank spaces between one day’s close and the next day’s open.
Example: A stock closes at $100 on Friday and opens at $105 on Monday, that’s a traditional gap due to overnight sentiment or news.
Whereas Fair Value Gaps (FVGs) happen within a session, with the price action of three successive candles, not between sessions. They’re not caused by market closing but by fast price movement during active trading hours.
Example: In a bullish move, Candle 1 closes at $100, Candle 2 spikes and closes at $110, and Candle 3 opens at $115. The $105–$110 range was skipped — that’s your FVG.
II. FVG vs Order Blocks
Order Blocks are price zones where large players executed significant buy or sell orders, leaving a visible footprint on the chart. They can appear after consolidation, during a trending move, or even in highly volatile conditions. Think of them as “launchpads” for price, where institutional activity sets the stage for the next move.
FVGs, on the other hand, are results of those smart money moves. When institutions move prices aggressively, they leave behind these gaps where orders didn’t get filled. It’s not a base, it’s the displacement that follows. Think of the FVG as the footprint left behind after an order block explodes.
III. FVG vs Liquidity Voids
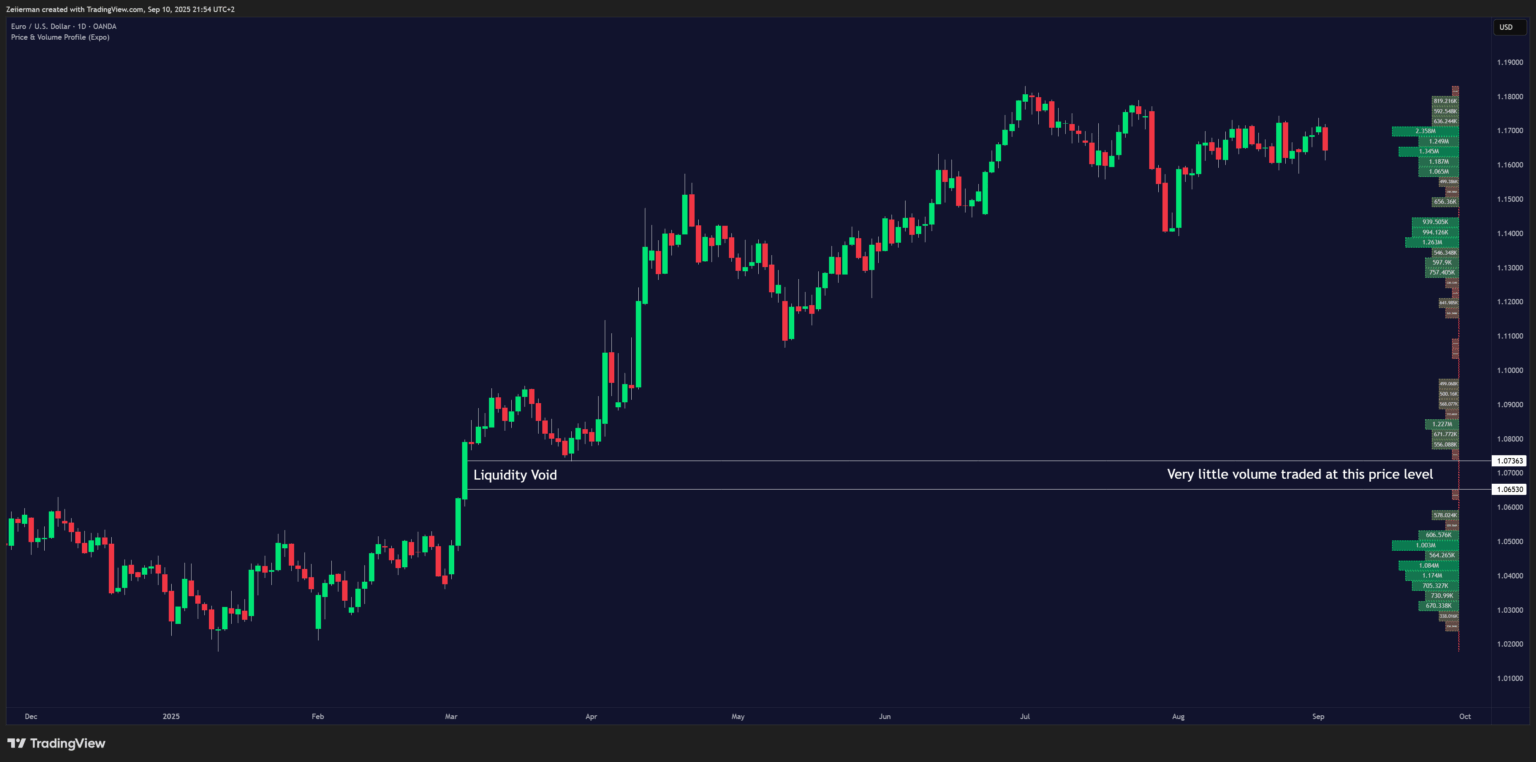
Liquidity Voids are broader zones where there’s very little market activity. These typically extend across several candles and not just three, and are identified by low volume or very low intensity price action. They signal areas that institutions may ignore or later target for rebalancing, but they’re longer-term inefficiencies.
FVGs are sharper and shorter. They form fast with aggressive movements, and often get filled quickly (refer to the image given above). While both indicate imbalance, FVGs are much more precise and a short-term price action show.
Liquidity voids are like dry deserts on the chart. FVGs are like skipped steps on the stairs, quick but noticeable.
TRY: Liquidity Levels / Zones on TradingView4. How to trade Fair Value Gaps correctly?
I. The Gap Fill Strategy
The Classic FVG Fill Trade is the most common and beginner-friendly FVG approach. In case of a bullish FVG, you can follow these steps:
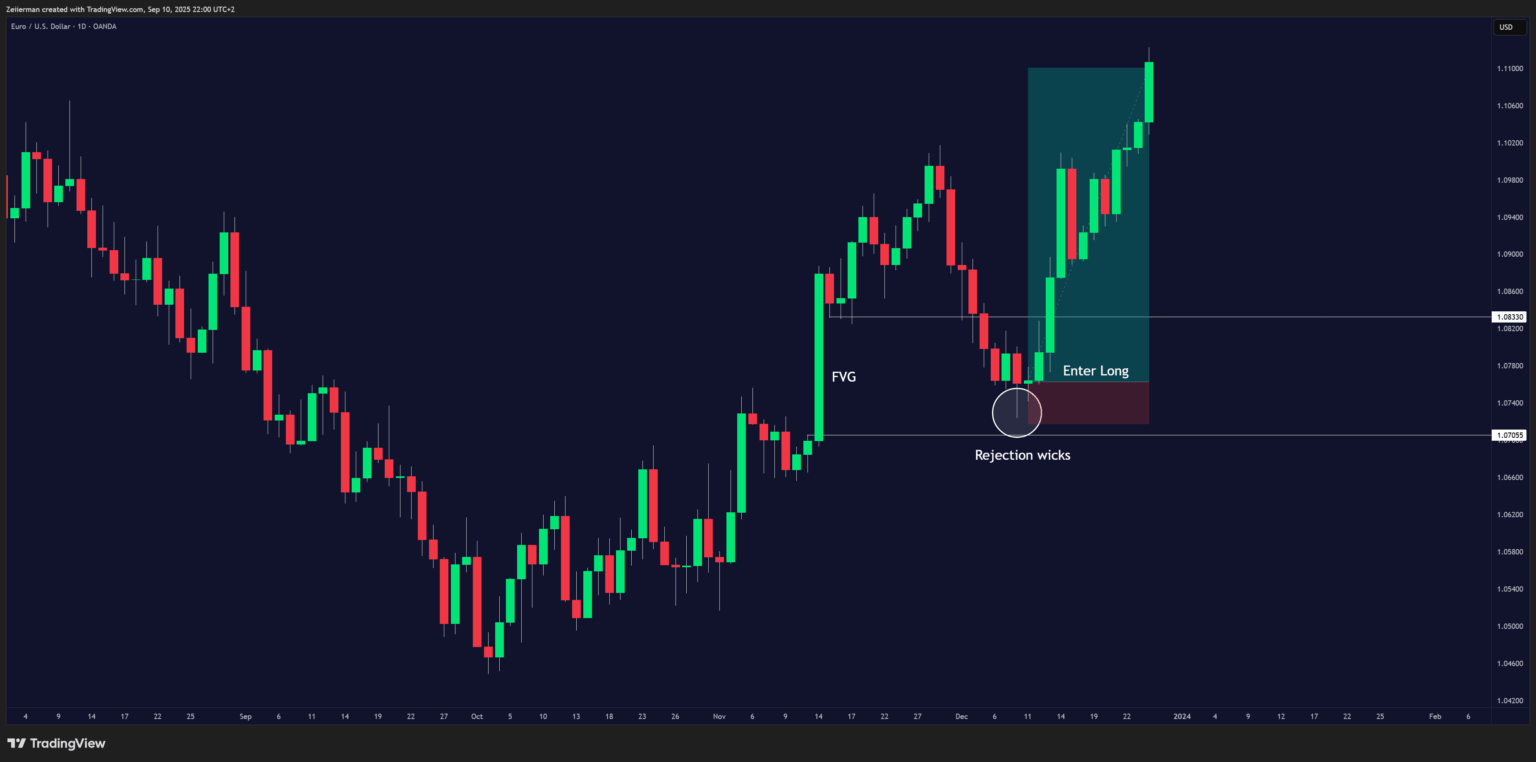
Step 1: Identify a clear FVG.
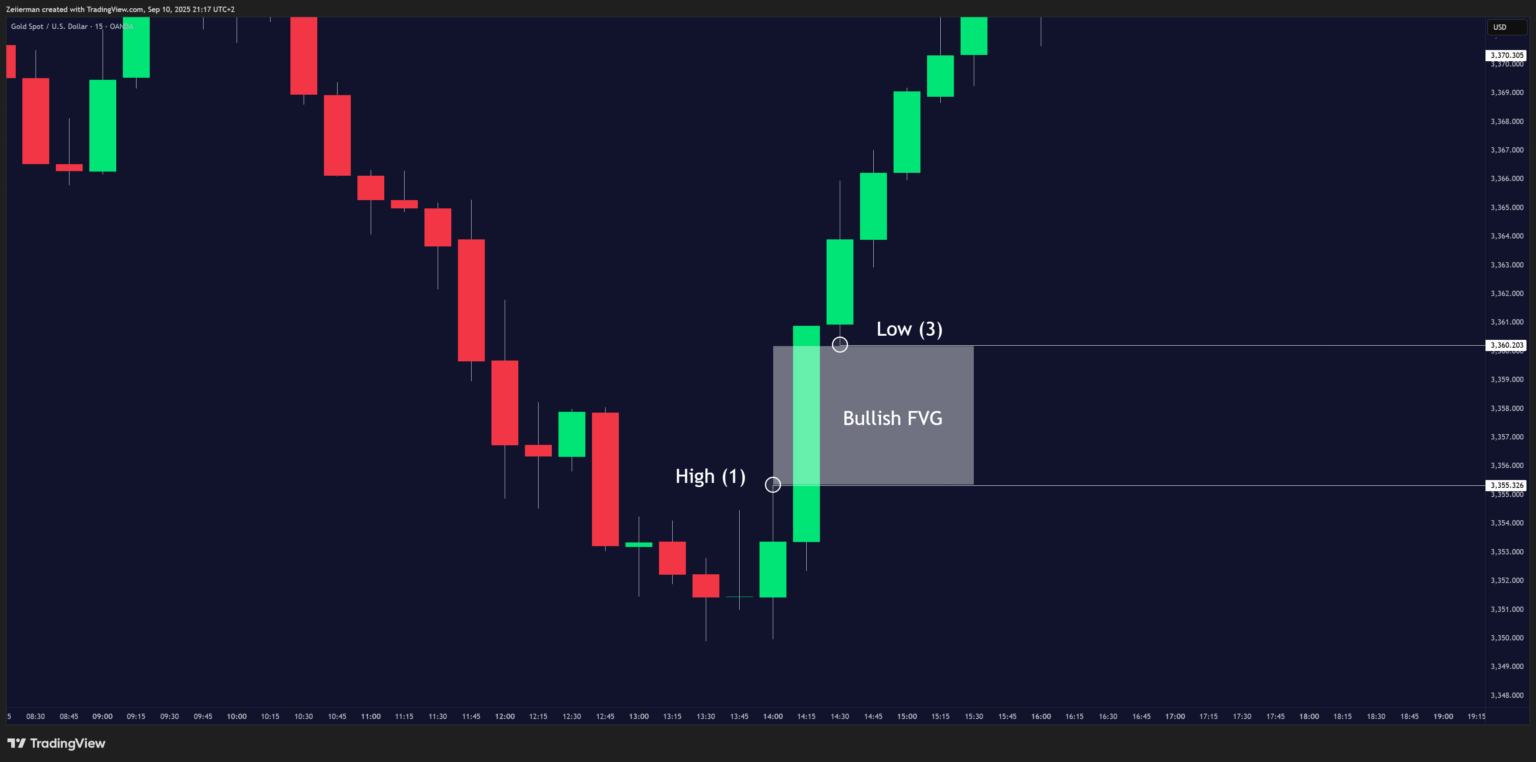
Look for three successive candles (ideally in HTF 4h/Daily). Candle 1 is bullish (strong body), Candle 2 is impulsive (large bullish), and Candle 3 is small and continues up.
The FVG is created when Candle 2 closes far above Candle 1’s high, and Candle 3 doesn’t retrace into that range. Mark the FVG zone with a rectangle, from Candle 1’s high to Candle 3’s low.
Step 2: Wait for price to retrace.
Don’t jump in just because you spotted the FVG. Be patient and wait for the price to come back into the zone, usually within the next 3–10 candles.
Step 3: Look for bullish confirmation inside the FVG.
Examples of confirmation:
- A bullish engulfing candle inside the gap
- A hammer or pin bar rejecting the bottom of the FVG
- A break of structure (BoS) on a lower time frame (LTF)
Sometimes the FVG zone gets broken and price action reverses in the other direction, you must be wary of that fact and monitor the candle inside the FVG zone carefully.
Step 4: Find entry point.
You can enter long on the close of the confirmation candle inside the FVG zone. A good practice is marking a 50% line of the zone for precise entry and confirmation. If the 50% line and the lower line of the zone get broken, strongly reconsider the bias and the confluence you had earlier.
Step 5: Place your stop losses.
Conservative stop: If the price action is pulled back in the zone and continues up outside the FVG box, you can put the stop loss just below the FVG box.
Aggressive stop: For a tight SL, you can put it just below the wick of the confirmation candle in the FVG zone.
Step 6: Set your targets.
For the first target price, you can go for a ratio of 1:2 or 1:3, or set it at the recent swing high at a higher time frame. For the secondary target price, you can use the next resistance level or Fibonacci level, like 1.272 or 1.618.
II. FVG + Bullish Breaker Block Confluence Strategy
This setup works best when a Breaker Block and a Fair Value Gap overlap or sit close together, since the confluence makes it a high-probability reaction zone.
What is a Breaker Block?
A Breaker Block is an invalidated Order Block. When a bearish Order Block gets broken to the upside, it flips into a bullish Breaker Block. When a bullish Order Block gets broken to the downside, it flips into a bearish Breaker Block. These zones often act like flipped support or resistance when price revisits them, making them powerful reaction points.
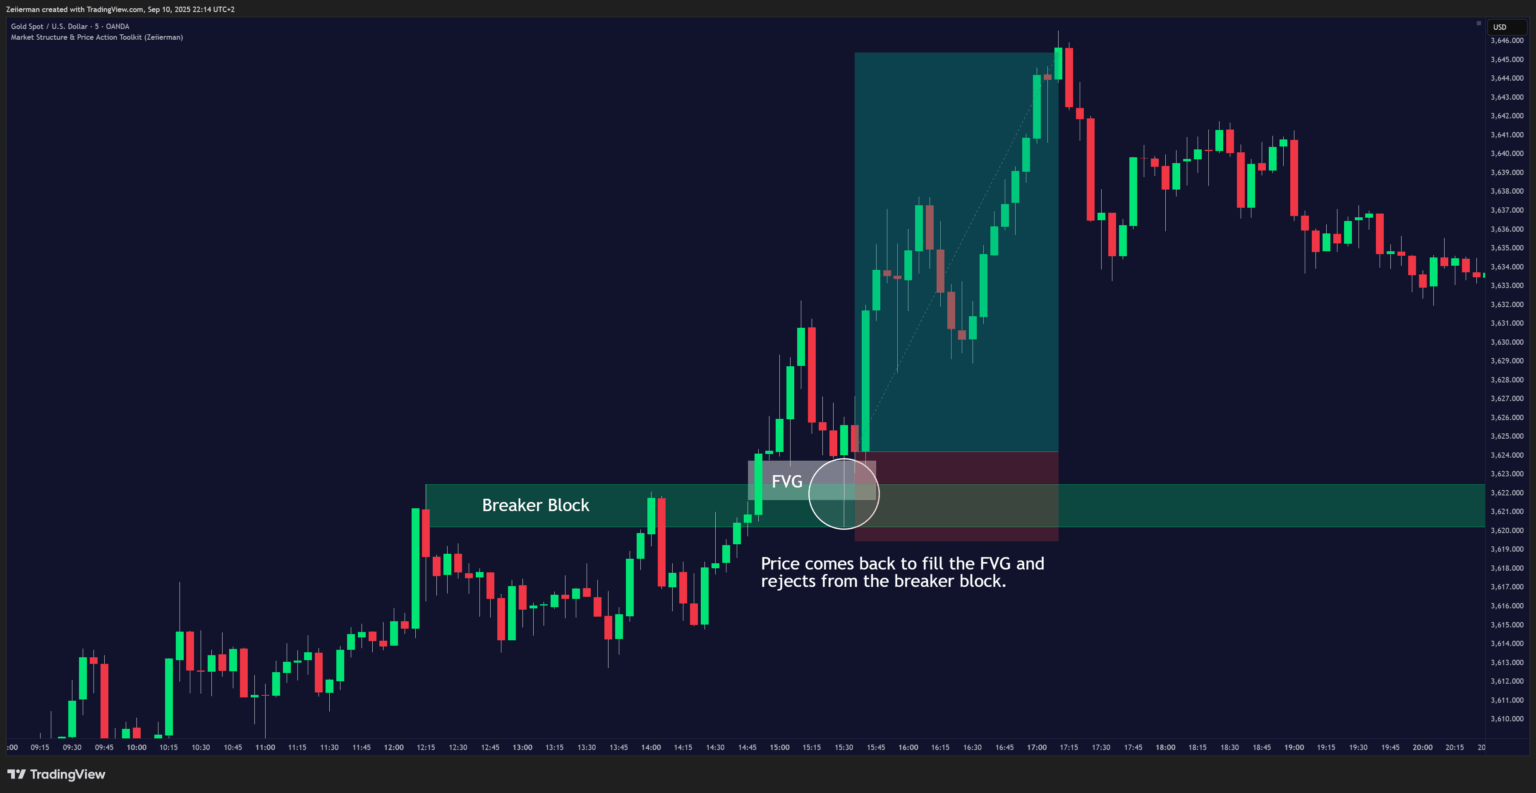
1. Identify the Breaker Block: Look for a prior swing high/low or a failed Order Block that got broken through. Mark this area as your Breaker Block zone. It often flips into support or resistance when the price revisits.
2. Spot the FVG: Locate the 3-candle imbalance (Fair Value Gap) created during the impulsive move that broke structure. This is the skipped price zone left behind by aggressive order flow.
3. Wait for Price to Retrace: Patience is key. Don’t enter right away; instead, wait for the price to retrace into the FVG that sits inside or near the Breaker Block. The closer they overlap, the stronger the setup.
4. Look for Reaction & Confirmation: When price taps the FVG, watch for rejection candles (wicks, strong closes) or a lower-timeframe confirmation like a Break of Structure (BOS) or a clean rejection wick.
5. Enter in the Direction of the Breakout: Once you see confirmation, enter in the direction of the original impulse (long if it was bullish, short if it was bearish).
6. Manage Risk: Place your stop-loss just below the Breaker Block for longs, or just above it for shorts. For take-profit, target the next liquidity pool, market structure level, or recent swing high/low.
Read: How to scalp forex like a pro?5. Frequently Asked Questions (FAQs)
I. What is a Fair Value Gap (FVG) in trading?
To put it simply, A Fair Value Gap (FVG) is a price imbalance left behind when the market moves too quickly for orders to be matched evenly. It forms with three candles: the first sets up, the second creates a strong impulse, and the third continues without overlapping the first. That “skipped” price zone is the gap.
📌 Pro Tip: Traders watch FVGs because price often revisits them later, giving opportunities for entries or exits.
II. Do Fair Value Gaps always get filled?
It is a common misconception. While many Fair Value Gaps eventually get filled, it’s not always the case. Whether a gap fills depends on market context, trend strength, and liquidity. Strong trending markets may leave FVGs unfilled for weeks, while weaker moves are often retraced quickly.
III. What is the difference between a Fair Value Gap and a regular gap?
A regular gap happens between trading sessions. For example, when a stock closes at one price but reopens higher or lower the next day. A Fair Value Gap, in comparison, forms within a session across three candles when aggressive buying or selling skips levels. In short, regular gaps come from market closures, while FVGs come from fast, imbalance-driven moves during live trading.
IV. What timeframes are best for trading Fair Value Gaps?
Fair Value Gaps appear on all timeframes, but higher ones (like the 4H or Daily) tend to be more reliable. On smaller timeframes, gaps form more often but are less significant and prone to false signals. For most traders, FVGs on the 1H, 4H, or Daily provide the best balance between frequency and accuracy.
V. How do you trade a Fair Value Gap step by step?
Trading a Fair Value Gap is simple in concept: first, spot a valid FVG (three-candle imbalance with no overlap). Then, wait for the price to retrace back into the gap. Inside the zone, look for confirmation such as bullish or bearish rejection candles, a break of structure, or strong wicks.
Enter in the direction of the original impulse, set your stop just beyond the gap, and target the next liquidity pool or swing level. The golden rule: don’t trade every FVG you see and focus on the ones backed by trend and context.
VI. What scripts / indicators are best for trading FVGs?
The best indicators for trading FVGs are those that help validate institutional order flow and volume strength. Tools like Volume Delta confirm whether aggressive buying or selling drove the impulse candle, while a Price & Volume Profile highlights whether the skipped levels align with meaningful liquidity zones. Many traders also use Smart Money Concepts indicators (like Zeiierman’s) to combine FVGs with Breaker Blocks, BOS/CHoCH, and liquidity sweeps for higher-probability setups.
VIII. What are the risks of trading Fair Value Gaps?
The main risk with FVGs is treating them as automatic reversal or entry points. Not every gap gets filled, and some only partially fill before the price continues. Low-volume markets, range-bound conditions, or sudden news events can invalidate an FVG setup instantly. The fix is confluence: always confirm with structure, volume, and risk management.
Happy trading!
SM_Trader
SM_Trader is a highly experienced coder and strategy developer who brings the most complex algorithms to life. As a member of MENSA, the prestigious organization for individuals with intelligence scores in the top 2% of the world, he combines exceptional analytical skills with a keen eye for numbers and statistics, empowering businesses to grow at the right pace and in the right direction.
More from SM_Trader