With years of experience in the market, I can tell you that the cryptocurrency market is not for the faint of heart.
And it gets even wilder when you factor in altcoins and memecoins, which are even less stable and heavily manipulated in the market. With the entry of ETFs and other major players, especially in Bitcoin and Ethereum, high volatility is no longer just a risk. It has become the very thing that creates incredible opportunities.
High volatility in crypto means big price swings, both up and down. Many of these moves are driven by retail traders, whales, and nervous traders who pull the trigger on a trend or panic-sell at the first sign of trouble. This creates an environment filled with liquidations and sudden price spikes.
So, how do I deal with this? That’s what you came here for after all. First and foremost, you need a clear strategy to counter the volatility in the crypto market. Come hell or high water – you follow that strategy. Second, you need flexibility within that strategy to adapt to changing markets. Let me show you how this looks in action.
1. Zeiierman’s Crypto Trading Strategy
Let’s review our strategy first, and then we’ll discuss the individual tools, providing you with more context for their use cases. As I said, this will be more of a workflow to get useful data from the market to work on, rather than a rigid strategy.
Step 1: Identify Volatility Shifts
Before anything else, you must first understand the volatility in the current market. For that, I usually use the Adaptive Volatility Scaled Oscillator on TradingView. This script will help determine whether the market is calm and consolidating (low volatility) or if it is already in a high-volatility (trending) state.
If it’s the former, we look for breakouts. If it’s the latter, we reevaluate and decide whether to trade the current trend or let it pass.
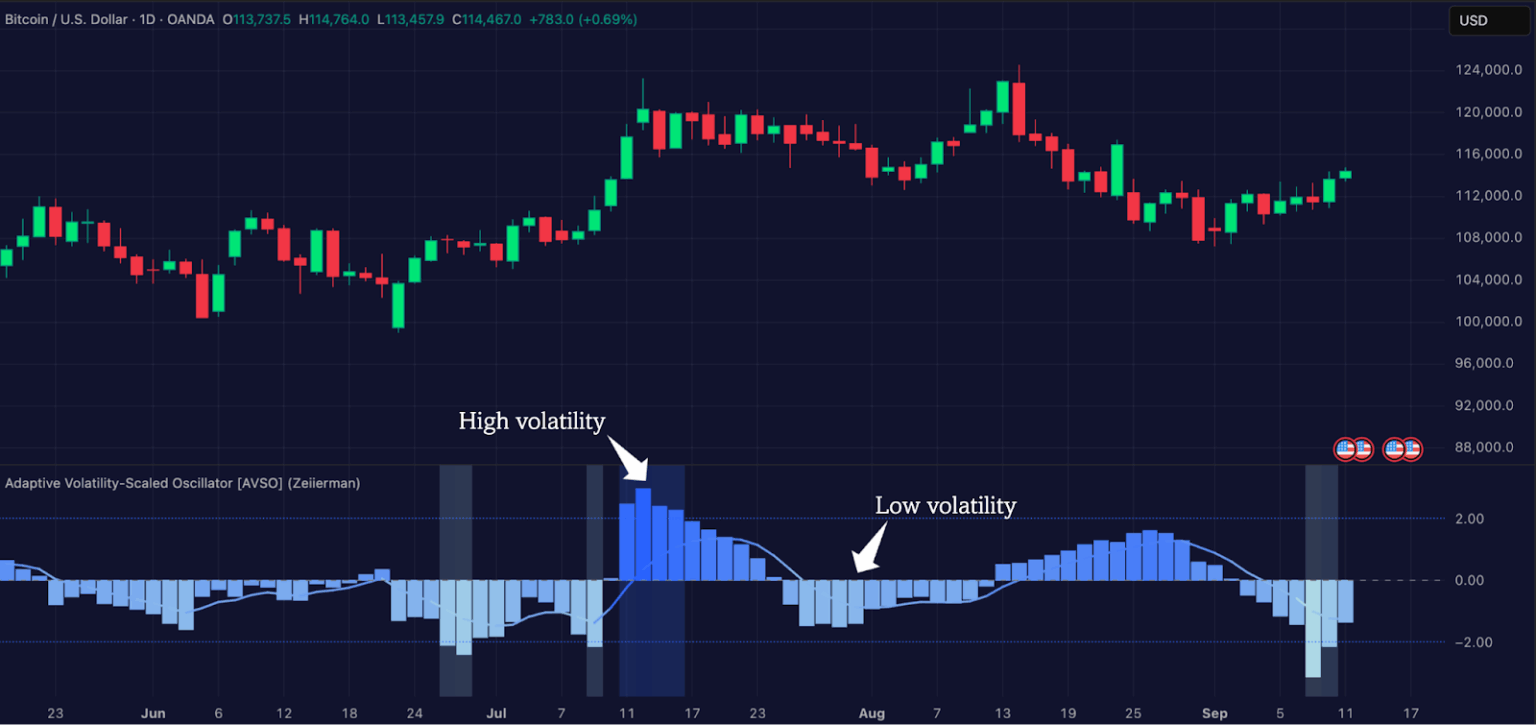
On TradingView, you can start by plotting AVSO on your chart. During consolidation, the oscillator contracts and flattens, typically signaling a calm before the storm. When it starts to expand sharply, it indicates that volatility is on the rise. It matters a lot for crypto because big moves usually begin right after a volatility squeeze.
For example, if Bitcoin has been moving sideways and AVSO suddenly spikes or changes direction, it can be an early sign that the market is going to trend. At this point, you will know some useful moves are coming, and it’s time to be alert.
Read: Why TradingView is Perfect for Beginners in 2025Step 2: Confirm Momentum Direction
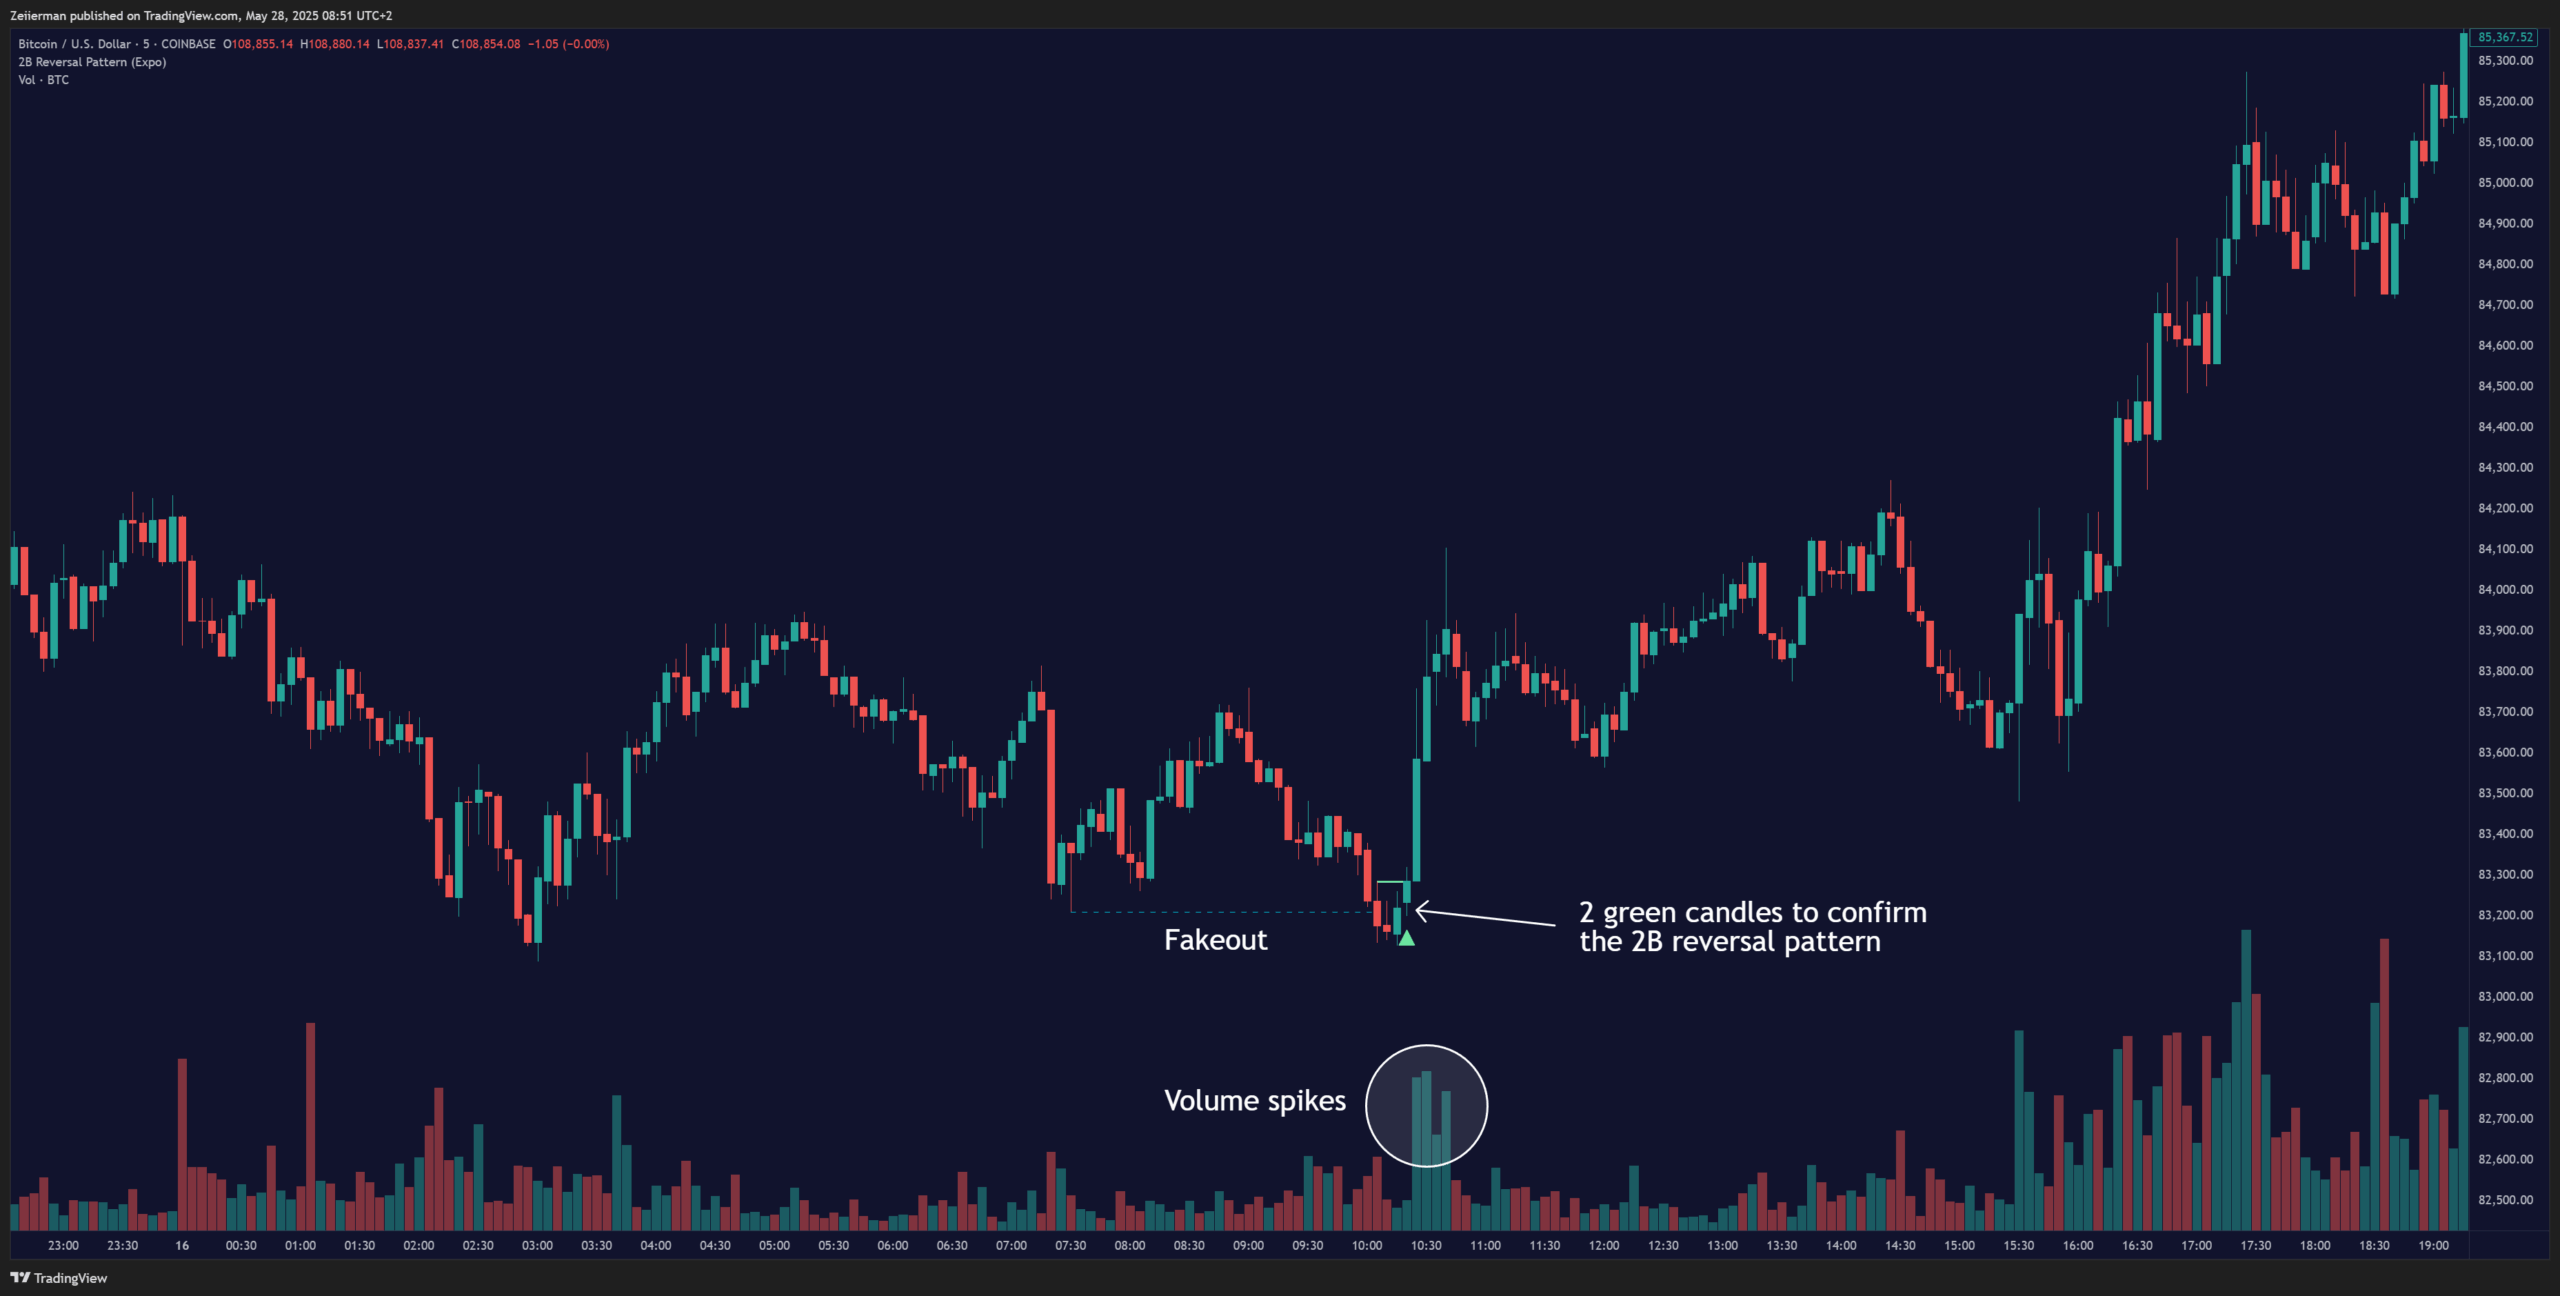
Once AVSO signals that volatility is expanding, the next question is which way it will break. That’s where you use the Parametric Oscillator.
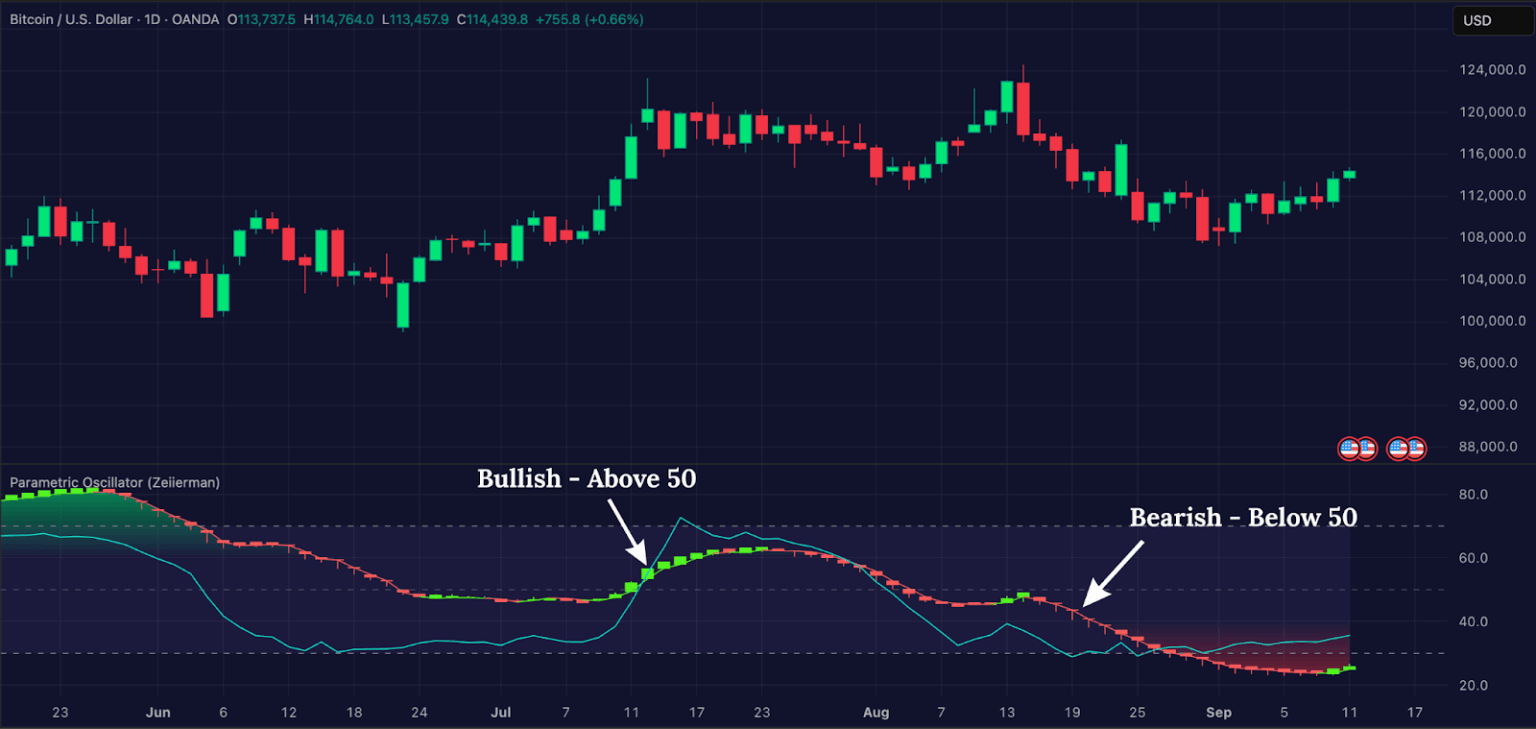
Our Parametric Oscillator will show you that momentum exists, whether it’s bullish or bearish, and highlights divergences if something doesn’t add up. For example, if Bitcoin breaks out above resistance and the Parametric Oscillator shows strong upward momentum (with the candlesticks getting green), you now have confirmation that the volatility expansion is likely upward.
On the other hand, if price spikes but the oscillator shows a bearish divergence, that’s your warning that the move could be short-term or fake. This confirmation step will help you make smart market entries.
Step 3: Filter Liquidity Traps
In my experience, many cryptocurrency traders get burned chasing breakouts straight into liquidity pools. You can use the pair of Liquidation Volume (free) and Liquidity Levels/Zones (premium) indicators to be wary of traps set by whales.
Before entering, check the chart for liquidation clusters. If you see a major pocket of liquidations right above a resistance level, chances are the market will wick into that zone, trigger orders, and then reverse. By identifying these zones ahead of time, you can delay your entry until after the sweep or place your stops beyond the liquidation cluster, rather than inside it.
This step is crucial for cryptocurrency because whales constantly seek liquidity. If you skip this filter, you’ll often be the one getting liquidated, which I know is quite frustrating.
Step 4: Execute the trade
After volatility expansion and momentum confirmation, and once you’ve marked out liquidity on your TradingView chart, it’s time to execute. This is where the Volatility Impulse script will help you.
This premium tool highlights positive and negative volatility directly on your chart. Green bars indicate that bullish volatility is active, while red bars denote bearish control. The beauty of this tool is its simplicity that when the market is ready to move, you get a clear, visual signal of which side has the edge.
Here are some execution rules you can follow:
- Go long when AVSO expands, Parametric confirms bullish momentum, liquidation risk is cleared, and Volatility Impulse shows a green light.
- Go short when AVSO expands, Parametric confirms bearish momentum, liquidation clusters are positioned above price, and Volatility Impulse gives red bars.
Step 5: Risk Management and Exits
No trade is complete without knowing when to get out. Here’s how you manage risk with this setup:
Stop Loss: You can place it just beyond the most recent liquidation cluster. That way, if price sweeps that liquidity, you’re not caught inside the trap.
Take Profit (TP1): Target the next visible liquidity pool. Price will almost always move toward areas of liquidity.
Take Profit (TP2): Let the trade ride with a trailing stop as long as the Volatility Impulse stays in your favor. The moment it changes color, you should exit, because it’s a sign that momentum is drying up.
This dynamic exit strategy means you’re locking in profits at logical levels while still leaving room to ride the big crypto trends.
2. What indicators should you use in crypto?
Alright, you have my golden goose strategy now. But I don’t want you to follow it blindly. I always teach our students in Zeiierman Mentorship to actively take in advice from experienced traders and mould it into their own strategy.
To do that, we’ll review the indicators I am using in the strategy. We have dozens of indicators, many of which can replace these in your version of the crypto trading plan.
A. Parametric Oscillator (Expo)
It is a dynamic momentum script that can help you spot early market moves and potential trend reversals. This oscillator is built on the concept of exponential moving averages (EMA), but instead of simply plotting them as lines, it transforms the relationship into a percentage-based oscillator. This change makes the oscillator more adaptable to different price conditions than static indicators like RSI or MACD.
TRY: Zeiierman’s Parametric Oscillator on TradingViewYou can adjust the price source or enter your custom inputs. The indicator can be personalized to suit short-term setups on lower timeframes or longer swing positions on higher timeframes. The Parametric Oscillator REALLY pulls its weight in crypto due to higher volatility. Traditional oscillators often lag during fast price action moves. In contrast, the parametric design adapts better to this, giving traders a faster signal without drowning them in false noise.
In our experience, it works even better when paired with tools like the Cumulative Delta, which confirm the strength or weakness of momentum. For a trader who wants to catch momentum early but also protect against sudden volatility, this oscillator becomes a valuable weapon in the bag.
B. Adaptive Volatility-Scaled Oscillator (AVSO)
The cryptocurrency market is famous for fluctuating between flat, quiet ranges and explosive breakouts. The AVSO indicator is designed to detect exactly those shifts by measuring volatility in a more sophisticated manner than standard ATR or Bollinger Bands. It uses various metrics (such as volume, price changes, standard deviation, ATR, and Yang-Zhang volatility) to identify market conditions in which volatility deviates from normal.
TRY: Zeiierman’s Adaptive Volatility-Scaled Oscillator on TradingViewTo maintain sharp signals, the indicator also employs adaptive smoothing of the average price, where the Exponential Moving Average (EMA) adjusts its value based on current price movements. This responsiveness enables the oscillator to expand rapidly during periods of high volatility and contract when the market calms down.
When combined with momentum tools like the Parametric Oscillator or breakout filters like the Volatility Impulse, it becomes a complete volatility-momentum system. In a market as explosive as crypto, knowing when volatility is about to expand can be the difference between catching a trend and getting FOMO when it’s too late.
C. Liquidation Volume
Liquidation Volume is another powerful tool from our TradingView toolkit, focusing on one of the most defining features of cryptocurrency markets: leveraged trading.
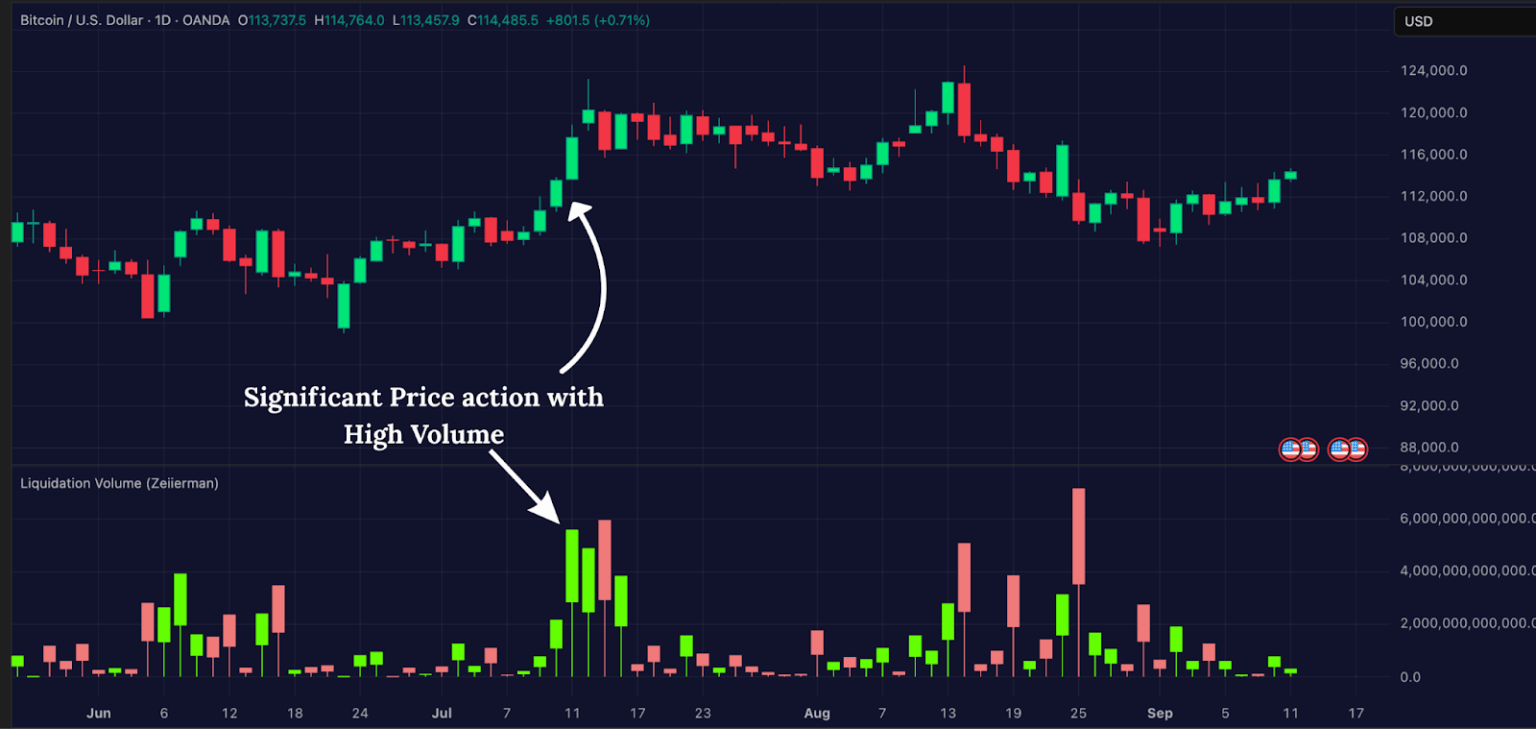
Most players in the cryptocurrency market trade with high leverage, so sudden liquidations are quite common. Price often runs directly into areas where stop-losses and liquidation clusters are present, which triggers many forced orders that create quick spikes or crashes. The Liquidation Volume indicator helps traders see where these moments may happen.
This indicator indicates where long or short liquidations may occur within the selected timeframe. The spikes typically indicate zones where liquidity is concentrated, which are precisely the areas the market tends to target. For example, if you notice liquidation clusters just below a recent swing low, chances are that price may drive into that level before reversing. By observing liquidation activity, you can anticipate the market’s most probable path.
TRY: Zeiierman’s Liquidation Volume on TradingViewWhat makes this indicator practical is that it turns chaotic liquidation events into actionable information. So, instead of being surprised by sudden spikes, you can recognise where those spikes are likely to form. It allows you to place stops more effectively beyond the zones where liquidations will occur, or even plan your move after a sweep has played out.
In a market where whales and algorithms hunt for liquidity, having a live map of liquidation activity gives retail traders an edge.
3. Why indicators matter more in crypto?
I know I’m not the most unbiased voice on TradingView indicators. But hear me out for a sec.
Unlike stocks, which are backed by a company’s financial performance, cryptocurrencies often lack intrinsic value, making technical analysis and indicators crucial for understanding market sentiment and momentum. Indicators matter more in crypto because they provide a data-driven way to navigate the market’s extreme volatility.
For example, a volatility-focused indicator like Bollinger Bands can help you identify when a cryptocurrency’s price is poised for a significant move. When the bands contract into a squeeze, it often signals low volatility, which usually occurs before a breakout.
Similarly, a momentum indicator like the Relative Strength Index (RSI) can help you spot when the chart is showing overbought or oversold and suggest a possible price reversal. A wild market like crypto is literally defined by its volatility and momentum, so it becomes crucial to use the right indicators to navigate this market.
Without these tools, trading in such a wild market would be purely based on gut feelings, and emotion can be an absolute disaster. Indicators provide a structured framework for traders to make rational, data-driven decisions. Ultimately, while indicators can be used in any market, they are absolutely essential in cryptocurrency markets.
To succeed or survive in crypto, you need to adapt to its core features, such as extreme volatility, rapid momentum shifts, and the hunt by whales for liquidity. By using a workflow that combines tools like our powerful indicator, you’re not just trading but also getting a high-level analysis of the market.
Happy Trading 😉
Zeiierman
With over 16 years in the market, Zeiierman has extensive experience as a full-time trader and risk advisory consultant for hedge funds. He has developed many profitable trading strategies, drawing on his background in risk management and strategy execution.
More from Zeiierman