Works on the Following Platforms
TradingView
For use on the TradingView platform
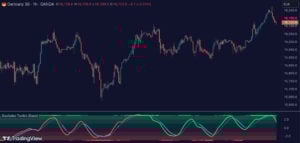
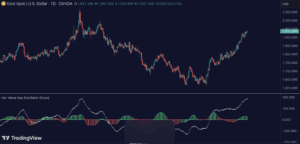
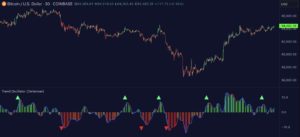
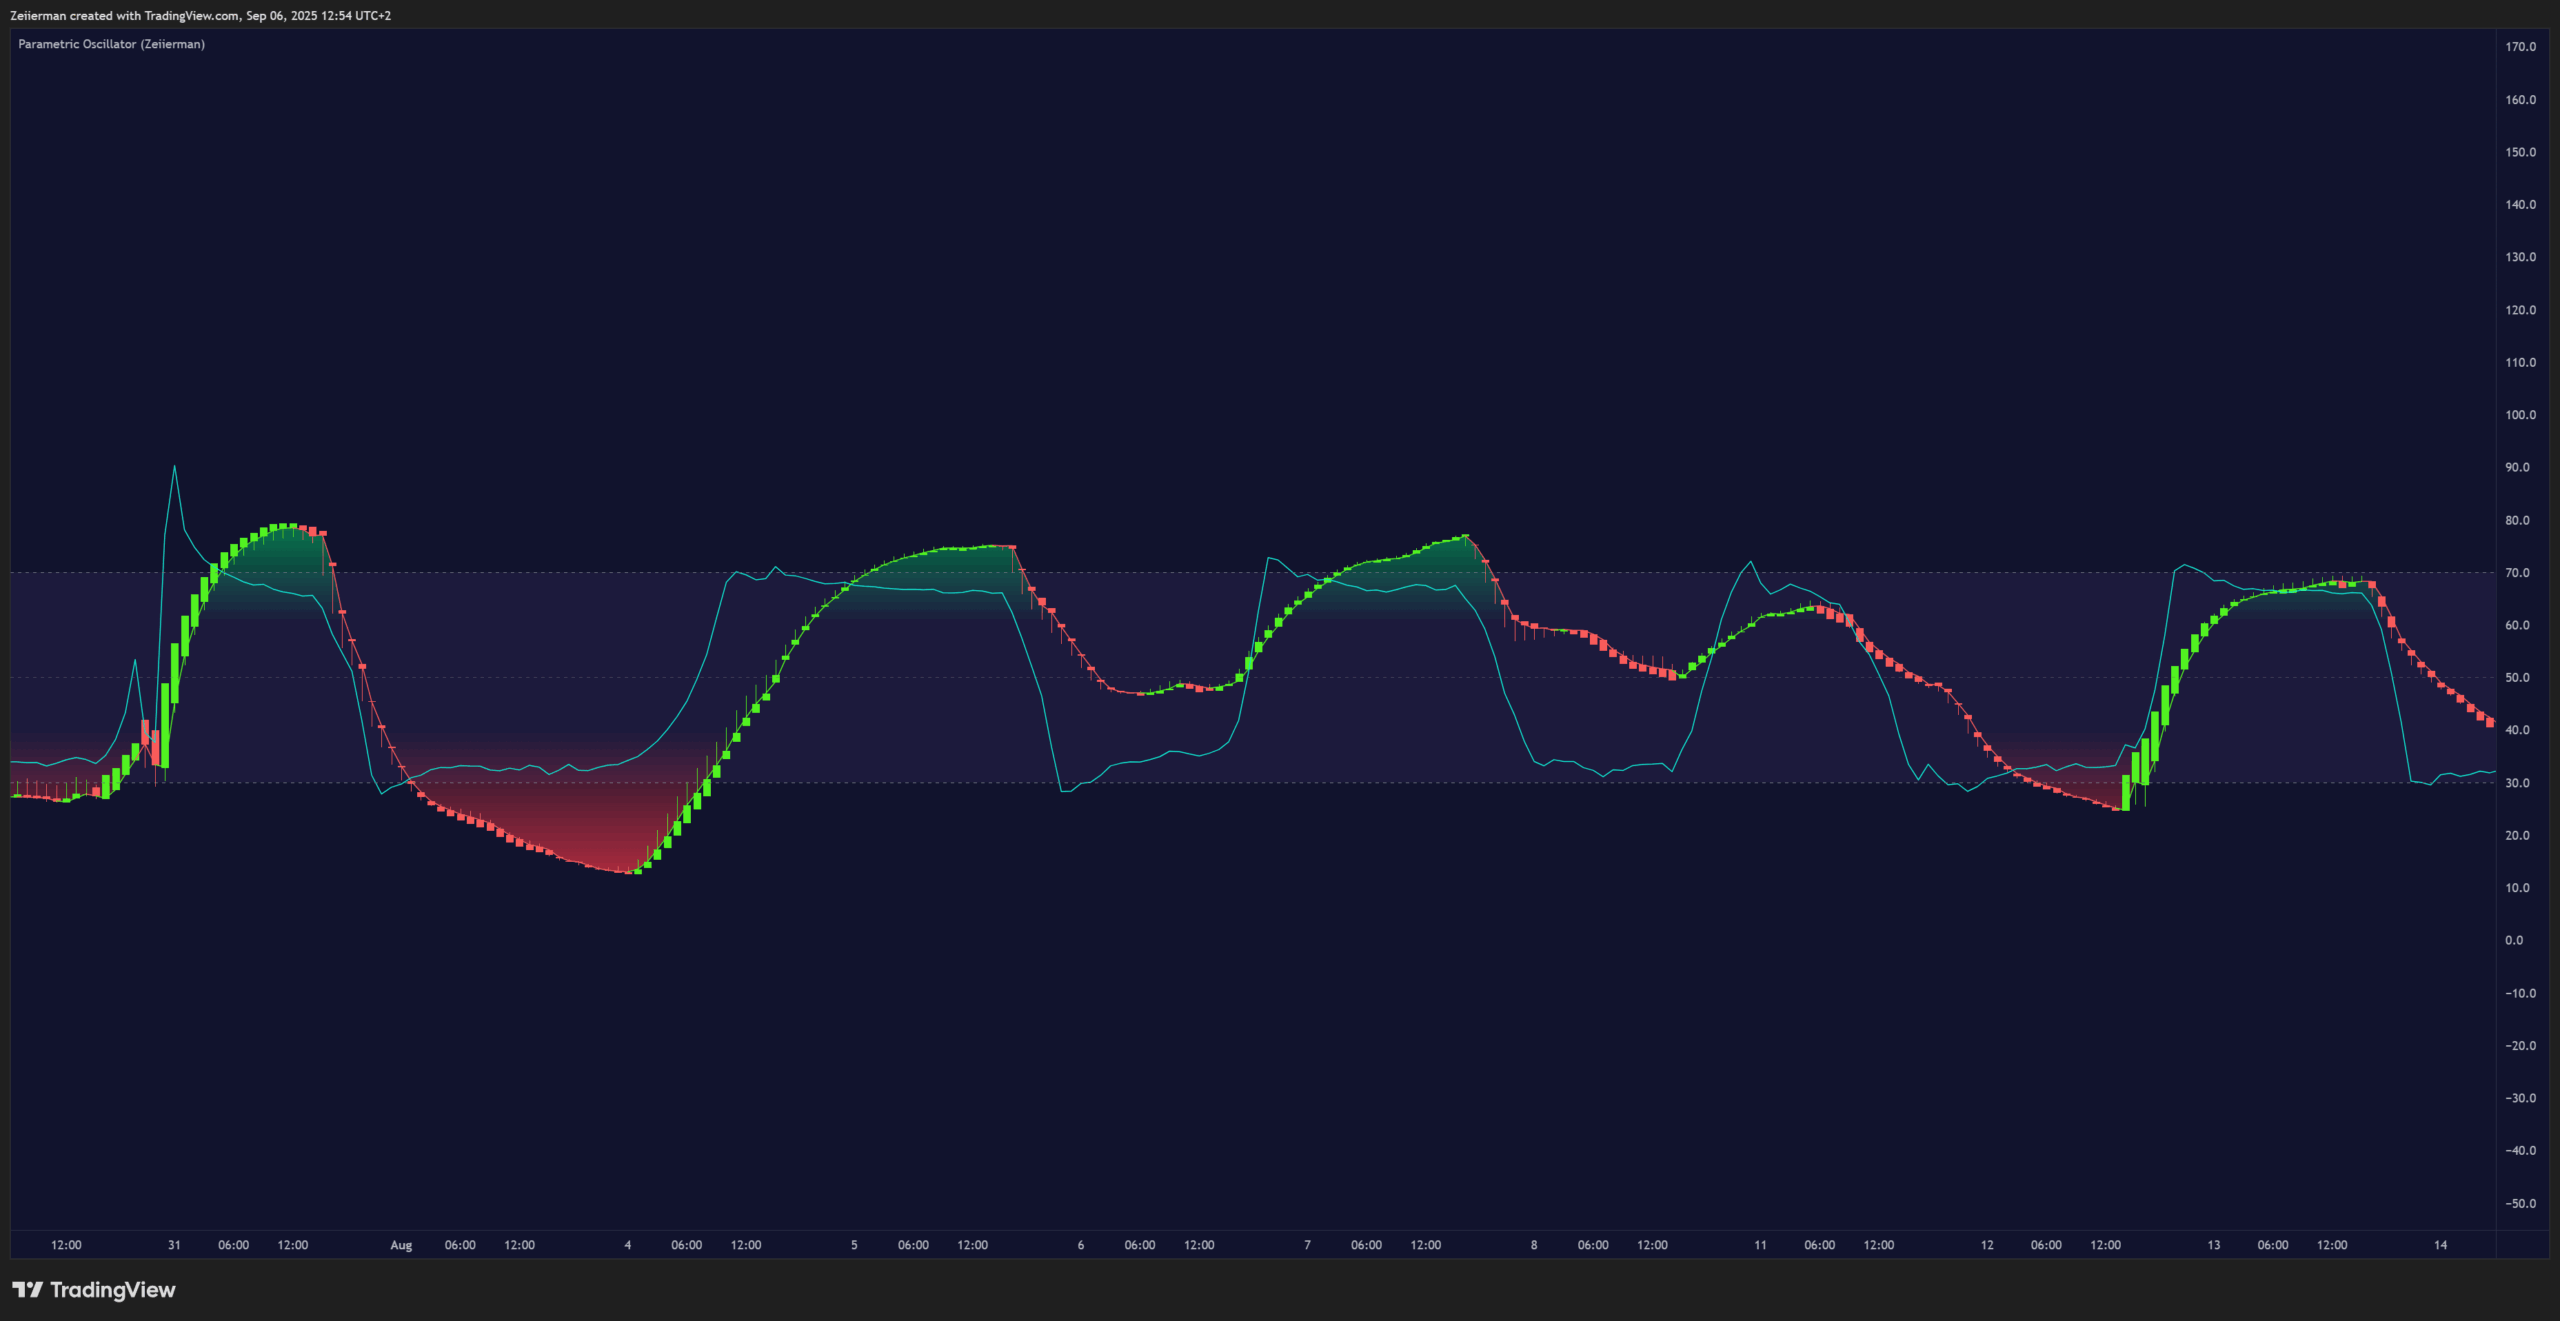
The Parametric Oscillator (Zeiierman) transforms price movement into a flowing wave of momentum candles wrapped around a smooth Quick Line. The candles flip green or red to show shifts in pressure, while the line tracks the underlying strength on a 0–100 scale. Together, they make it easy to spot momentum swings, stretched zones, and trend direction.
What Is Parametric Momentum?
Parametric momentum is a way of looking at how price strength expands and contracts in repeating waves. Instead of treating momentum as a fixed reading, it adapts to the speed, length, and intensity of moves — showing whether pressure is accelerating, slowing, or reversing.
Where traditional oscillators often give a single curve, parametric momentum builds a dynamic wave structure, visualized as candles that flip color when buying or selling pressure takes over. This makes it easier to see the ebb and flow of markets, spot when a trend is stretching too far, and anticipate when the next swing may begin.
How to Trade with Parametric Oscillator
Trend following
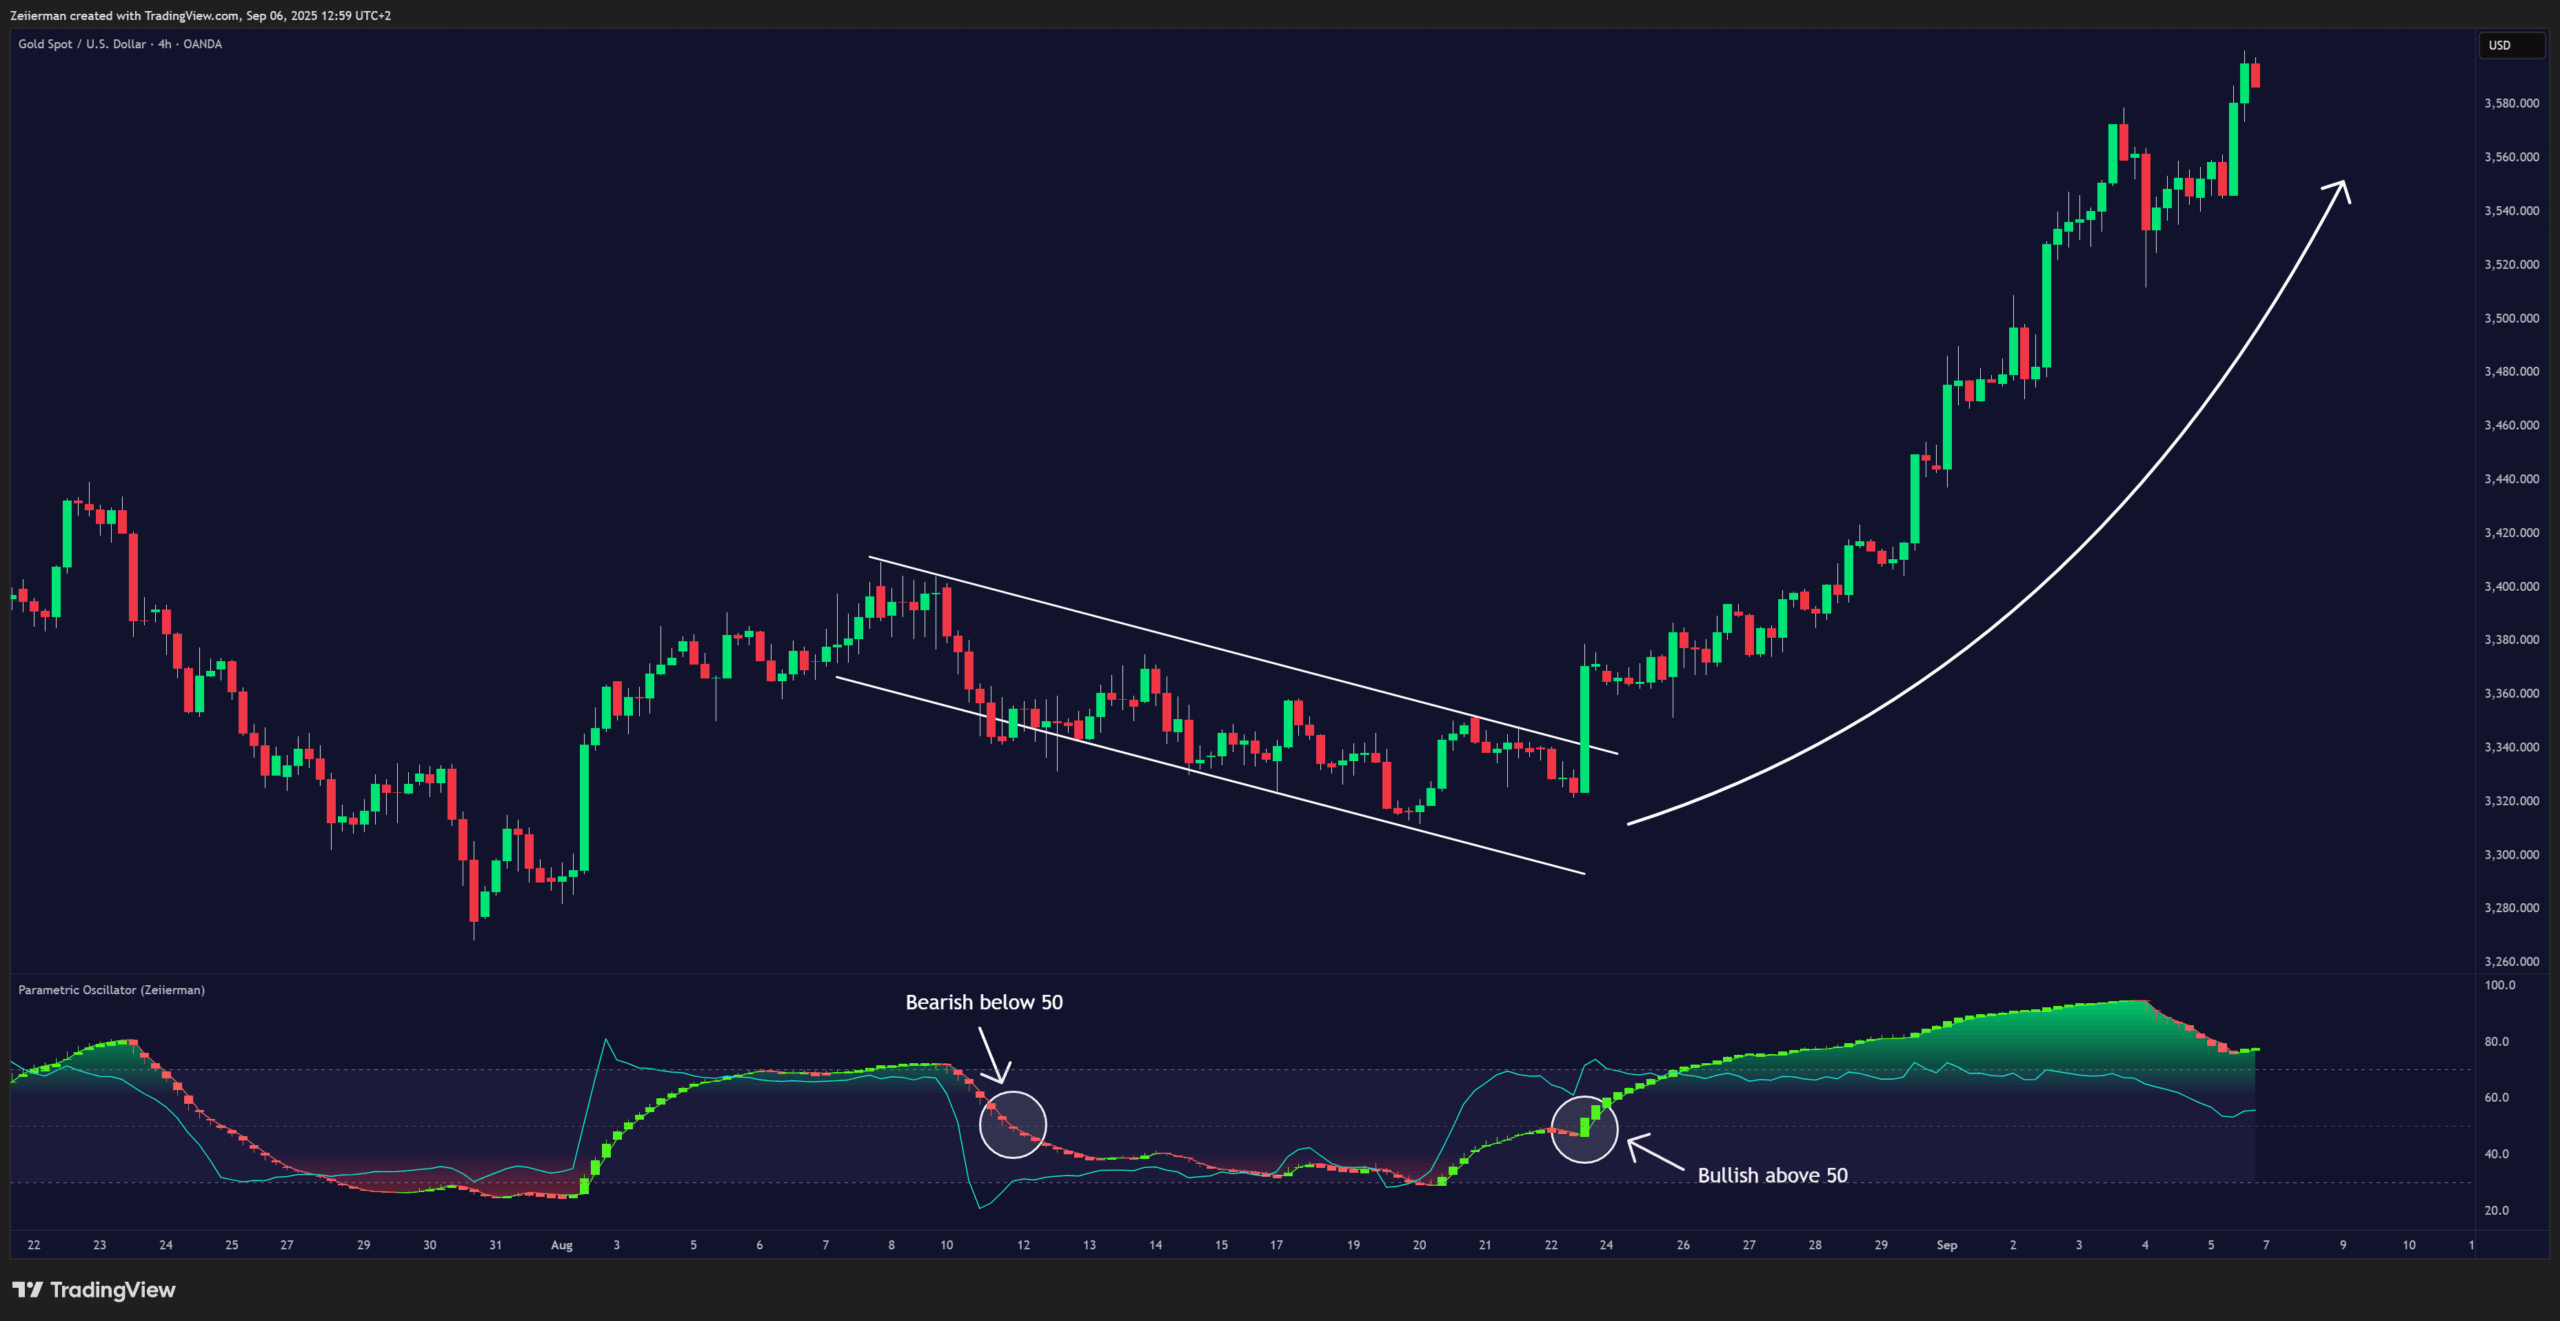
- Bullish bias when the momentum candles Line holds >50 and momentum candles form higher lows.
- Bearish bias when it holds <50 and candles form lower highs.
Detect Leading Momentum
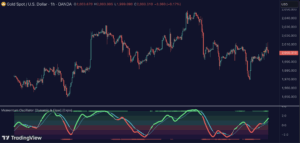
The Quick Price Line helps traders spot leading momentum moves that pave the way for the following price action. This can signal either the start of a new move in that direction or the beginning of a reversal. By watching how the momentum candles behave, we can understand whether it’s a continuation or a reversal move.
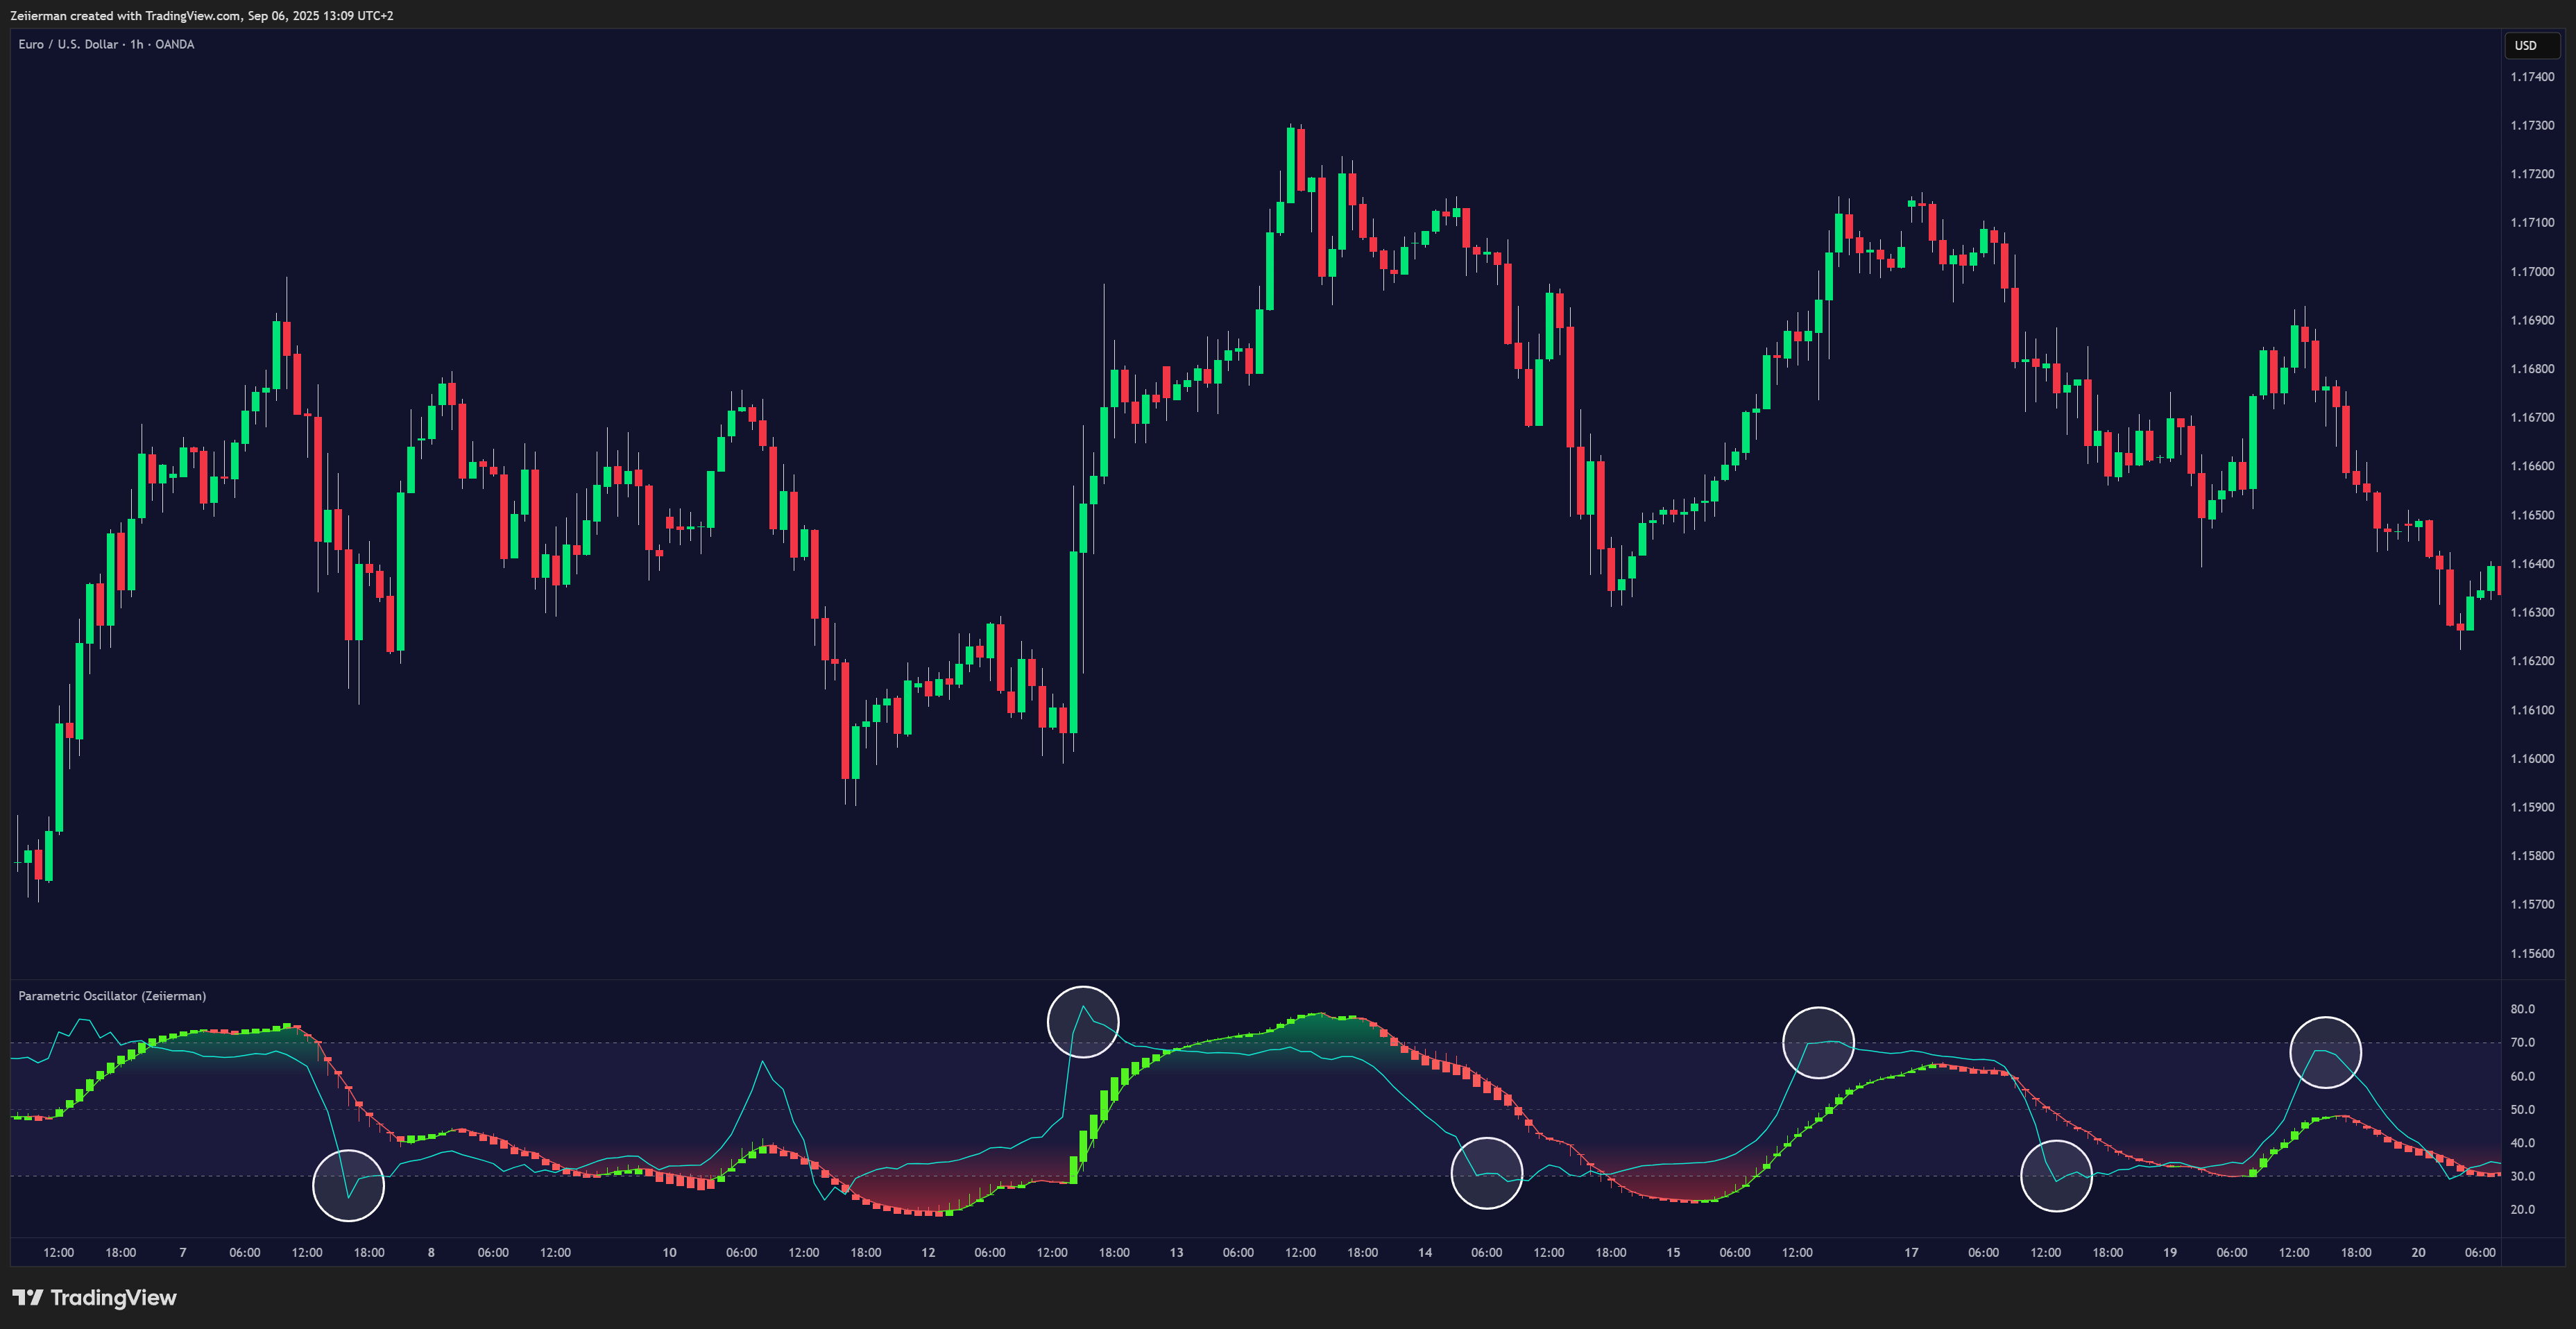
- When the Quick Line peaks above 80, it’s a sign of strong positive momentum.
- When the Quick Line peaks below 30, it’s a sign of strong negative momentum.
Fading Price Moves
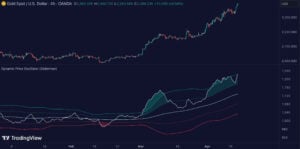
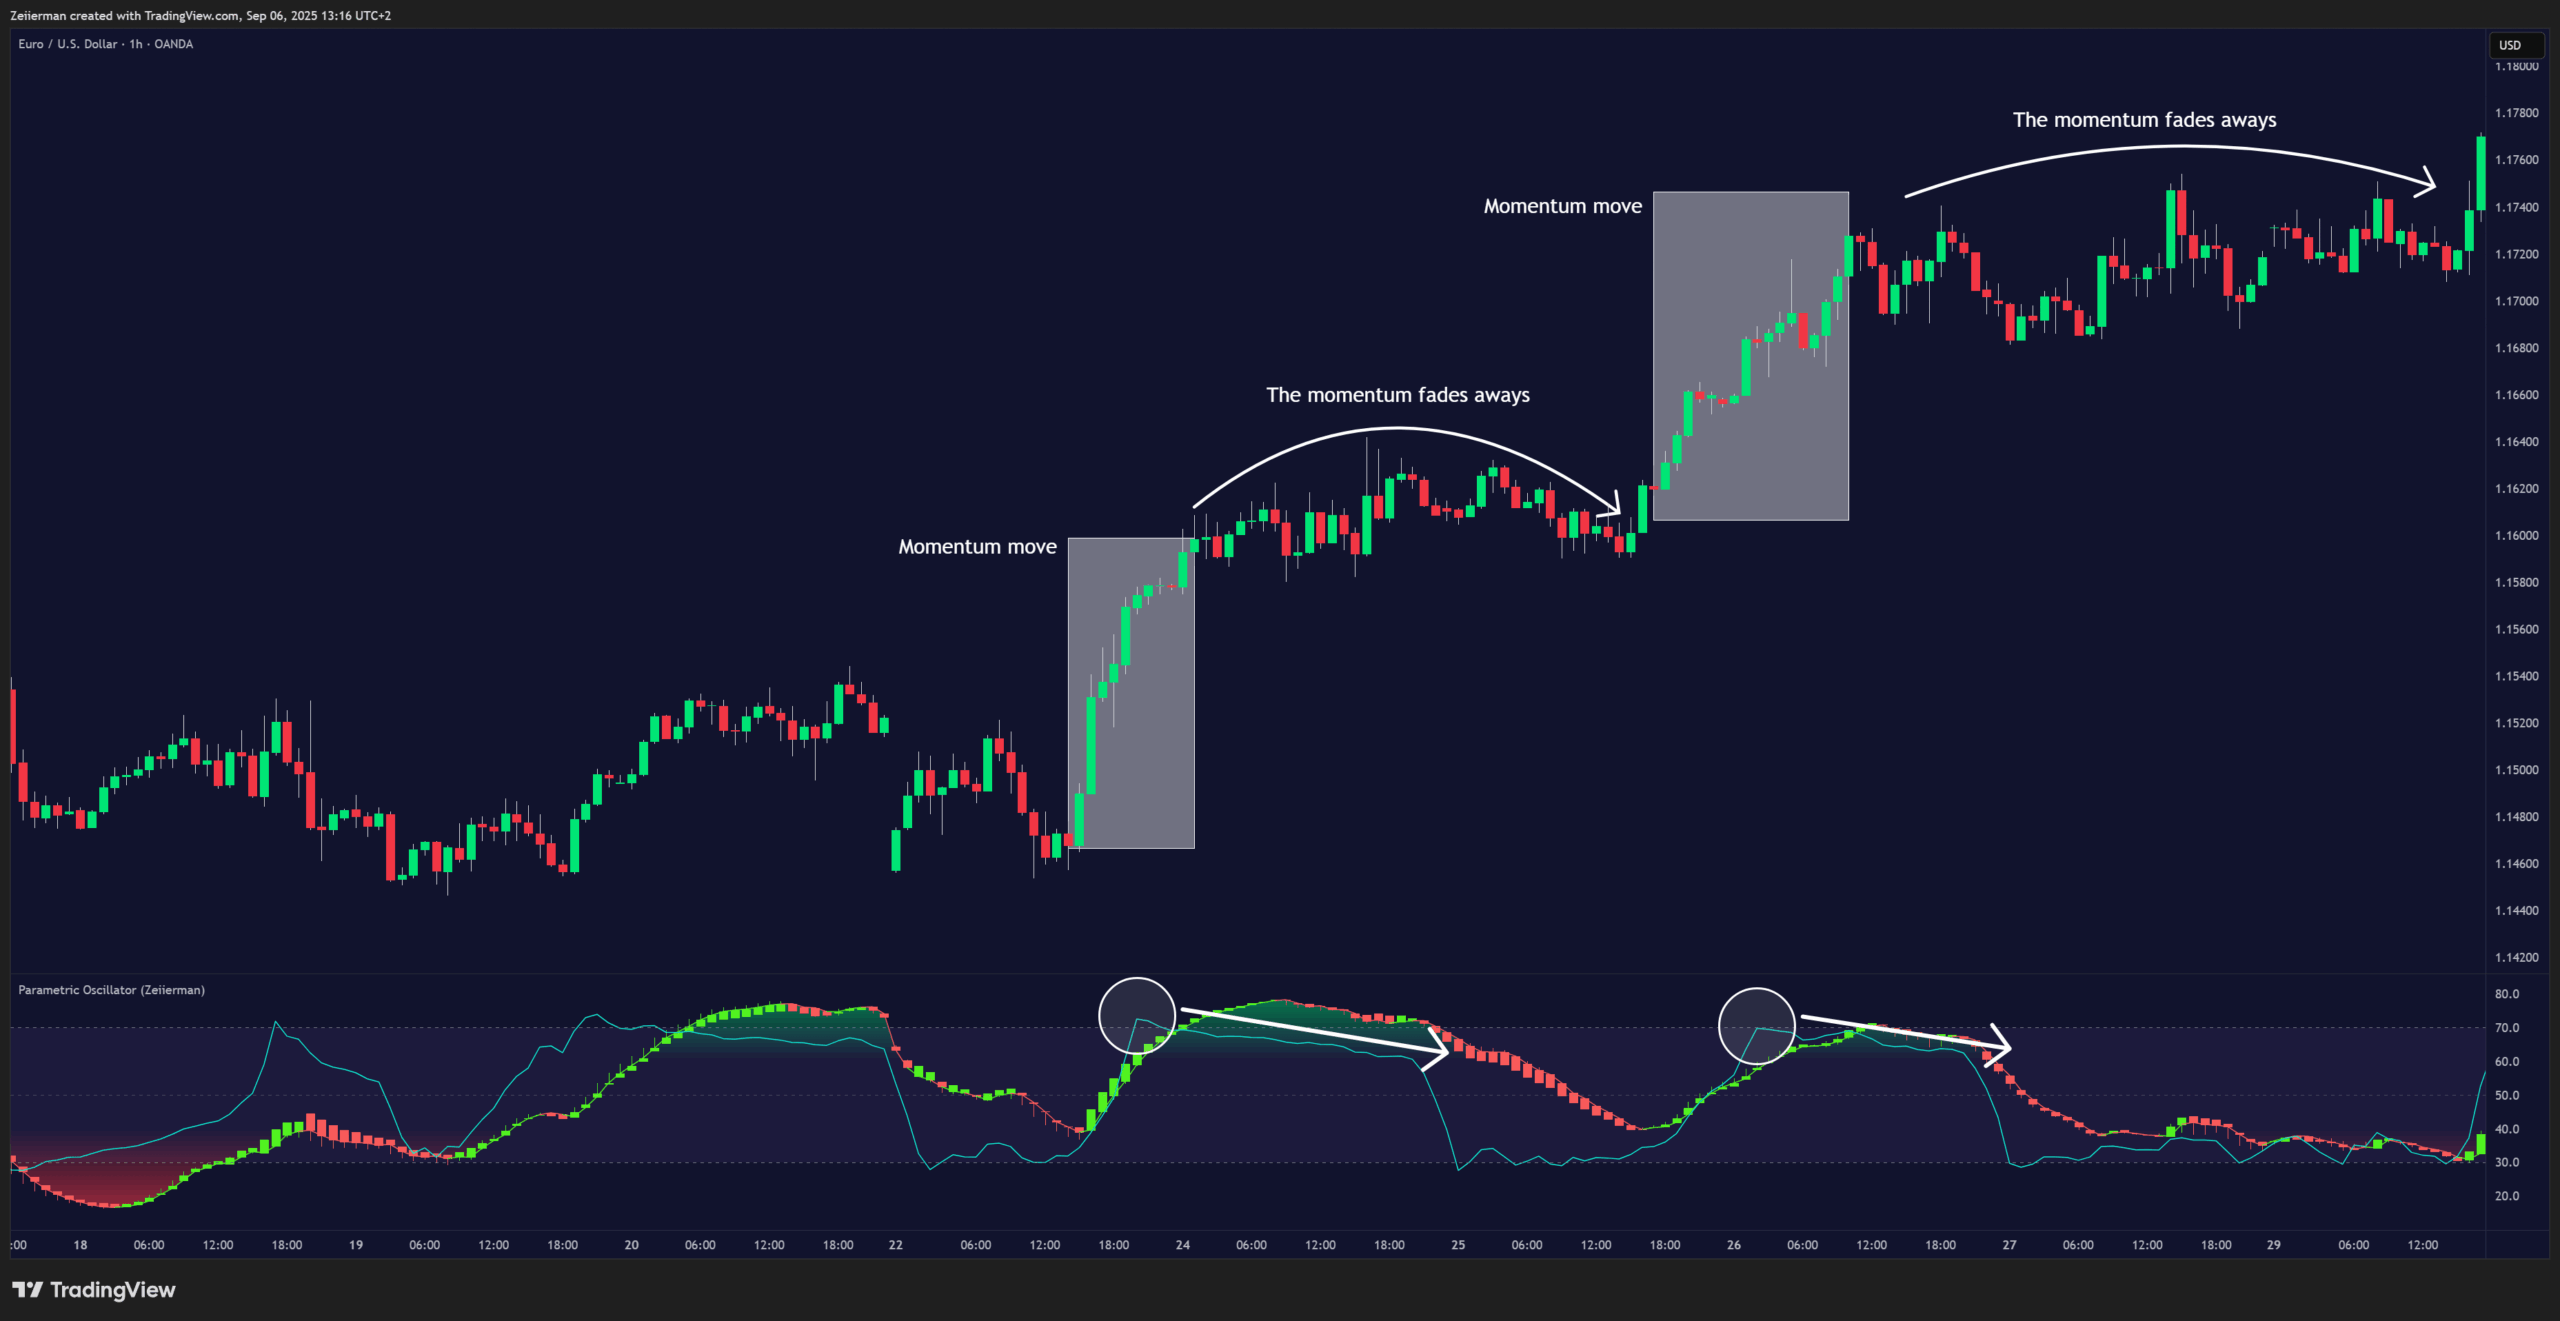
Momentum drives price to new highs and lows, but if that momentum starts to fade, a reversal may follow. The Quick Price Line helps us see fading momentum long before price actually reacts, giving us a chance to stay ahead of the market.
If the Quick Line peaks and then begins to slowly decline, that’s a sign momentum is weakening. This often leads to a temporary pause or price congestion, and sometimes even a full reversal.
Parametric Oscillator – Simple Pullback Strategy
Goal: Buy pullbacks in uptrends / sell rallies in downtrends
This strategy aims to capture pullbacks within established trends. Since trends can emerge in any timeframe and any market, the same approach can be applied universally across different trading styles.
Indicators needed:
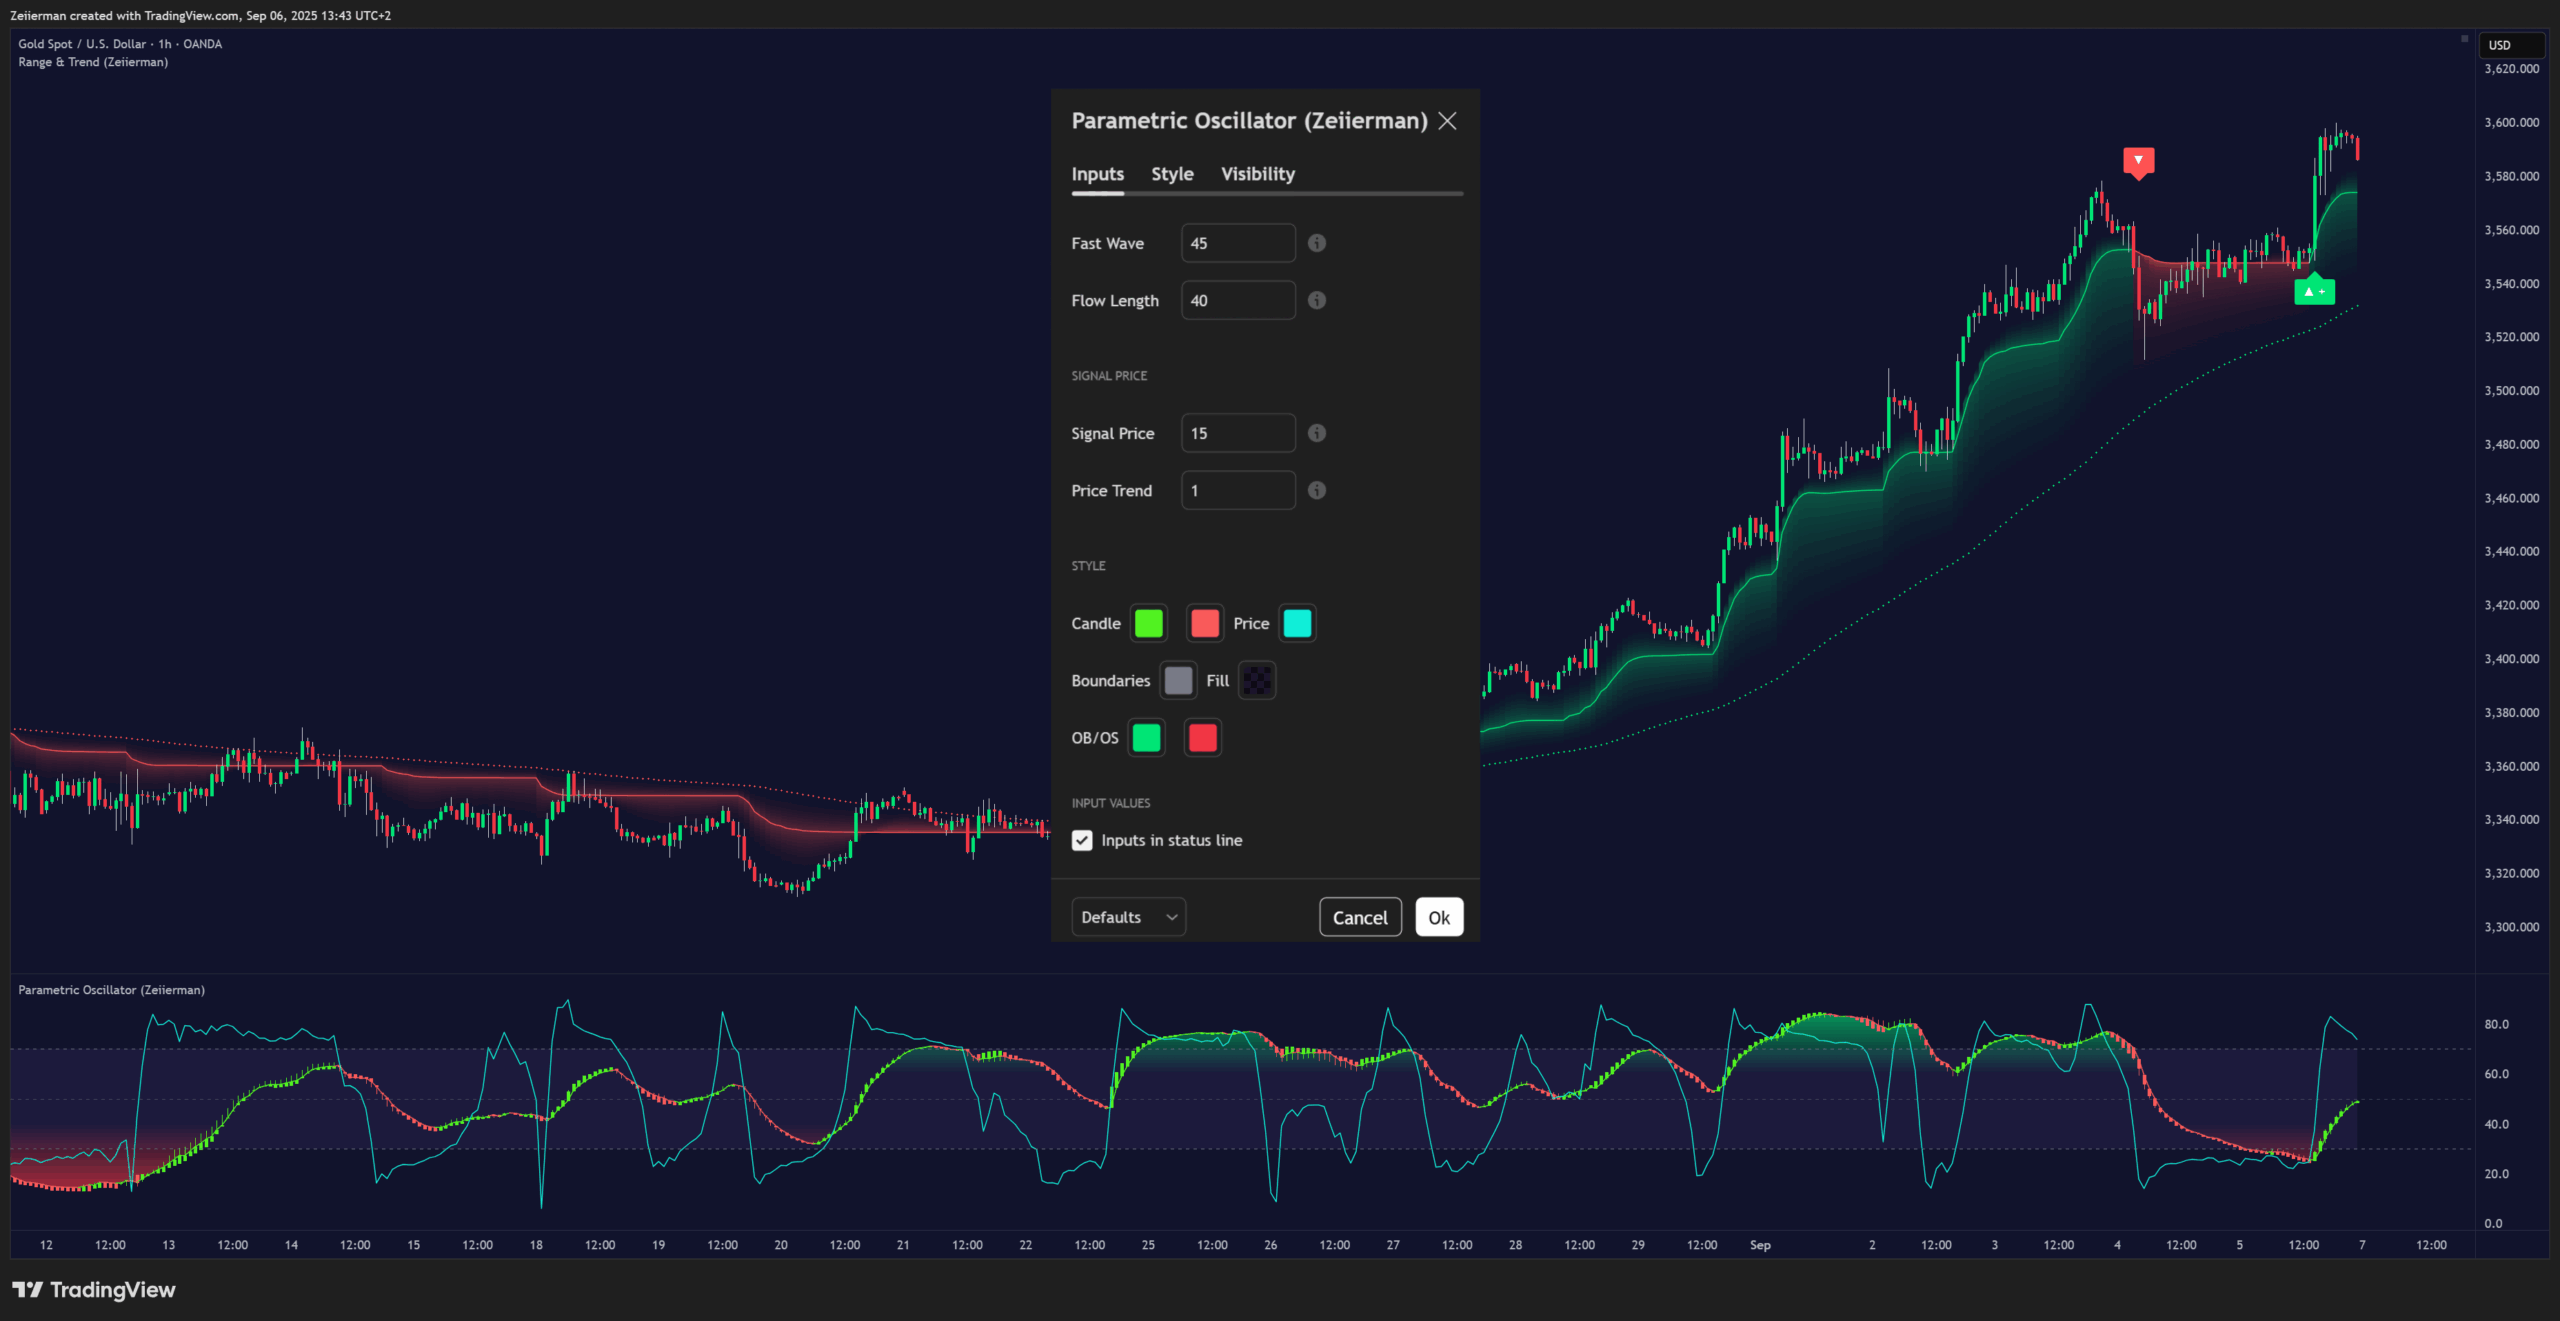
Range & Trend (Zeiierman) – Default settings as we only gonna use the trend line as a confirmatuion of the underlying trend.
Parametric Oscailltor – I like to set the Fast Wave to 45, Flow lenght to 40 and Signals price to 15 and price trend to 1. These settings helps us find great pullbacks entries in trends
Long Setup (step-by-step)
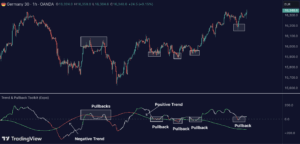
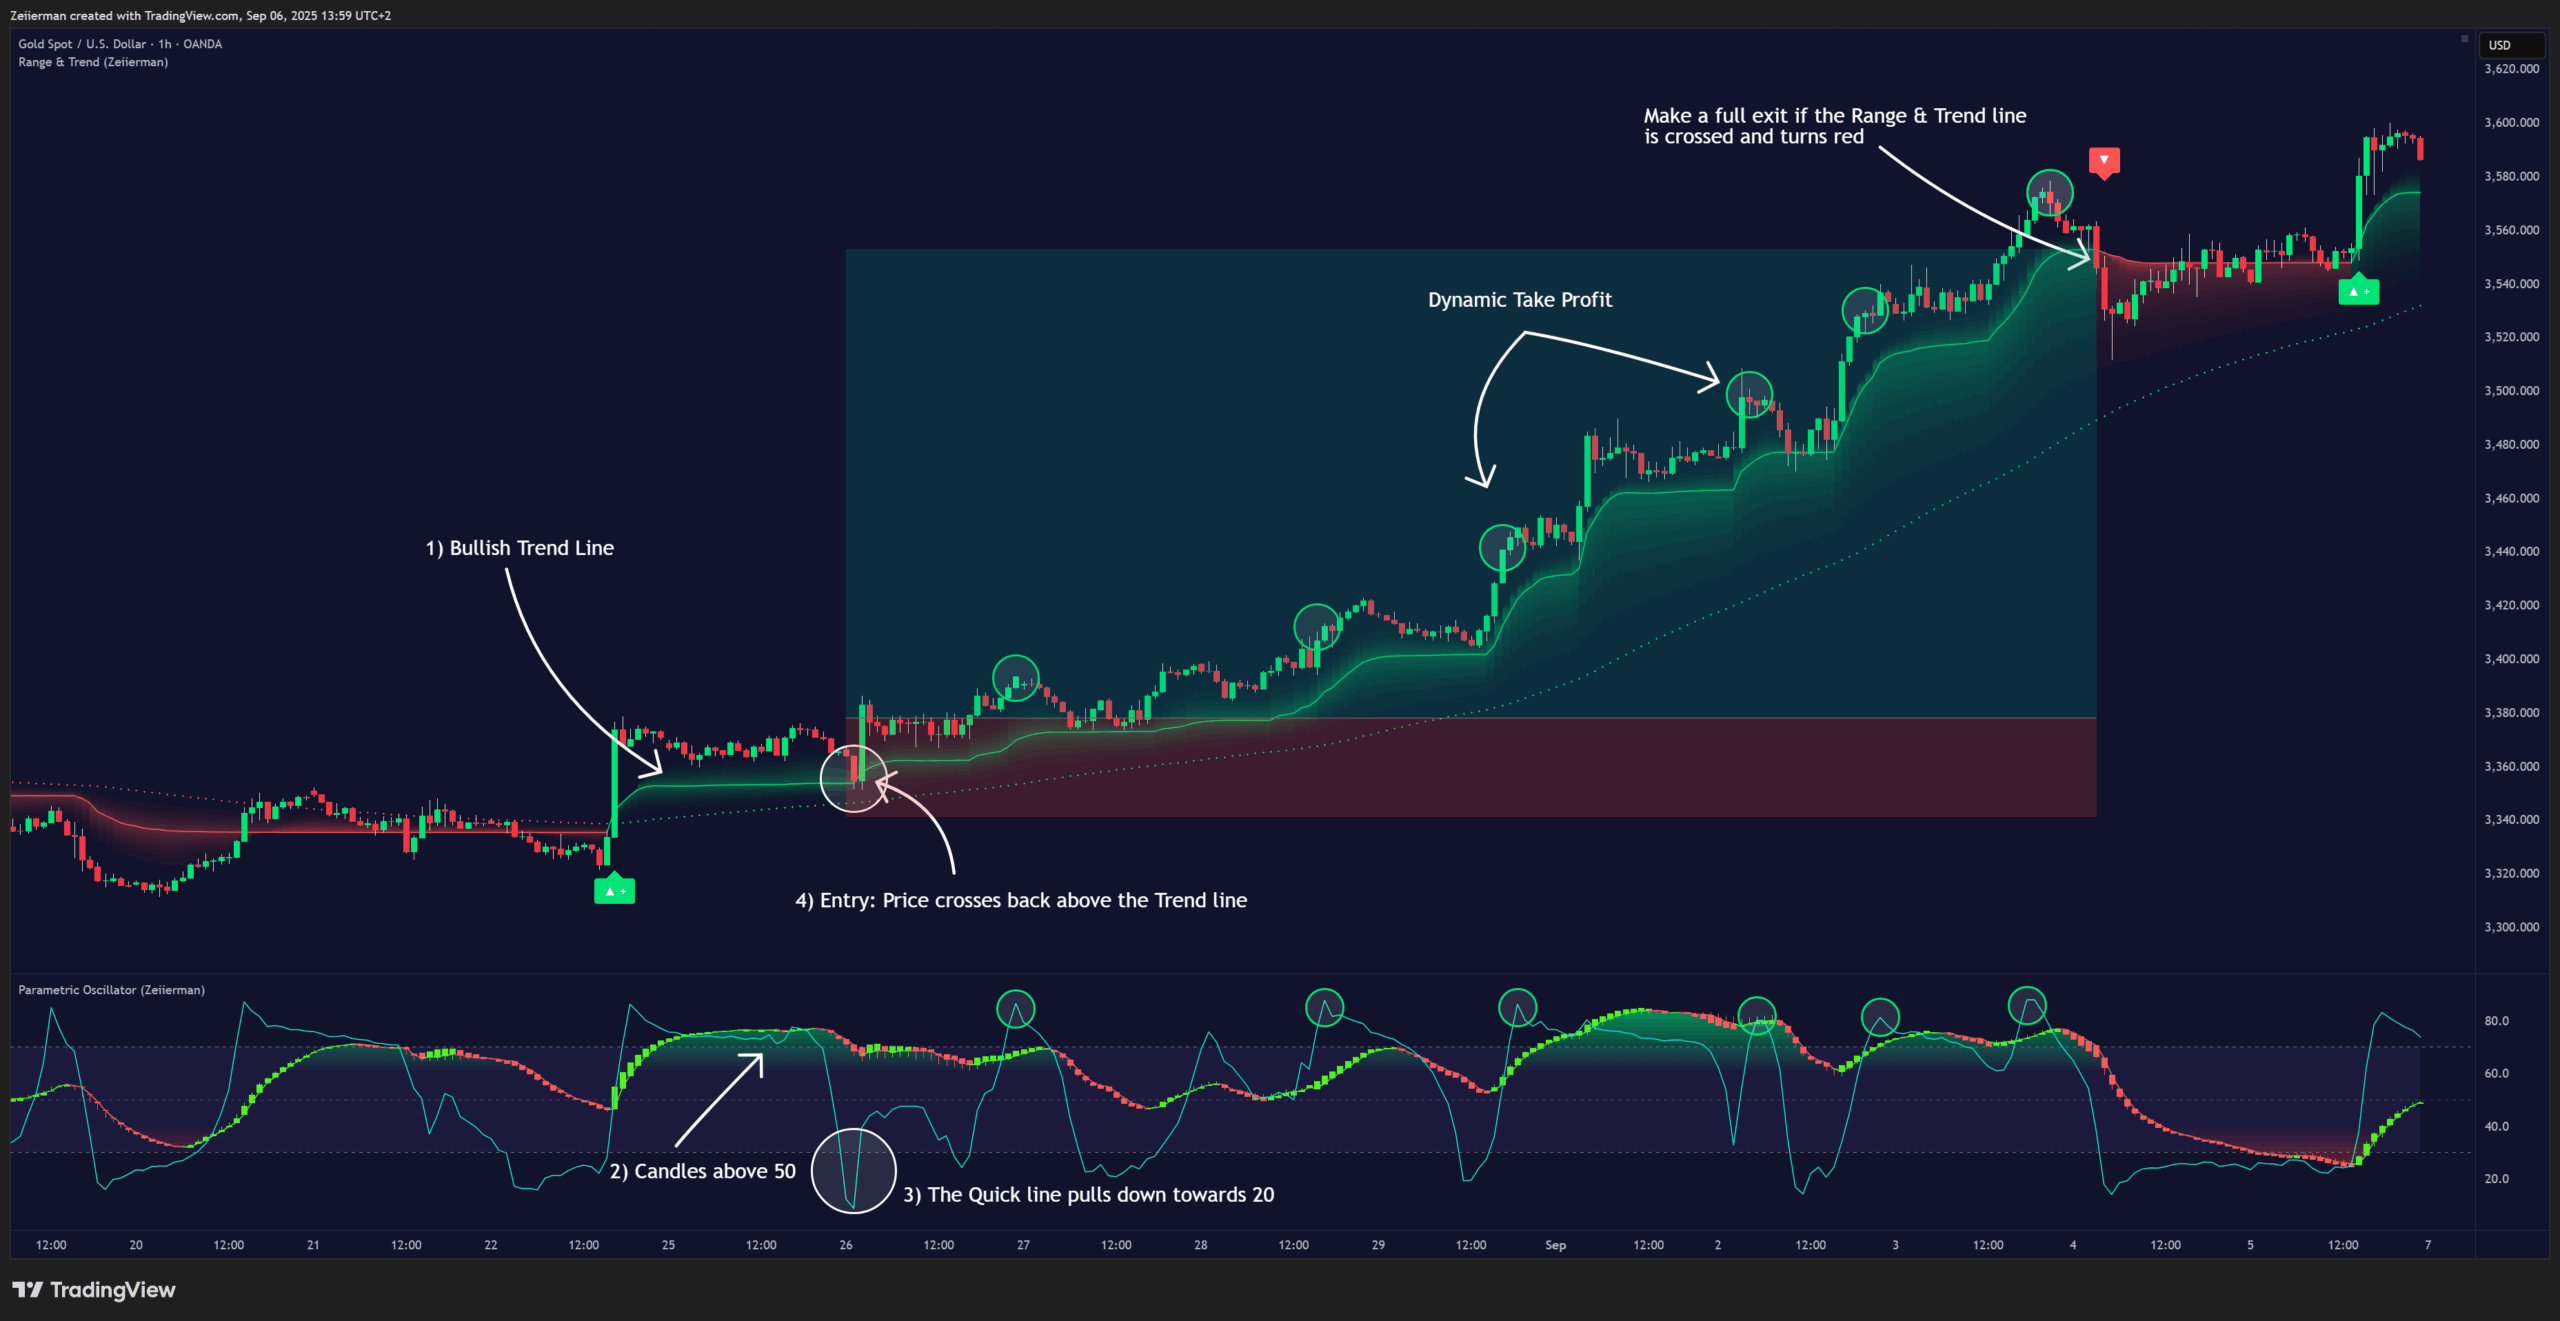
Trend: Range & Trend is bullish, indicated by the trend line. Momentum candles in the Parametric Oscillator are clearly above the 50 line. These two conditions define the trend.
Pullback: The Quick Price Line pulls down toward 20. This shows a negative momentum move within the established trend.
Trigger: Price touches or crosses the Range & Trend line.
Entry: The very next bar that closes above the Range & Trend line gives us confirmation for entry.
Stop: Place below the Range & Trend line to keep risk-to-reward intact.
Take Profit:
- Use dynamic take-profits: whenever the Quick Price Line peaks up, you can scale out.
- Make a full exit if the Range & Trend line is crossed and turns red.
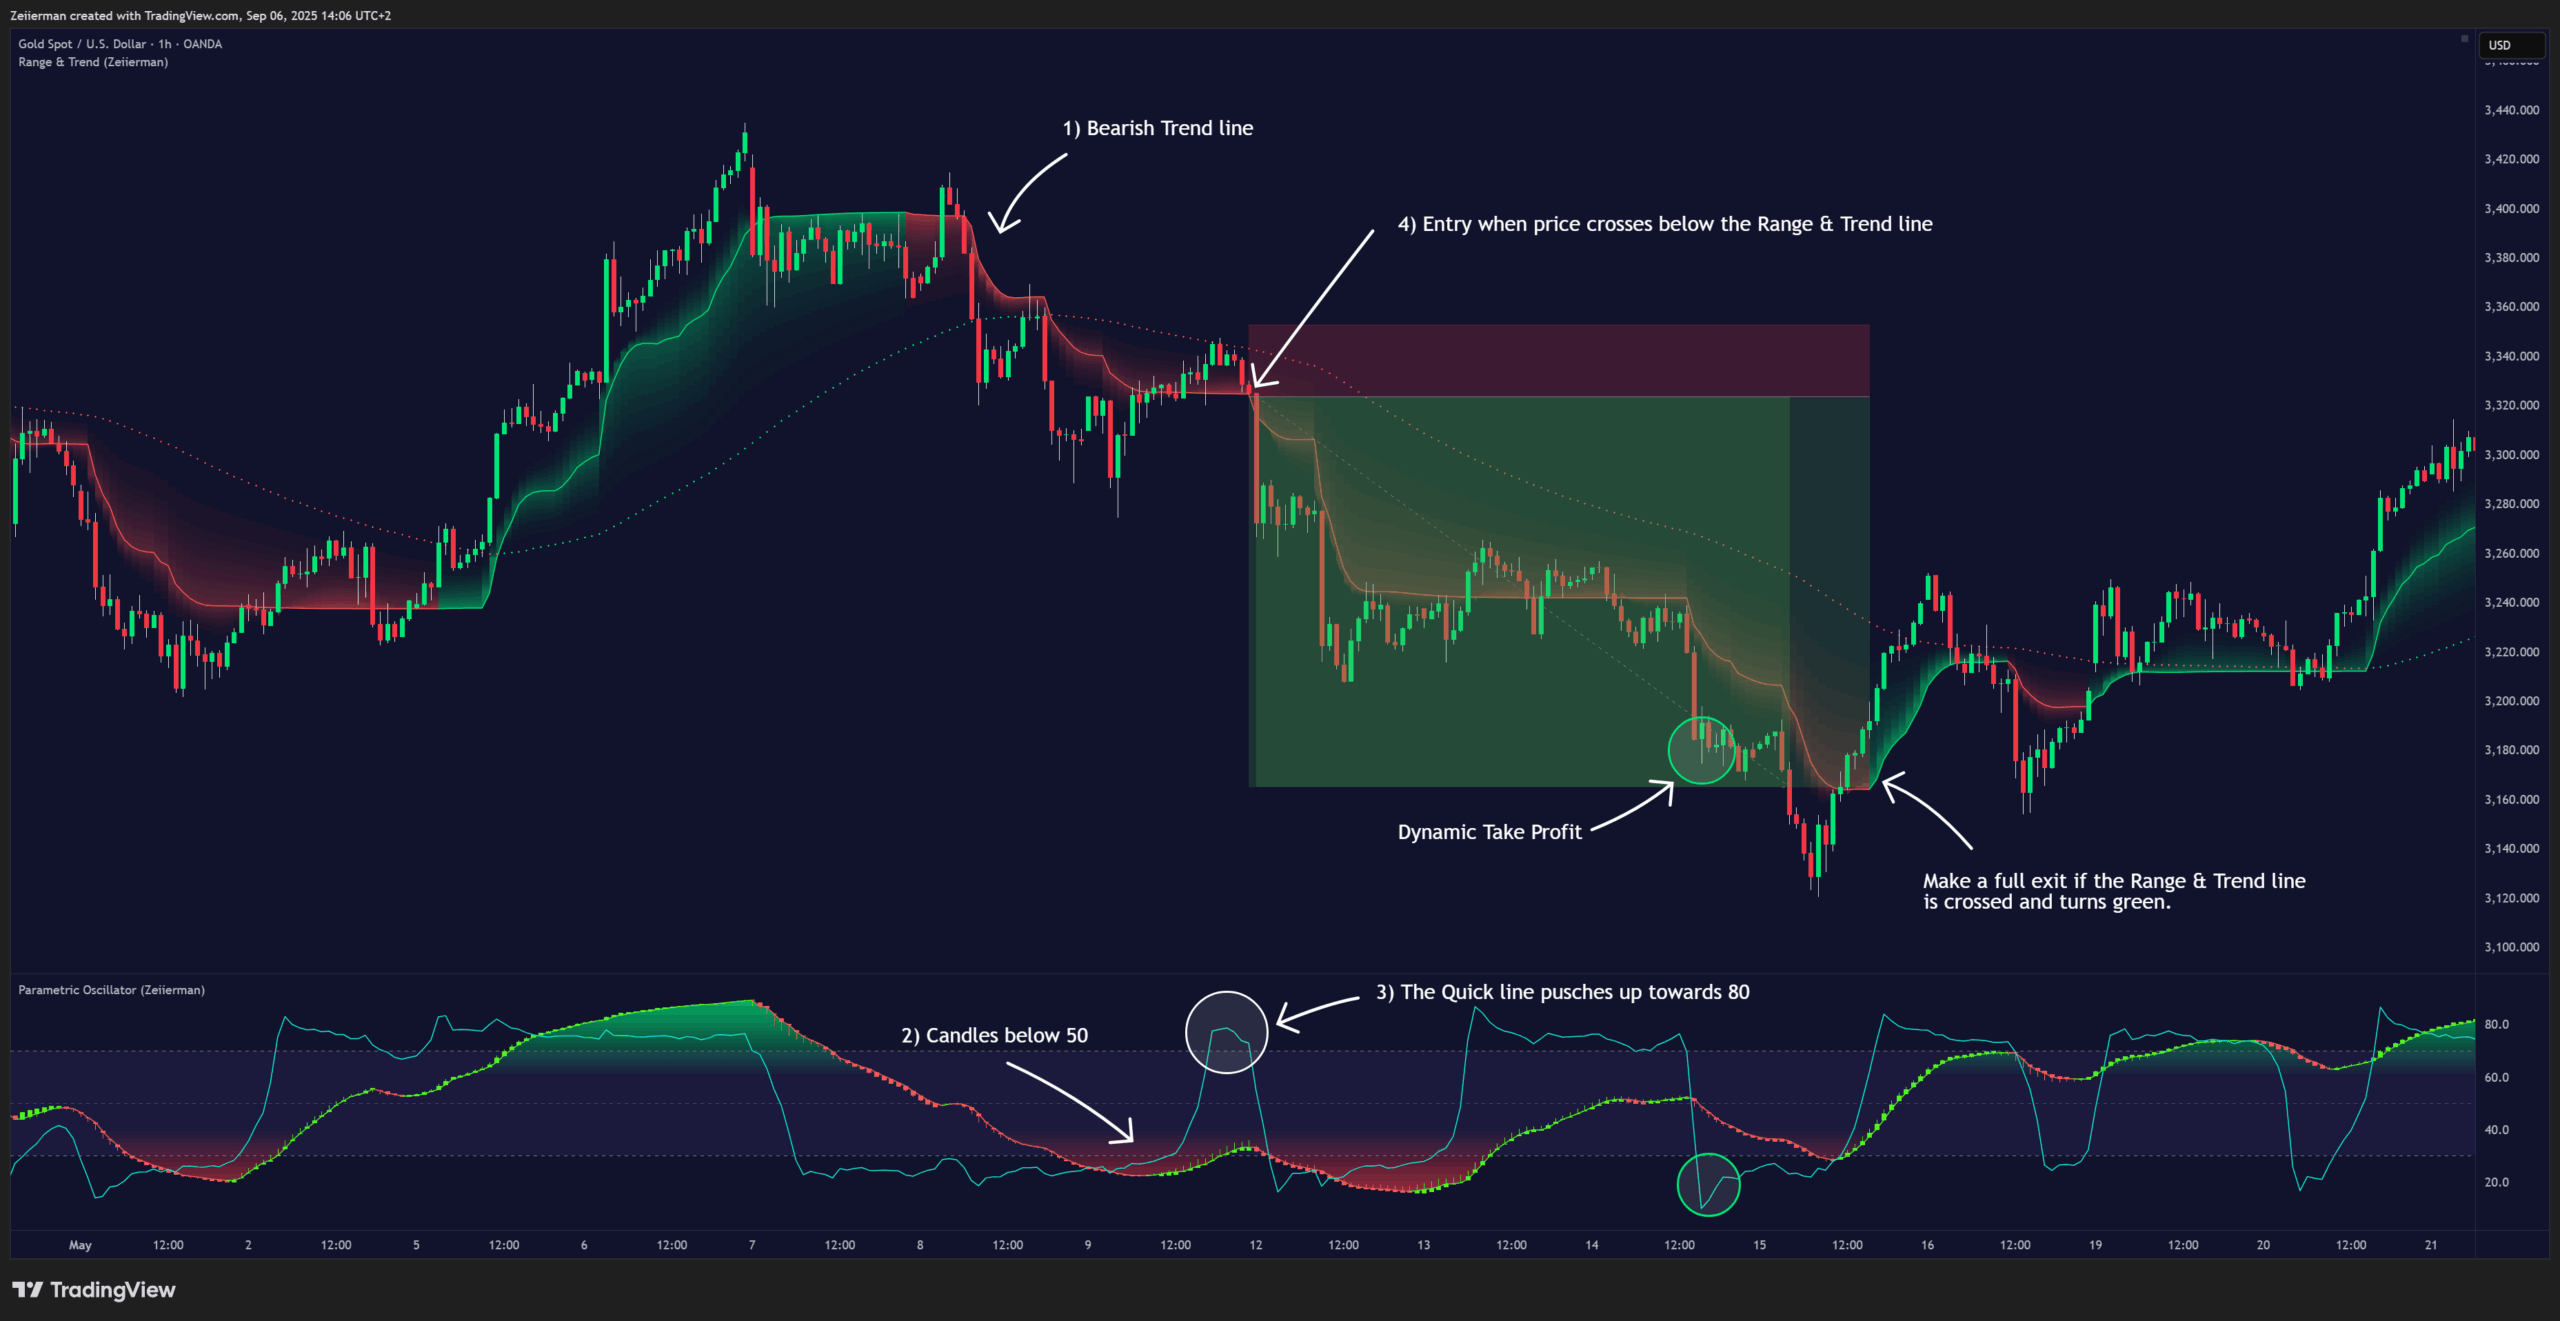
Short Setup (step-by-step)
Trend: Range & Trend is bearish, indicated by the trend line. Momentum candles in the Parametric Oscillator are clearly below the 50 line. These two conditions define the trend.
Pullback: The Quick Price Line pushes up toward 80. This shows a positive momentum move within the established trend.
Trigger: Price touches or crosses the Range & Trend line.
Entry: The very next bar that closes below the Range & Trend line gives us confirmation for entry.
Stop: Place above the Range & Trend line to keep risk-to-reward intact.
Take Profit:
- Use dynamic take-profits: whenever the Quick Price Line peaks down, you can scale out.
- Make a full exit if the Range & Trend line is crossed and turns green.
FAQ: Parametric Oscillator
Q1: How do I know if the move is a continuation or a reversal?
Watch how the momentum candles behave around the 50 line. If candles recover quickly and stay above 50 in an uptrend (or below 50 in a downtrend), it’s usually a continuation. If candles flip color and break back across the 50 line, it often signals reversal.
Q2: What makes the Quick Line different from the candles?
The Quick Line shows the underlying strength and pace of momentum in a smooth wave. The candles show the longer bursts of pressure. Together, they let you see both the rhythm (line) and the backbone trend (candles).
Q3: When should I trust OB/OS levels (80 / 20 or 70 / 30)?
Don’t fade them blindly. OB/OS levels are early warnings. Wait for the Quick Line to peak and turn, or for momentum candles to flip, before acting.
Q4: What’s the role of the 50 line?
It’s the bias divider. Above 50 suggests bullish conditions; below 50 suggests bearish. Many traders only look for setups in the direction of the Quick Line relative to 50.
Q5: Can I use this for entries alone?
Yes, but it works best when combined with structure. Many traders use price action or a separate trend filter, then use the Parametric Oscillator for timing the exact entry.
Q6: Can I use it for exits only?
Absolutely. Exiting when the Quick Line rolls against your position or when candles lose 50 is one of the simplest ways to lock profits.
Q7: How can I avoid chasing false signals in ranges?
If the market is ranging, only trade the very peaks of the Quick Line. You can also slow the settings down (longer Flow Length / higher Price Trend) and require alignment: Quick Line bias + candle confirmation + trend filter.
Zeiierman
With over 16 years in the market, Zeiierman has extensive experience as a full-time trader and risk advisory consultant for hedge funds. He has developed many profitable trading strategies, drawing on his background in risk management and strategy execution.
More from Zeiierman