Works on the Following Platforms
TradingView
For use on the TradingView platform
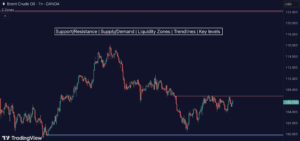
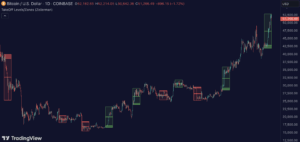
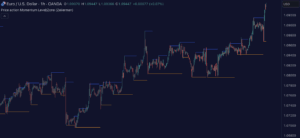
The “Liquidity Levels/Zones (Expo)” indicator by Zeiierman is tailored for traders looking to pinpoint significant liquidity zones where price may experience support or resistance. This tool is instrumental for identifying potential entry and exit points based on historical liquidity and price sensitivity analysis.
Key Features
- Sensitivity Control Modes: Choose from Custom, Medium Term, or Long Term sensitivity settings to adjust the responsiveness of the liquidity calculations to market changes.
- Liquidity Filter: Adjusts the threshold for identifying significant liquidity zones, enhancing the selectivity and relevance of the zones displayed.
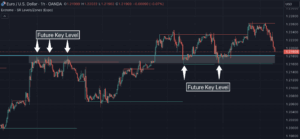
- Historical Liquidity Visualization: Option to display or hide historical liquidity zones, helping traders analyze past market behavior alongside current conditions.
Functionality
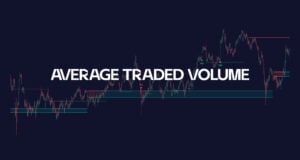
- Advanced Calculation Algorithms: Uses a combination of price range, body close ratios, and volume analysis to define liquidity zones.
- Dynamic Sensitivity Adjustment: Features a dual-control sensitivity setting that fine-tunes the zone detection mechanism, accommodating both conservative and aggressive trading approaches.
- Real-Time Updates: The indicator refreshes dynamically with new data, providing real-time insights into emerging liquidity patterns.
Applications
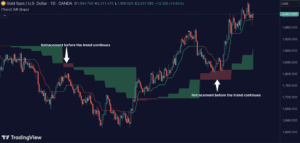
- Support and Resistance Identification: Assists in identifying where significant buying or selling activities are likely to occur, aiding in the placement of stop-loss or take-profit orders.
- Strategic Trading Decisions: Enables traders to make informed decisions by highlighting areas of potential price reversal or continuation.
- Risk Management: Enhances risk management strategies by providing clearer visibility into potential price barriers influenced by historical liquidity.
Conclusion
Zeiierman’s “Liquidity Levels/Zones (Expo)” is an essential tool for traders focusing on market depth and liquidity as key components of their trading strategy. With its customizable settings and real-time data processing, it offers a sophisticated approach to understanding market dynamics and improving trading outcomes in various market environments.
Zeiierman
With over 16 years in the market, Zeiierman has extensive experience as a full-time trader and risk advisory consultant for hedge funds. He has developed many profitable trading strategies, drawing on his background in risk management and strategy execution.
More from Zeiierman