Wedge patterns are amazing at cutting through the noise in choppy markets. They highlight moments when traders are locked in a tightening battle before a breakout. While not flashy or fancy, wedges are reliable and a widely used tool among traders for anticipating breakouts.
Whether you’re day trading, swing trading, or just learning the ropes, mastering wedge patterns can seriously level up your strategy. Picture a traffic jam on the highway. Cars pile up until someone hits the gas at the front, and everyone surges forward. Wedges work the same way. Prices get “stuck” in a narrowing range before exploding into a new trend.
Unlike channels where the lines run parallel, wedges narrow as they progress, showing a gradual shift in the balance between buyers and sellers.
1. Understanding Wedges: Types and Differences
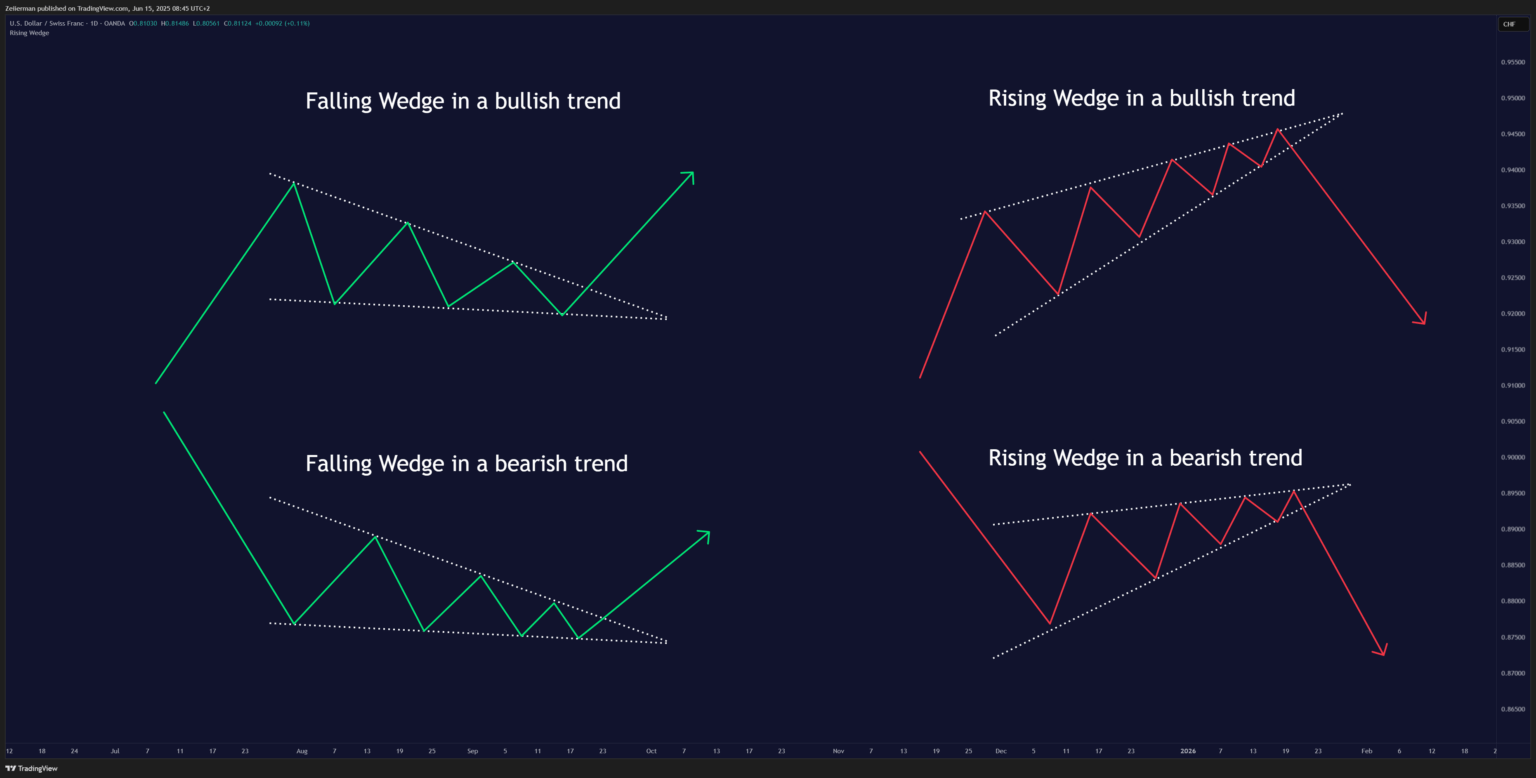
Typically, there are two types of wedges – rising and falling – and, no, the name won’t automatically tell you the direction of the trade.
I. Rising Wedges: The Bearish Trap
Prices make higher highs and higher lows but get squeezed into a narrowing upward channel. The higher lows are coming at a faster rate than the higher highs. Like a quarterback faking a throw, buyers pretend to push higher, but the rally’s running out of steam. The most classic scene in the market is when buyers get overexcited, but smart money starts shorting. The last “higher high” is often a trap.
II. Falling Wedges: The Bullish Springboard
Prices carve lower highs and lower lows but lose momentum like a slingshot being pulled back. Typically, the lower highs drop more quickly than the lower lows. Here, psychology plays as sellers panic but big players accumulate quietly. The final “lower low” is usually a fakeout.
If you understood all that financial jargon, you’re already far ahead than most people. Speaking of most people, I have noticed that many amateurs often confuse wedges with triangles.
At first glance, wedges and triangles can look similar. But here’s the kicker:
- Wedges slope either up or down.
- Triangles (like symmetrical triangles) often form with flat tops or bottoms.
- In a wedge, the slope typically goes against the overall trend.
Knowing the clear difference matters. Misreading a wedge as a triangle can wreck your setup.
Read: 2B Reversal Pattern Trading Strategy Explained: How to Enter, Exit and Profit2. How to Spot a Wedge in Real Time?
To catch / spot a wedge on your chart properly, you must be good at drawing trendlines and understanding the direction of slopes on the chart. Finding wedges isn’t about luck—it’s detective work.
Step 1: Learn to draw trendlines.
Draw two trendlines: one connecting higher lows (falling wedge) or lower highs (rising wedge), and the other connecting the opposite side.
📌 If the lines don’t converge, it’s not a wedge. Remember to look for a wave-like structure!
Step 2: Check the slope direction.
For a rising wedge, both lines slope upward, with the support line having a steeper slope. In comparison, both lines will slope downward, and the resistance line will be steeper in a falling wedge.
📌 The slope should oppose the broader trend. A rising wedge in an uptrend screams “reversal ahead.”
Step 3: Let volume tell you the truth.
Of course, you have to check the volume flow to spot the wedge formation. Volume shrinks as the wedge tightens. In rising wedges, volume typically decreases as the pattern develops, indicating a decline in buying interest.
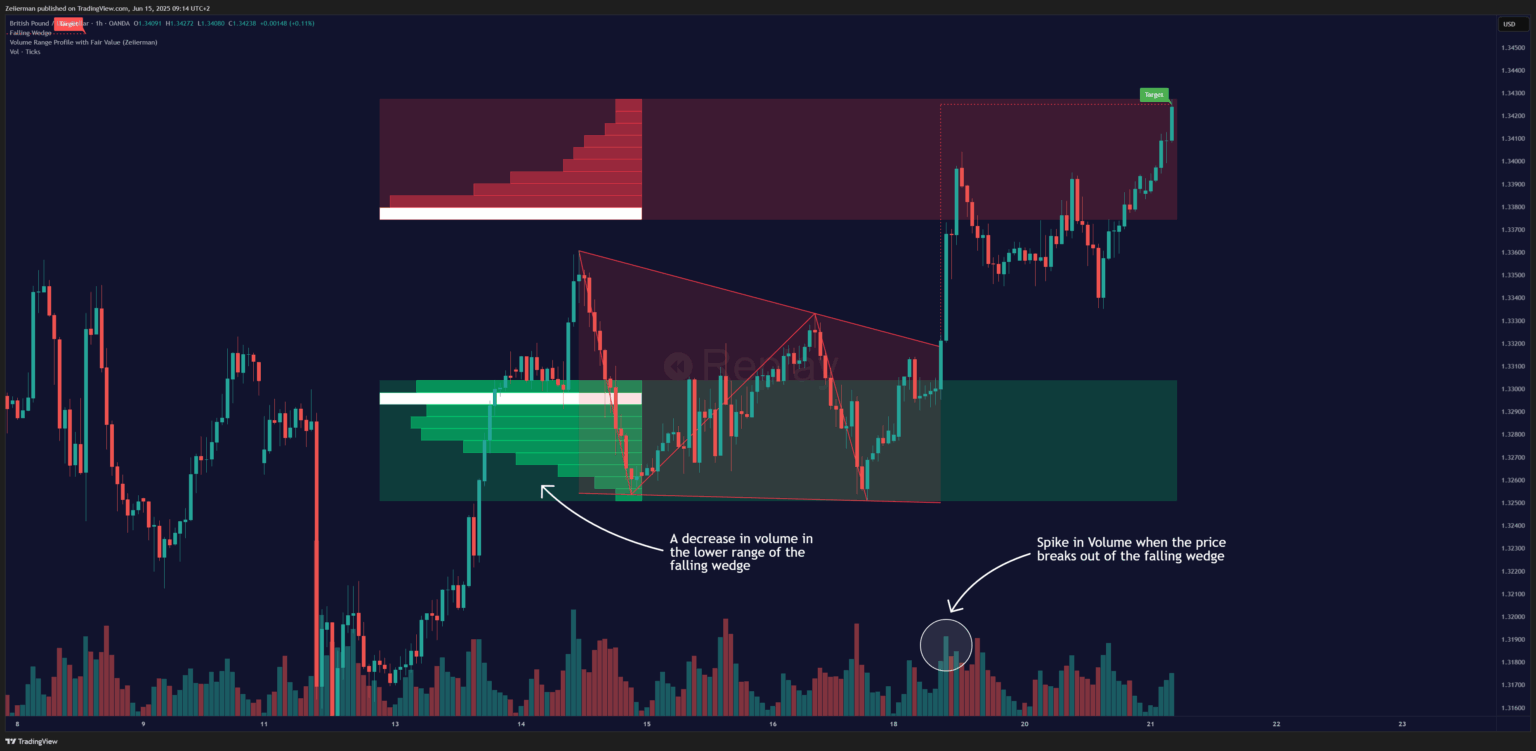
In falling wedges, look for a decrease in volume followed by a spike on the breakout. For a better volume profile, you can use some of our scripts that are widely popular in the Zeiierman community, such as the Volume Range Profile with Fair Value or the Price & Volume Profile.
Step 4: Verify the duration.
The best wedges develop over time. I’m talking weeks on daily charts and hours on intraday charts. Quick V-shaped moves aren’t wedges—trust me, they’re just volatility. Use a 4-hour or daily timeframe. That’s where the big money leaves its footprints.
📌 Consider the broader context and its formation. Wedges will often signal reversals near the end of a trend.
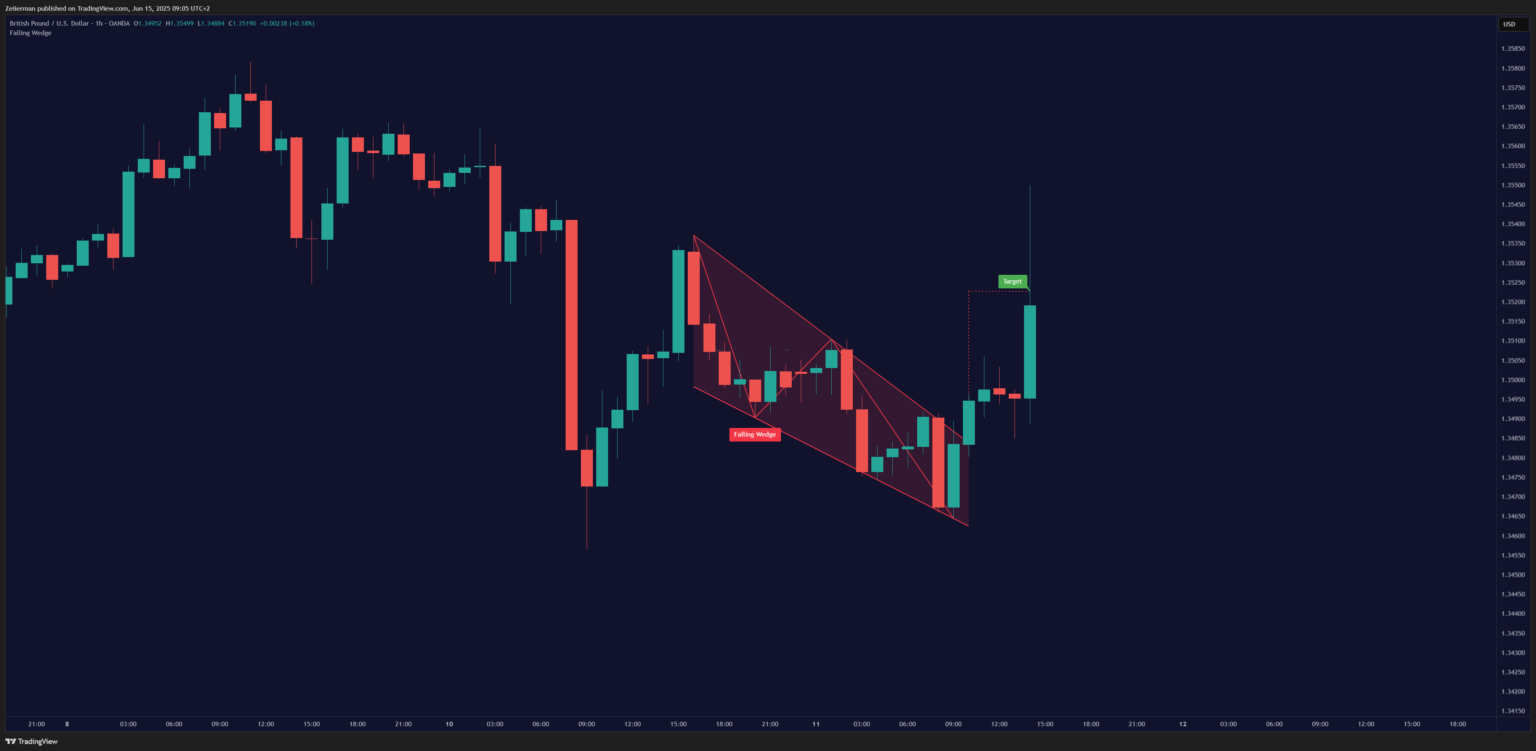
Read: RSI vs Stochastic RSI: A Comprehensive Guide for Trading Beginners3. How to Trade a Falling Wedge (Bullish)?
Now that you’re absolutely sure you’ve spotted a wild wedge on your chart let’s make sure we trade it right.
Step 1: Validate the wedge pattern.
Typically, you would find the falling wedge at the end of a downtrend or after a consolidation phase. Look for lower highs and lows with shrinking volume. It signals seller exhaustion. Everyone who wanted to sell has sold, leaving mainly buyers. A must-use indicator to stay ahead of this curve is Buying/Selling Pressure & Trend Strength/Direction.
Step 2: Entry strategy for falling wedges.
Firstly, map out key levels (support and resistance) with the Supply/Demand Zones indicator. The classic approach is waiting for the price to close beyond the wedge boundary. For a falling wedge, we look for a close above the upper trendline.
But here’s the trick most retail traders miss: don’t just jump in at the first close beyond the line. Wait for a retest of the broken trendline.
📌 I kid you not — this simple filter will eliminate so many false breakouts.
Alternatively, you can play with momentum. Buy the breakout candle (riskier but faster). This is a higher risk, but it offers much better risk-reward ratios—I’m talking 5:1 or better in many cases.
Step 3: Stop loss and exit targets.
For breakout trades, the rule is simple: your stop goes just beyond the opposite trendline of the wedge. For the falling wedge pattern, tuck it below the wedge’s lowest point (the most recent swing low). For a more dynamic stop-loss strategy, you can use the ATR + PSAR Trailing Stop.
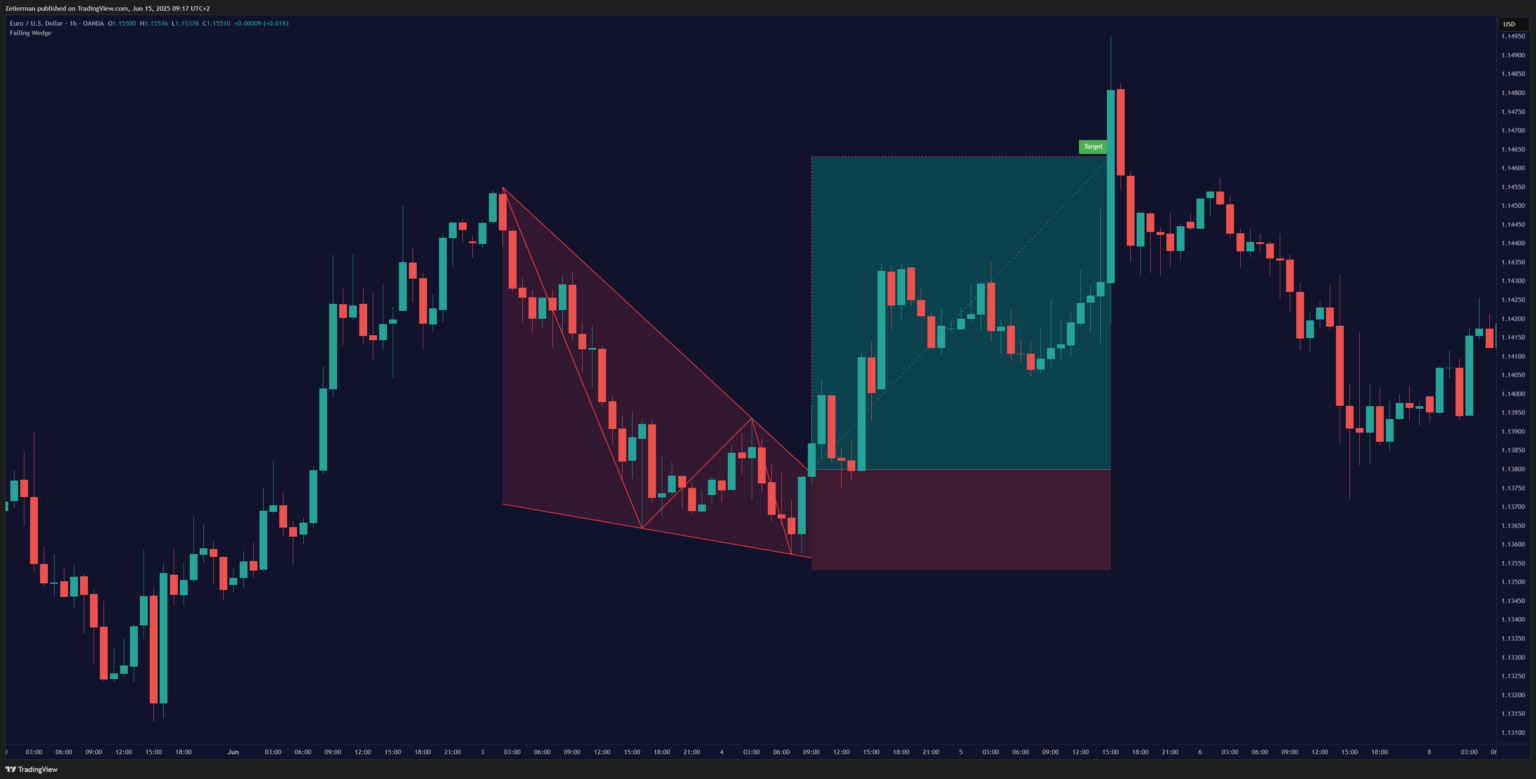
As for the target, the “measured move” approach can be a reliable method. Measure the base of the wedge and project it from the breakout point, resulting in a minimum target that often hits with accuracy.
Don’t be greedy in trending markets; wedge breakouts can run further than the measured move suggests, so trailing stops are essential. The 3ATR trailing stop is recommended for bigger moves. The best wedge trades reach their targets within a similar period.
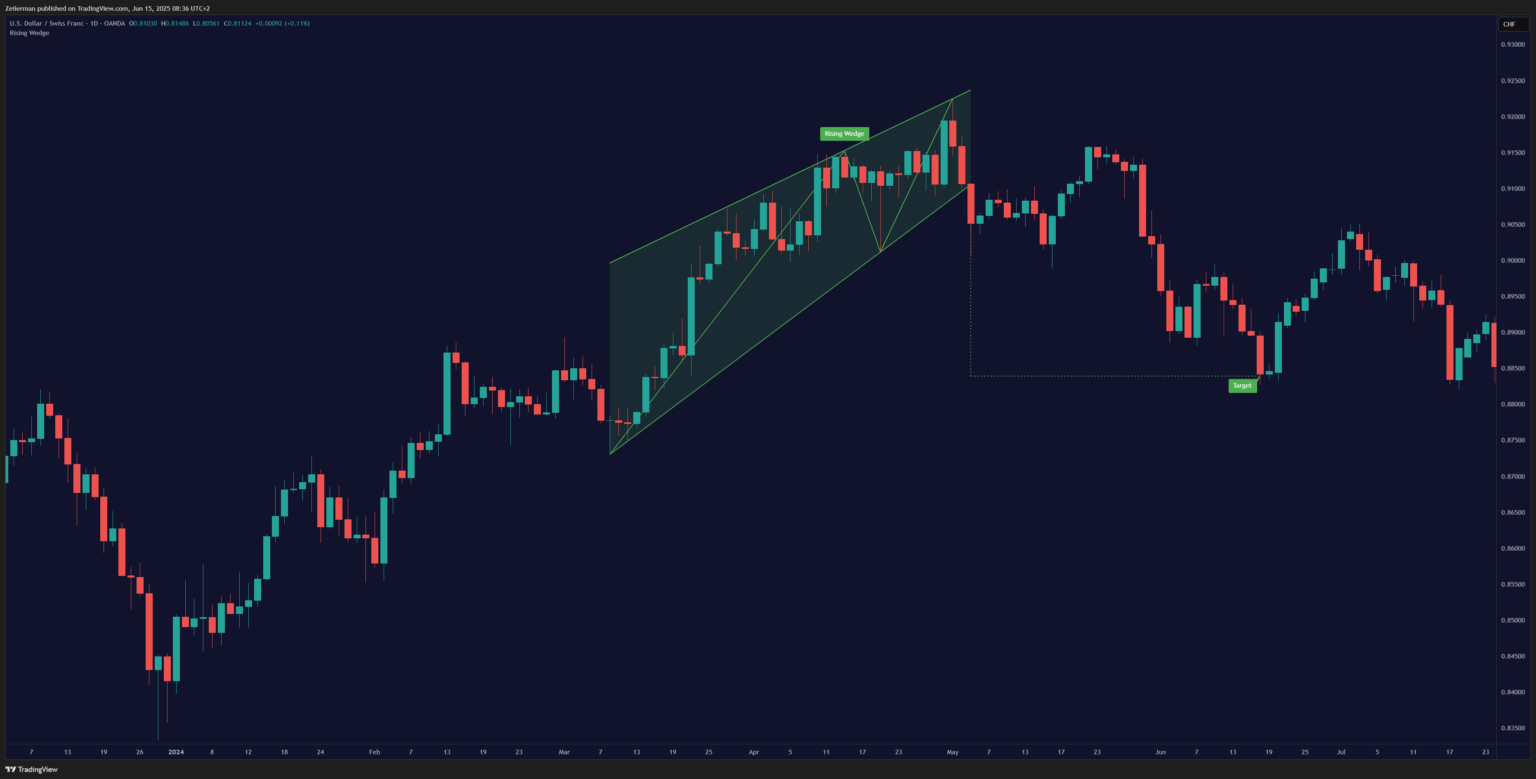
4. How to Trade Rising Wedges?
I know, I know. You’re already a pro at trading falling wedges now. Let’s do the same with the rising ones.
Rising wedges often trap eager buyers who mistake them for a bullish trend. Do remember that a rising wedge hints at a possible drop ahead, especially when it forms after a strong rally.
Step 1: Confirm the pattern.
Check if there are at least 3 touches on both trendlines you made. Look for the price action to reach a resistance or supply level, while the wedge should narrow by at least 60% from its start to its finish.
📌 The average daily volume in the final third of the pattern should be 20-40% lower than in the initial third.
Step 2: Plan your entry properly.
Don’t jump the gun! Wait for a daily close below the support level. Ideally, the next day’s opening should be below the previous close, which is your confirmation candle.
For me, the entry price should be 0.5-1% below the breakdown candle’s low (for stocks) or 5-10 pips below (for forex). You can also go with an anticipatory entry if you have an adequate risk appetite.
Here, the experienced traders short the position when the price reaches the upper trendline for the 4th or 5th time. They confirm bearish divergence on the RSI and MACD and enter only the final third of the pattern’s development.
Step 3: Optimise risk and profit (exit strategy).
Optimise risk before considering profit. If you are taking the breakdown entry, you can put the initial stop 2% above the upper trendline. I usually do the ATR (Average True Range) calculation for volatile stocks. Exit if the pattern doesn’t progress within 1.2x of the pattern formation time.
For anticipation entries, maintain a tight initial stop of 0.8-1.2% above the entry point. You need to make an immediate adjustment if you find a weakness in the setup. Use a structured approach to set the profit target. You can set the target to be 10% to 30% of the position, which has a better chance of hitting.
A standard take profit can be measured by the wedge’s height and projected downward from the breakdown point. This is a two-tiered profit-taking approach with good success probabilities.
Read: The Benefits of Smart Money Concepts Trading5. Advanced Wedge Trading Techniques
Ready to take your wedge trading to the next level? Here are some advanced approaches I’ve come across in my experience:
Elliott Wave + Wedges: Elliott Wave Theory and wedge patterns are naturally connected – wedges often appear as specific wave formations. Fundamentally, the theory divides the market cycle into impulse waves (5-wave moves in the trend direction) and corrective waves (3-wave counter-trend moves). Here’s why it works: Wedges indicate buying or selling exhaustion and Elliott Wave theory tells you where to expect them.
Options Strategies for Stock Wedges: For stock traders, options provide leverage with a defined risk for wedge trades. When trading a rising wedge breakdown, buying put spreads offers a better risk-reward ratio than shorting shares outright.
6. Tools & Indicators to Use with Wedges
Wedge patterns don’t need a million indicators, but these few can help confirm breakouts and refine entries/exits.
Smart Money Concept (SMC): It can help get ahead of the curve and follow the smart money flow. You can pair it with a falling wedge breakout to confirm bullish reversals using SMC’s liquidity grab signals.
MACD & RSI Overlay: A combination of two popular indicators used by many experienced traders, and is recommended for beginners. This combination marks divergences and momentum shifts essential for entry or exit.
Range & Trend: Used by many in the community to identify the underlying trend to make a solid wedge trade setup.
Volume SuperTrend AI: It combines volume analysis with trend detection to pinpoint potential breakout points. This will help you to know which breakout is reliable and improve risk management.
Read: How to Trade Head & Shoulders Pattern in 2025 – Beginner to Advance7. Common Mistakes and How to Avoid Them
I. Trading Low-Quality Patterns: Not every converging price structure is a tradable wedge. Remember that you need at least two touches on each side to confirm a valid wedge.
II. Ignoring the Bigger Picture: A wedge doesn’t exist in isolation. A falling wedge is far more reliable when it forms in an established uptrend. Context matters.
III. Forgetting About Volume: Price patterns without volume support are unreliable. In a proper rising wedge, the volume should decrease as the pattern forms, then expand on the breakdown.
IV. Early Entries: The urge to “get in early” has led to the demise of more trading accounts than bad patterns. Waiting for confirmation (an actual close beyond the trendline) may result in a slightly worse price, but it significantly improves the reliability of the setup.
V. Misplacing Stops: Either too tight (getting stopped out before the move happens) or too loose (risking too much for the expected return).
8. Frequently Asked Questions (FAQs)
Remember what I said at the beginning—wedges are not flashy or fancy, but they’re reliable. In trading, boring profitability consistently beats exciting losses. Let’s end this article with a few questions that are often asked on the Zeiierman Community server on Discord.
1. Are wedges reliable reversal patterns?
Wedge patterns are absolutely reliable as reversal signals when confirmed with structure, volume, and trend context. Falling wedges typically signal a bullish reversal, while rising wedges suggest a bearish turn. Their reliability increases when they form after strong trends and are supported by volume contraction followed by a breakout spike. While not foolproof, well-formed wedges—especially on higher timeframes—can offer high-probability setups when paired with proper entry and risk management rules.
2. What is the best timeframe to trade wedge breakouts?
The best timeframes to trade wedge breakouts are the 4-hour and daily charts. These timeframes tend to filter out market noise, provide a clearer structure, and align more closely with institutional price movements. Lower timeframes, such as 15 minutes or 1 hour, can also work for intraday trades, but they carry a higher risk of false breakouts.
For swing trading and higher conviction setups, sticking to the 4H or daily timeframe yields more reliable wedge formations and cleaner breakout opportunities.
3. What’s the difference between wedges and triangles?
Wedges and triangles are both consolidation patterns, but they differ in shape and market implication. Wedges slope either upward or downward and often signal reversals—rising wedges are bearish, and falling wedges are bullish. In contrast, triangles (especially symmetrical triangles) usually have flat tops or bottoms and act as continuation patterns.
Wedges also exhibit a more pronounced narrowing of price action, indicating exhaustion, whereas triangles display balanced pressure between buyers and sellers.
SM_Trader
SM_Trader is a highly experienced coder and strategy developer who brings the most complex algorithms to life. As a member of MENSA, the prestigious organization for individuals with intelligence scores in the top 2% of the world, he combines exceptional analytical skills with a keen eye for numbers and statistics, empowering businesses to grow at the right pace and in the right direction.
More from SM_Trader