In TradingView’s strategy tester, you can use historical data to simulate how your rules would have performed in the past. If you want a real rules-based edge, this is where you prove an idea before risking your capital. Backtesting in the Strategy Tester helps expose hidden assumptions, spot curve-fitting, and quantify trade expectancy, which is the measurable backbone of any robust trading plan.
At its core, the Strategy Tester is a historical simulation engine. It takes a defined set of entry and exit rules, usually written in Pine Script, and walks through past price action to see how those rules would have behaved.
The key aspect of this tool is that it’s not a live real-money test. The Strategy Tester simulates fills without placing any (real) orders on an exchange. It uses historical data to calculate trade results and performance metrics. You can use built-in, community, or custom Pine Script strategies to test on this engine.
We will go through the basics and steps for accessing the strategy tester, as well as the practices to keep in mind when testing your idea in it.
1. Using TradingView’s Strategy Tester
Step 1: Chart Setup
Log in to your TradingView account and open the chart you wish to use for testing your strategy. Make sure you choose an asset suited to your strategy testing. For example, if you’re testing a daily trend-following system, use a daily chart on assets like AAPL, BTCUSD, or ES futures.
Step 2: Load Your Strategy
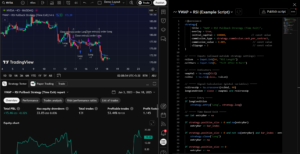
Navigate to the bottom of the screen where you see options like Pine Editor, Paper trading, and Strategy Tester. Select Strategy Tester and click on the “Load Strategy” button. You will see a built-in strategy list to choose from; you can also choose a community strategy to explore ideas that others have shared, or load your custom strategy from Pine Script saved in your account.
Read: How to Mark Take Profit and Stop Loss on TradingView (Step-by-Step Guide)Step 3: Features of Strategy Tester
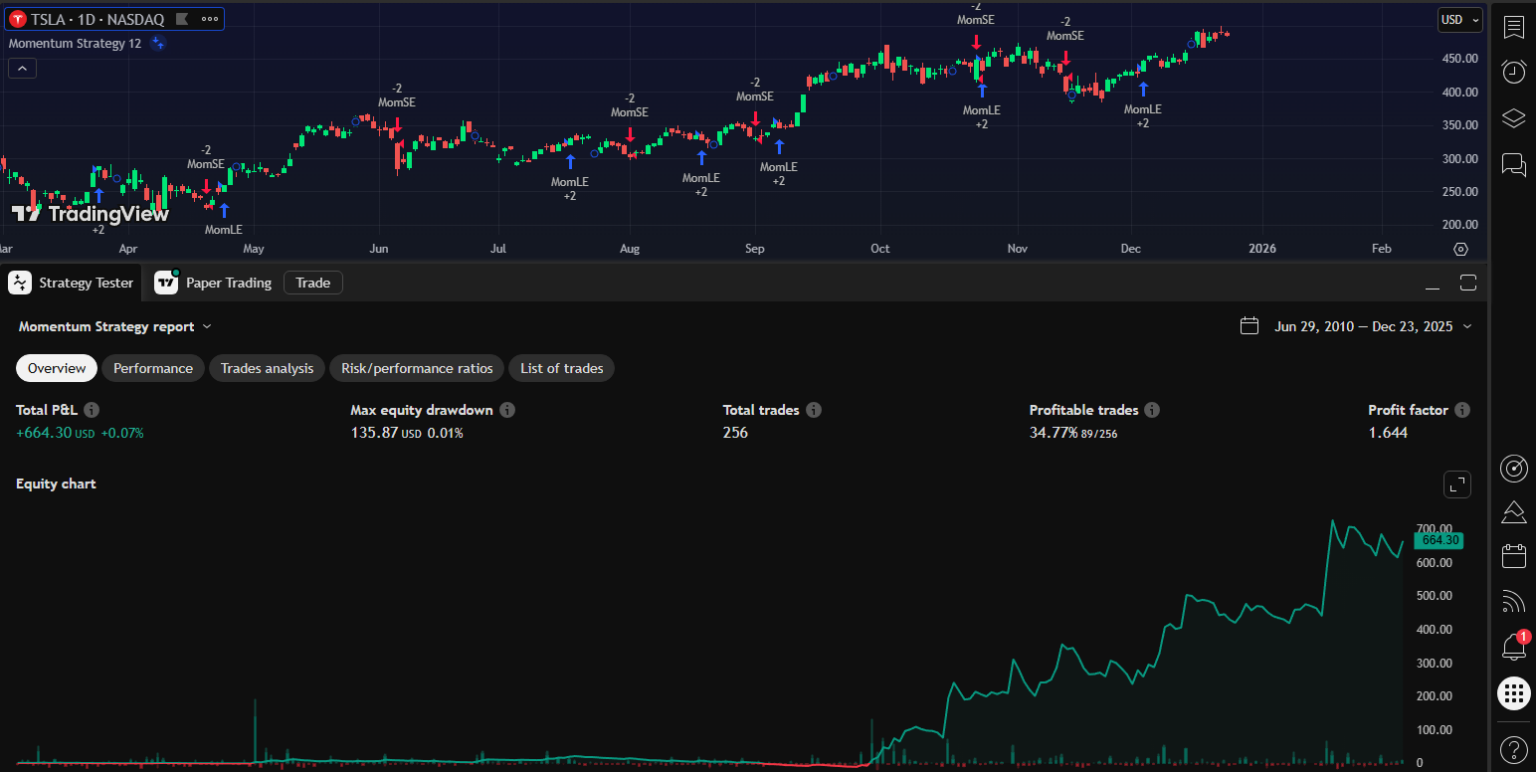
When you apply your strategy, you’ll see several things, including:
- Trade markers on the chart showing where your strategy would have entered and exited.
- Overview of profit and loss, maximum drawdown, and profit factor of the strategy in the given asset and timeframe.
- A live performance graph that auto-updates.
Tabs in the Strategy Tester panel display different analytics, including performance, trade analysis, risk ratios, and a list of all trades made within the specified timeframe. For example, we take the Tesla (TSLA) chart and apply the built-in “Momentum strategy” from the list.
Step 4: Customize Test Conditions
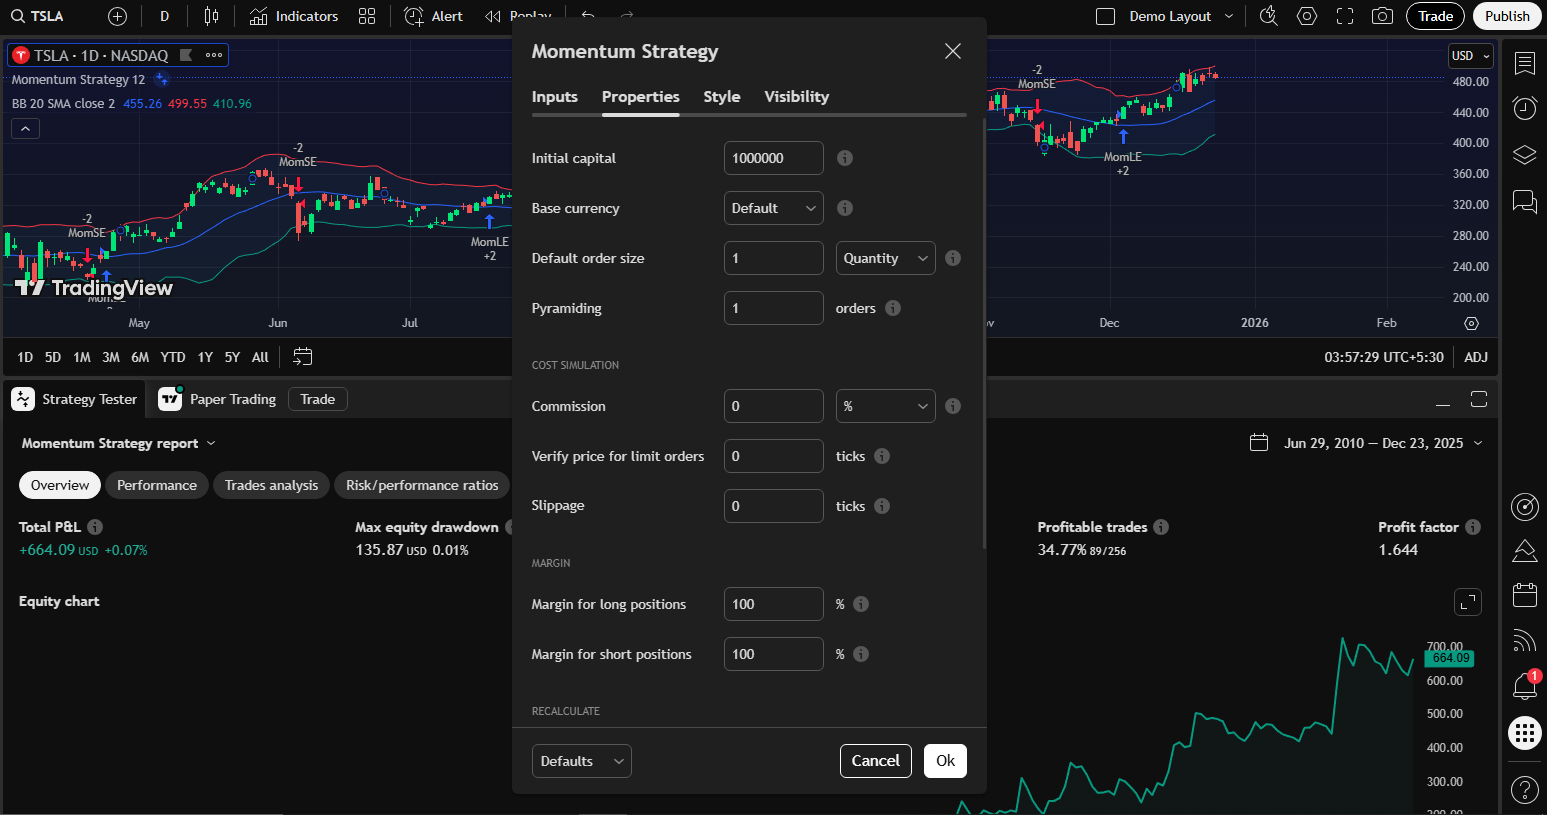
You can also customize your test conditions to be realistic for the trades you may use in the future. Select the strategy name in the panel to open the settings. In settings, you can set all the relevant parameters and rules that will apply in your real trading. Here you have to:
- Set Realistic Capital and Position Size
If you’re paper-trading a $5,000 account, don’t test with $1,000,000. Set your initial capital and position sizing rules so they reflect what you’d do in real life.
- Add Commission and Slippage
Real markets have transaction costs and price movement between signal and execution. It’s recommended that you include commissions (fixed or percentage) and slippage (expected price difference at execution). Failing to include these will give overly optimistic results.
- Choose the Right Test Window
If you’re testing a long-term system, select several years of data. If you’re testing intraday scalping, choose a good sample of recent days or weeks. You can also change other metrics, such as margins, fill order settings, and the pyramid setting (Max no. of trades taken in the same direction).

2. Best Practices for Strategy Testing
Running a backtest is easy, but running a meaningful backtest is not. When building your own strategy and Pine Script, you must keep solid rules in mind to efficiently test the plan. As such, I have compiled a short list of best practices that serve as guardrails to prevent you from trusting numbers that won’t hold up in live markets.
I. Test on Different Timeframes
One of the most common beginner mistakes is assuming that a strategy that works on one timeframe will automatically work on another. Markets don’t work that way.
Every timeframe has its own small structures and quirks that an experienced trader must know about. Lower timeframes (1m–15m) are noisy, spread-sensitive, and execution-heavy, while higher timeframes (4H–Daily) are smoother but slower and more exposed to overnight risk.
A strategy that looks great on the daily chart might completely fall apart on a 15-minute chart, not because the logic is bad, but because the assumptions change. To curb this issue, I start with a timeframe designed for the strategy. Next, I try one timeframe above and one below to observe changes in win rate, drawdown, risk ratios, and trade frequency.
II. Validate Across Similar Assets
It’s easy to get convinced by a strategy that looks great on one particular stock, but often, that success hides a bigger problem. Your strategy may be too tailored to the past behavior of that specific market. While every market has its own setup, there are still common patterns such as trends, mean reversion, volatility spikes, and liquidity changes.
If your strategy aims to tap into a broader idea, like riding a trend or catching momentum pullbacks, it should show some consistent logic across similar assets, even if the profits aren’t the same every time.
A proper validation process includes:
- Testing equity strategies across several large-cap stocks or indices
- Testing crypto strategies on both BTC and ETH rather than a single token
- Testing futures strategies across correlated contracts instead of a single market
You are not evaluating raw returns here. You are considering the behavioral alignment of your idea. Ask whether entries trigger under similar conditions, whether drawdowns occur during comparable market phases, and whether the trade distribution remains structurally intact.
Read: How to Access Invite-Only Scripts on TradingViewIII. Combine Statistical Metrics with Visual Trade Validation
Statistics give us meaningful insights, but they’re not enough on their own. A high profit factor or a good net return can mask flawed trading logic, too much risk in one area, or unhealthy habits that you’ll only spot when you look at the charts’ labels.
Also, just looking at the charts without any statistical backup can create a false sense of security. A strategy might look solid visually, but it could still lead to unpredictable results or significant losses down the line. A pro trader with a good trade idea always integrates both perspectives.
You can start with the Performance Summary to understand profitability, drawdown behavior, and trade frequency. Then move to the chart view, where entry and exit markers reveal how the strategy interacts with price in real time. Finally, check the List of Trades to identify patterns that statistics alone cannot explain, such as clusters of losses during specific volatility regimes or repeated exits at structurally poor locations.
When the numbers align with the chart’s logical behavior, confidence in the idea is earned. When they diverge, logic must take precedence over profitability, because illogical systems tend to fail abruptly once market conditions change.
IV. Evaluate Risk Metrics
Many traders get fixated on the profits a strategy generates, often overlooking how it can lose money. This can result in strategies that look good on paper but are tough to actually trade in the real world, both mentally and financially.
Risk metrics such as maximum drawdown, consecutive losses, and equity volatility are key to determining whether a strategy can be consistently executed in real-world situations. A strategy might show strong returns in theory, but if it has significant drawdowns, most traders won’t be able to handle those long periods of losses without making changes.
While evaluating the risk factors, you have to ask yourself:
- Can this drawdown be tolerated with real capital?
- Would I continue trading this system after a series of losses?
- Does the risk profile align with my account size and psychology?
If the answer to any of these questions is no, the strategy needs adjustment regardless of its historical profitability.
3. Advanced Strategy Tester features
Once your basics are solid, these features help tighten the link between simulated and live outcomes. Here are a few handy tools you can use to test a strategy efficiently.
1. Bar Magnifier
Bar Magnifier goes beyond basic OHLC assumptions by analyzing intrabar data. It dives into lower timeframe data to find out if the price really hit your order levels during the bar. It is incredible at reducing confusing fills, which is super important if your trading rules rely on the sequence of movements within a bar (like when you have entries and stops that often occur within a single daily candle). You’ll need a higher-tier TradingView plan to use Bar Magnifier. If you’re trading intraday or need precise tick behavior, this tool is definitely essential.
2. Forward testing and live transition.
TradingView supports forward testing by applying the strategy to real-time data, so you get a performance report as new candles are created. It’s essential to keep the same settings when moving from backtesting to forward testing, and to avoid tweaking too much at the start. Let the system run long enough to gather a solid sample before you start calling it a success.
3. Combining community scripts and your own code.
The TradingView community shares a ton of strategies that can serve as your starting points. Think of these as experiments where you can take some time to look through their trade lists and stats, and then mix in what works for you into your own testing setup. If you decide to modify any community code, make sure to keep track of every change so you can see what improves or worsens things.
Strategy Tester is a tool for building discipline, clarity, and statistical awareness in trading. Traders who use it properly do not chase perfect equity curves. They keep looking for strategies they can understand, trust, and execute consistently.
Also, a well-tested strategy does not eliminate losses, but it eliminates uncertainty. It replaces hope with structure and emotion with probability. When used with patience and honesty, the Strategy Tester becomes one of the most powerful tools a trader can have, not for predicting the market, but for understanding themselves within the market.
Zeiierman
With over 16 years in the market, Zeiierman has extensive experience as a full-time trader and risk advisory consultant for hedge funds. He has developed many profitable trading strategies, drawing on his background in risk management and strategy execution.
More from Zeiierman