Fibonacci retracement is an interesting concept. It’s largely presented as something magical or highly predictive – both of which can be incredibly confusing from a beginner’s POV. I am sure you have heard the ol’ saying, “prime must reverse at the 61.8% level” as if the golden ratio somehow forces the market to respect arbitrary (not so much) price levels.
In real trading, that belief leads to frustration, premature entries, and unnecessary losses.
So, what does this mean? Should you just ignore it? Of course, not. Instead of using Fibonacci as a standalone strategy, we will use it properly – like a framework ideal for understanding pullbacks inside a market move.
By the end of this article, you will know how to calculate Fibonacci retracement levels correctly, how to draw them the right way on TradingView, and how to use them alongside market structure and price action, which is how professional traders actually apply them.
What do Fibonacci retracement levels really represent?
Before we start calculating, let’s clear up what Fibonacci retracement levels are not. They are not prediction lines, not reversal guarantees, and not buy-or-sell signals by themselves. Fibonacci retracements are best understood as reaction zones: areas where price is statistically more likely to slow, pause, or respond during a pullback.
Fibonacci retracement levels map these pullbacks in a structured way. They help you visualize where a healthy correction might end and where the trend could resume, assuming the underlying structure remains intact. This is why Fibonacci works best in trending markets and performs poorly in choppy or range-bound conditions.
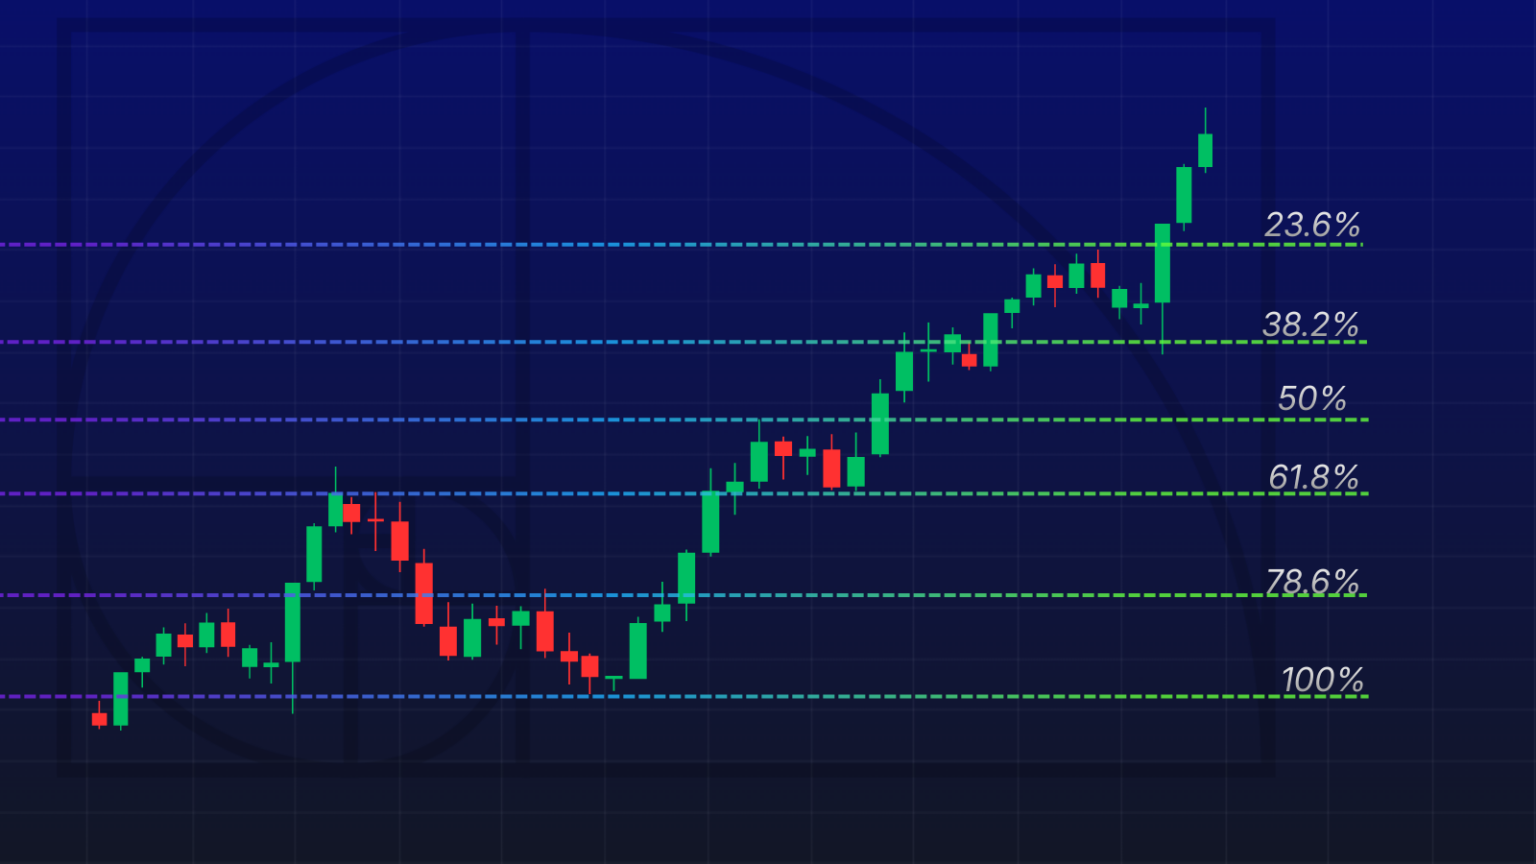
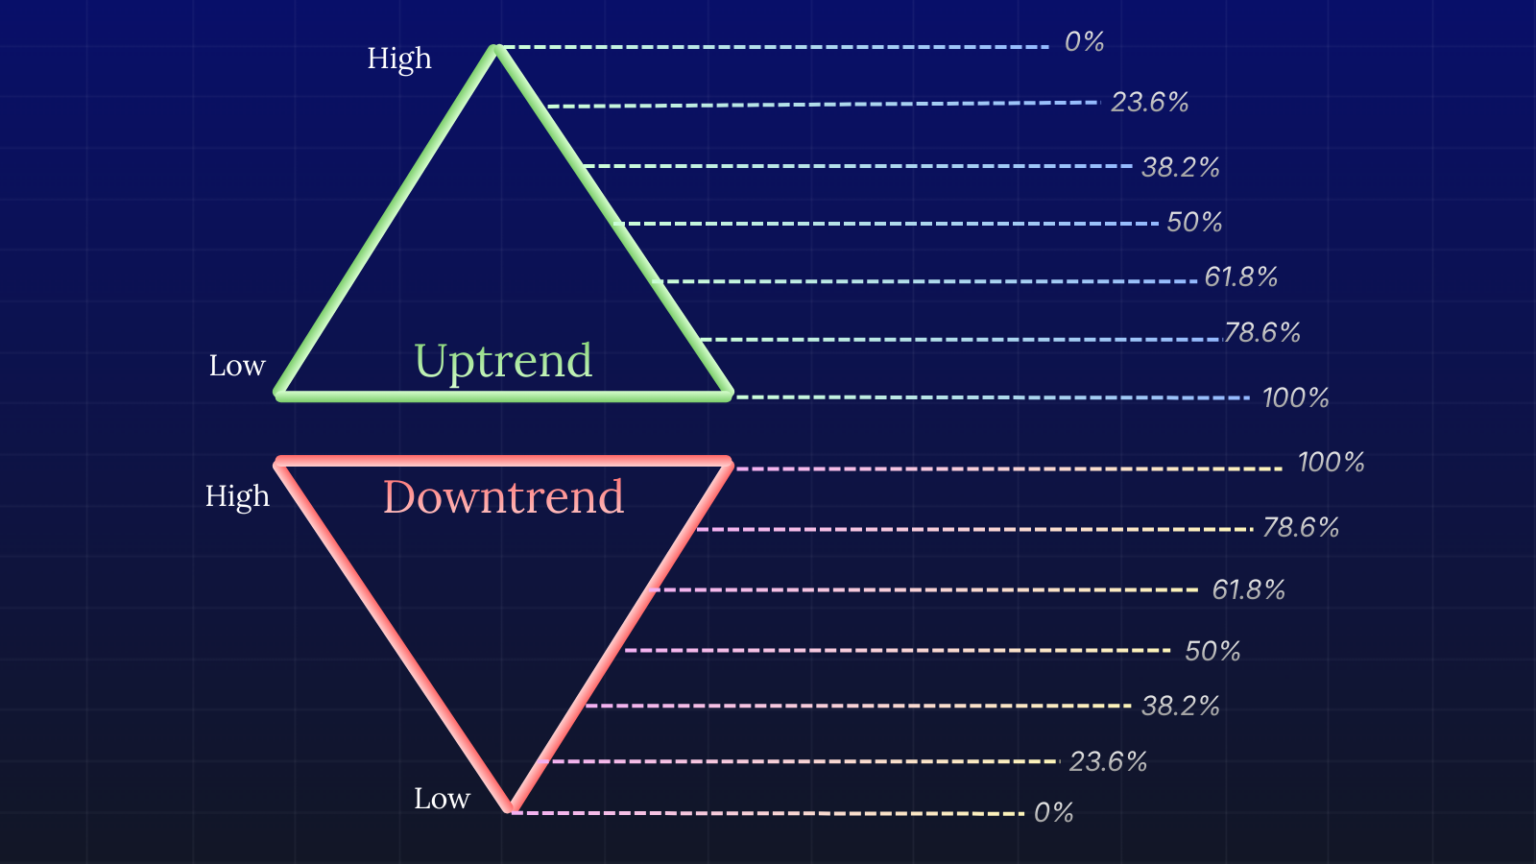
The key Fibonacci retracement levels used in trading are 23.6%, 38.2%, 50%, 61.8%, and 78.6%. Each of these percentages represents a potential retracement depth from a recent high or low. They’re derived from the Fibonacci sequence: 0, 1, 1, 2, 3, 5, 8, 13, 21, 34, 55, 89, 144, and so on. In this sequence, each number is the sum of the two preceding numbers.
Another important point is that Fibonacci levels reflect crowd behavior rather than mathematical destiny. Many traders watch the same levels, algorithms are programmed to respond near them, and institutions use them as reference points for liquidity. The reaction often occurs because market participants expect it, not because the numbers themselves have power.
How to calculate Fibonacci retracement levels?
Technically, most charting platforms will calculate Fibonacci retracements for you automatically. That said, I do believe it’s crucial to understand the concept and be able to calculate it yourself whenever needed. It also prevents blind dependence on generic tools without knowing what they represent.
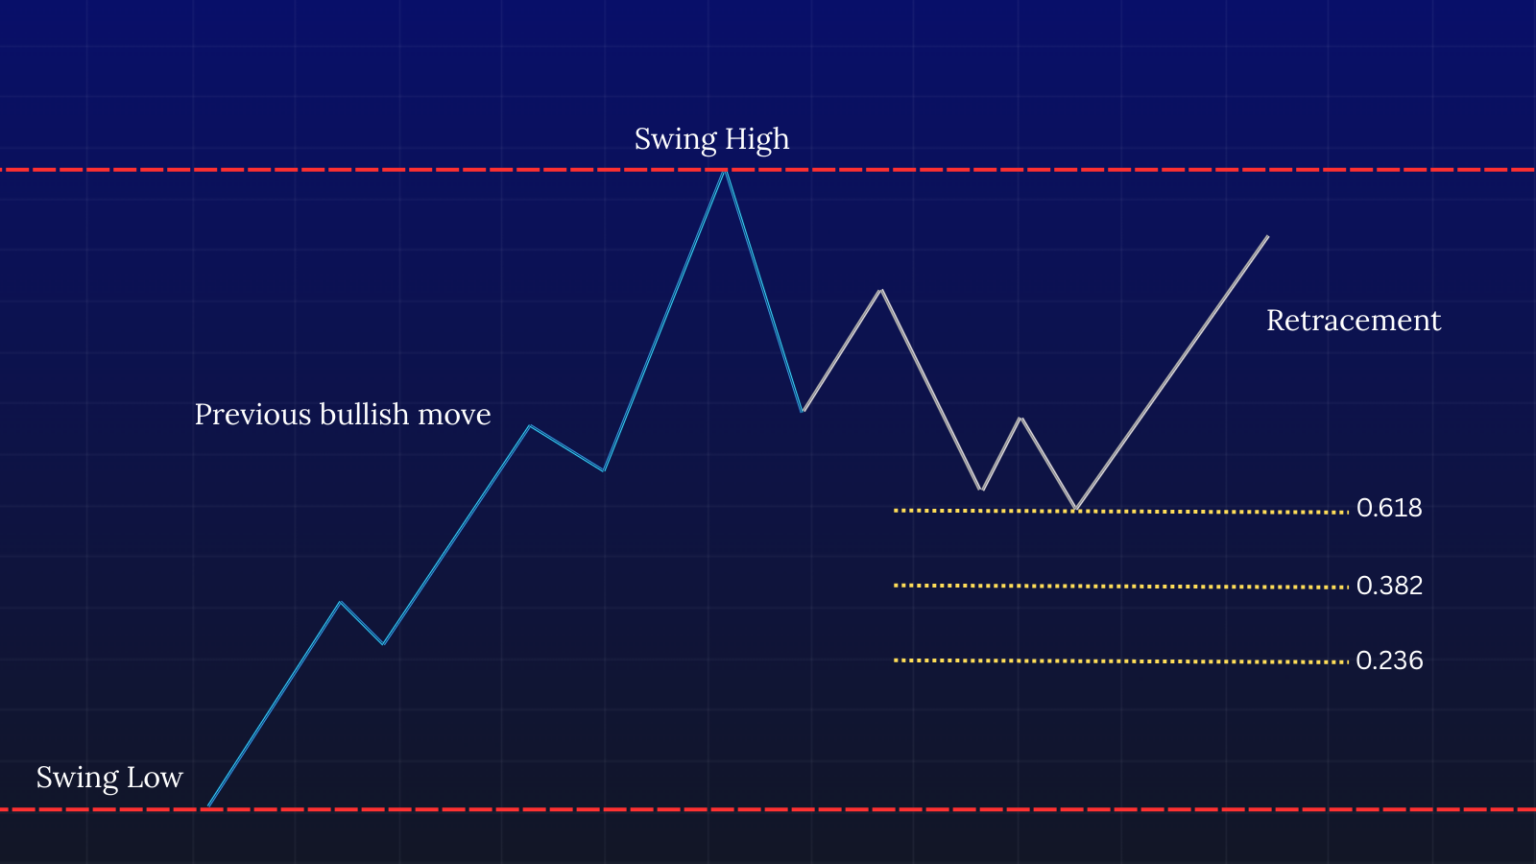
To calculate Fibonacci retracement levels, you need two points: a swing high and a swing low. The distance between these two points represents the full move you are measuring. In an uptrend, you have to subtract the retracement percentage from the swing high. In a downtrend, you add the retracement percentage to the swing low.
📌 Pro Tip: Use the wicks when marking swing highs and lows – even if the price didn’t close there, it did travel there. That price point exists in the market’s memory. By using the wicks, you capture the full range of the move.
Read: Fibonacci Retracement Levels: Best Settings and Timeframes for TradingViewLet’s take an example, imagine a stock moving from 100 to 150 in an impulsive uptrend. The total move is 50 points.
- 38.2% retracement would be calculated as: 150 − (50 × 0.382) = 130.9
- 50% retracement would be: 150 − (50 × 0.5) = 125
- 61.8% retracement would be: 150 − (50 × 0.618) = 119.1
These values represent potential pullback zones where price may react before continuing higher. In a downtrend, the logic changes. If the price drops from 200 to 140, the move is 60 points.
- 38.2% retracement would be: 140 + (60 × 0.382) = 162.9
- 50% retracement would be: 140 + (60 × 0.5) = 170
- 61.8% retracement would be: 140 + (60 × 0.618) = 177.1
While you will rarely calculate these manually in live trading, knowing how they are derived helps you trust what you see on your chart and avoid common anchoring mistakes.
Alright, now the more important question: Do certain Fibonacci levels matter more than others? Is there a chosen level among traders?
At its core, the issue boils down to having too many variables. Traders often face this challenge, as Fibonacci retracements overcomplicate things with too many levels, all treated as inevitably important. With time, we have come to realise that only certain levels matter when predicting markets, and even then, you need the right context for the numbers to make sense.
The 23.6% level typically appears during strong momentum moves. When the price pulls back only a little before continuing its journey, it indicates that trend followers are diving in aggressively and showing little hesitation. You’ll often see reactions at this level in major breakouts or moves driven by news.
The 38.2% level represents a healthy pullback in a stable trend. It often attracts traders who missed the initial move and are waiting for a reasonable discount without risking a full trend failure.
The 50% level is not technically a Fibonacci number, but overlooking it isn’t a smart move. Markets often pull back to around half of a move before continuing, mostly because of the psychological tug-of-war between buyers and sellers. A lot of institutional players keep a close eye on this area.
The 61.8% level is the most talked-about and also often misused. It can be a critical area where the market either sticks to the trend or shifts direction. Avoid treating this as a rigid reversal spot and observe the price action’s reaction within a reasonable context.
The 78.6% level appears less frequently and usually signals deeper corrections. When the price reaches this level, the trend is already under stress, and confirmation becomes far more important. The essential takeaway is to be cautious and demand extra confirmation before acting at this stage.
Using fewer levels keeps your chart clean and forces you to think in terms of zones rather than precise prices, which aligns better with how markets actually behave.
Fibonacci Retracement Strategy
To make Fibonacci retracement really work for you, think of it more as a decision-making tool rather than just a signal to trade. This approach will help clear any confusion about using Fibonacci by outlining when you’re ready to make a trade, where you can enter the market, and what needs to happen before you put your money on the line.
This strategy is designed to work with trending markets and assumes you are willing to wait for clear conditions rather than forcing trades during random price movements.
Step 1: Defining the Directional Bias Using Structure
Bullish Bias Requirements:
You are allowed to look for long trades only when
- price has created a clear sequence of higher highs and higher lows,
- the most recent swing high has broken a prior resistance area, and
- Zeiierman’s Market Structure confirms a bullish structure rather than neutral or sideways conditions.
The presence of higher highs alone is not enough. The pullbacks from those highs must respect prior structure rather than collapse deeply or overlap aggressively.
TRY: Zeiierman’s Market Structure and Price Action Toolkit on TradingViewBearish Bias Requirements:
You are allowed to look for short trades only when
- price has formed a clear sequence of lower highs and lower lows
- the most recent swing low has broken prior support
If the price is compressing or the structure is unclear, you stand aside. Capital preservation is part of the strategy.
Step 2: Finding the Right Impulsive Leg
You should always use Fibonacci retracement on the impulsive leg, rather than the correction. A solid, impulsive leg typically shows
- clear directional candles that don’t overlap much,
- a solid break above or below a previous structural level, and
- momentum that really stands out compared to what came before
This leg is where control really shifted to either buyers or sellers. If you measure something that’s not as strong, it can make Fibonacci less useful.
Step 3: Interpreting the Fibonacci Retracement Zone
The retracement zone displayed by the Auto Fibonacci tool, typically between the 38.2% and 61.8% levels, should be viewed as a decision environment, not an entry location. This zone represents the area where early trend participants can take partial profits, and late participants would usually attempt to join the trend.
As for institutions, they assess whether the continuation itself will remain favorable or turn its head. Price behavior in this zone provides more information than the level itself.
Read: How to use Moving Averages to improve your day trading performance?Step 4: Assessing Pullback Quality in the Fibonacci Zone
Not every retracement is the same, even if they hit the same Fibonacci levels. A good pullback usually shows: a slow move into the retracement area, slow candle bodies compared to the previous push, and lock wicks, which likely suggest rejection and uncertainty ahead.
You will, however, see respect for the trend channel boundaries here. Be on the lookout for a poor pullback, which tends to have a few noticeable characteristics:
- Big opposing candles that close strongly
- Quick movement through the retracement zone
- Breaks in the trend channel structure
When you see aggressive pullbacks, it often points to a shift in who’s in charge of the market, rather than just a chance to keep the trend going.
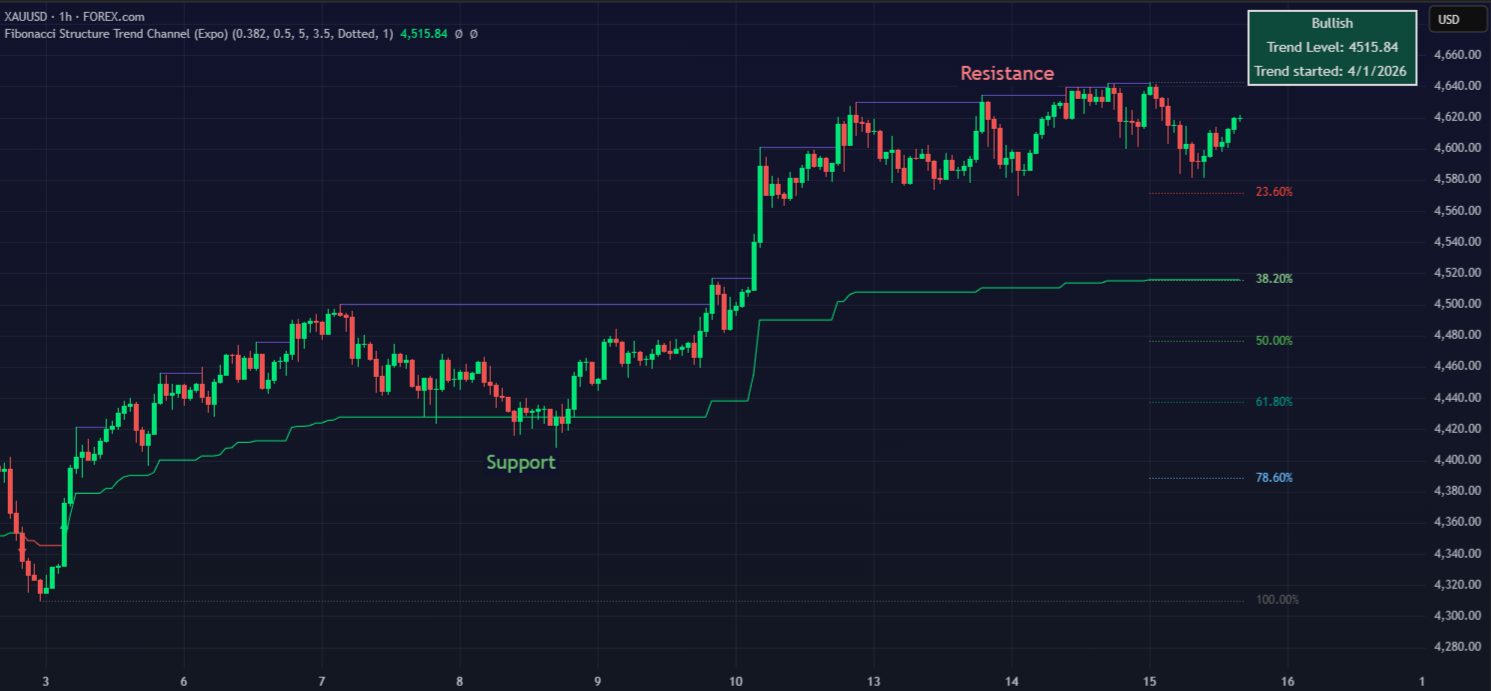
Step 5: Using the Trend Channel as Structural Confluence
Many of the community members rely on Zeiierman’s Auto Fibonacci Retracement and Fibonacci Structure & Trend Channel. It acts as a structural filter that helps determine whether Fibonacci retracement zones are tradable. High-probability setups occur when the Fibonacci retracement zone overlaps the lower boundary of the bullish channel or the upper boundary of the bearish channel
Previous Auto Fibonacci structures align with the current retracement, and price reacts multiple times within the same zone without breaking the structure. This alignment suggests that the retracement is being absorbed rather than rejected.
Step 6: Execution Using Lower-Timeframe Confirmation
Execution is refined on the lower timeframe once the price stabilizes within the Fibonacci retracement zone.
Here are some specific conditions that I would take for valid entrypoints:
- A clear break of corrective micro-structure in the direction of the trend
- Strong continuation candles emerging from the Fibonacci zone
- Rejection wicks followed by decisive closes back into the channel
Entries are taken only after the market confirms continuation, not during the pullback.
Step 7: Stop Loss placement is determined by structural failure, not Fibonacci percentages.
For the bullish setup, place your stops below the channel boundary that supports the trend and the most recent corrective low formed inside the Fibonacci zone. For a bearish setup, place your stops above the most recent corrective high and the channel boundary that’s acting as resistance.
If the trend channel fails, the trade thesis is invalid.
Common Mistakes to Avoid with Fibonacci Retracement Levels
1. Using Fibonacci retracement levels in isolation without trend context.
One of the most frequent mistakes traders make is applying Fibonacci retracement levels without first identifying a clear directional trend. Fibonacci works best when applied to pullbacks within an established trend, not when the price is moving sideways or forming an unstable structure.
2. Entering trades simply because the price touches a Fibonacci level.
Relying on Fibonacci retracement as a guaranteed buy signal can get pretty expensive. Just because the price hits a retracement level doesn’t mean the pullback is over. If there’s no solid evidence that the market has accepted that level, like breaking a corrective structure or going back into the trend channel, the trade turns into more of a gamble instead of a smart reaction.
3. Assuming Fibonacci levels act as exact reversal points.
Many traders think the price will bounce back exactly at the 38.2, 50, or 61.8 levels, so they jump in and place limit orders without waiting for confirmation. But the truth is, Fibonacci retracement zones are just spots where the price might react, not definite reversal points.
Prices often go beyond these levels, hover around them, or test them.
4. Ignoring market structure and relying only on percentages.
Fibonacci levels gain real meaning only when they align with market structure, such as prior highs, lows, trend channels, or consolidation zones. Traders who focus only on percentage levels, without considering structure, often find themselves trading levels the market does not recognize. Structure reflects real participation and order flow, while percentages alone do not.
5. Forcing Fibonacci onto every market condition.
Fibonacci retracement levels don’t really work in every market situation. In choppy, low-volatility, or news-driven markets, prices often skip retracement zones. Trying to force Fibonacci setups in such environments will get you mixed results and a lot of frustration, mainly because the market just isn’t structured enough to show clear retracement patterns.
Zeiierman
With over 16 years in the market, Zeiierman has extensive experience as a full-time trader and risk advisory consultant for hedge funds. He has developed many profitable trading strategies, drawing on his background in risk management and strategy execution.
More from Zeiierman