Ever had a killer idea? You know, the one where the charts line up, and you just know you’ve found an edge in the market? That flash of clarity is cool, but intuition alone doesn’t execute successful trades. Real traders don’t trade based on hunches; they have a reliable system to prove their ‘idea’ is worth executing.
And that’s called backtesting. Being able to backtest your own trades and ideas is what makes a beginner/learner into a professional trader. Otherwise, you’d be no different from a sports commentator making guesses based on their experience – worth something, sure, but not enough to put your money on the line.
So, back to the million-dollar question (literally): how does one build a robust backtest system from the ground up? It’s gotta be a monumental task that requires money and tools, no? Yes and no. Let’s build it, and you’ll know why. As usual, we’ll start from the fundamentals.
What is backtesting, and why is it important?
Backtesting is the process of applying a trading strategy to historical market data to see how it would have performed. It showcases the potential profitability, risks, and weaknesses of that strategy before risking real money, and it’s essential for validating ideas, refining the rules, managing risk, and building confidence in your trading game.
When you finish building and auditing a system, it will be tested by the data and results it gives, not your feelings. You should focus on core outcomes that tell the real story, which include net profit, max drawdown, profit factor, win rate, average trade, trades count, and exposure.
How to build a backtesting script using AI?
In this strategy, we’re building a backtesting script using GenAI. I’ll be using ChatGPT, but you can use any model you prefer.
Step 1: Turn ideas into empirical rules.
Every good strategy begins with a solid idea. The magic happens when you take that idea, turn it into something objective, and build a basic framework from it.
You must give clear instructions to the AI model rather than vague prompts like “Buy when there’s a strong uptrend” or “Sell when the price looks overbought.” These phrases are useless. Due to hallucinations and a lack of broader market context, AI models generally suck at trading. However, they’re excellent at following instructions without bias.
You need to translate your intuition into explicit, testable rules that a model can read:
- Entry Rules: Replace “strong uptrend” with “IF the Close is greater than the 20-period Exponential Moving Average (EMA) for five consecutive closing bars.”
- Exit Rules: Define your stop-loss, take-profit, and even time-based exits (e.g., Exit the trade after 20 bars, regardless of price.).
- Context Filters: What conditions must be met for the trade to proceed? Maybe you only trade the US session, or only when the volatility (ATR) is below a certain threshold. It could be a broad condition or a specific scenario, depending on your trading style and approach.
Define every parameter clearly and set some non-negotiable limits. These parameters will protect you from chasing bad ideas. Here are a few examples:
- Markets and Timeframes: Be specific about the session time period and the asset you want to trade (e.g., BTC/USD 1-hour chart only). You will be able to provide better quality data to the model if you select a specific market and asset.
- Define (auto) failure conditions: We’re not throwing good money on bad trades. For this project, let’s say: If the initial test of the core logic results in a Profit Factor (PF) of less than 1.2 or a Max Drawdown (DD) of greater than 20%, we kill the idea – this indicates the model to move on and find a better setup.
Step 2: Use AI as your Pine script Co-Pilot
Backtesting gets a whole lot easier once you stop treating Pine Script like a puzzle you must solve alone. Modern AI tools (or models), whether it’s ChatGPT, Gemini, Claude, or any other trading-specific AI models, can act like a fast, always-available Pine engineer who can take your rough trading ideas and turn them into reproducible results.
Tip: Do not use AI to invent the strategy for you. Usable backtesting models aren’t built on hallucinations. You make the strategy, AI builds the scaffolding for you.
Your edge comes from your market understanding. AI is simply the mechanic that helps you build the vehicle faster, so you can spend your time driving it. Instead of manually coding commands in Pine Script, you can prompt the AI to create the framework. For example:
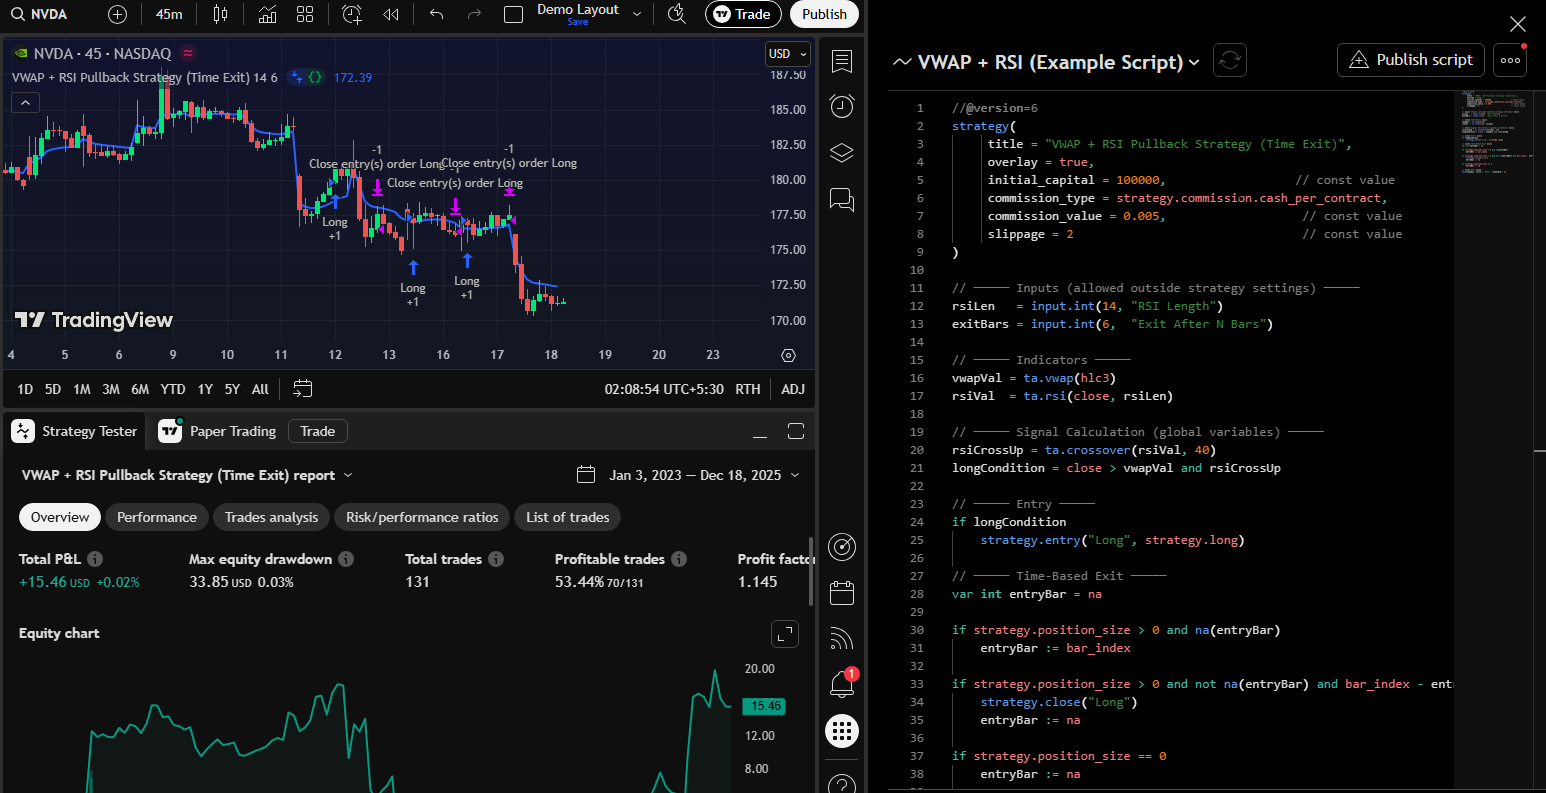
“ Write a basic Pine Script strategy for TradingView that takes a long trade when the Price is above VWAP (trend filter), and RSI crosses above 40 (pullback recovery), and exits 6 bars later. It needs inputs for initial capital, commission ($0.005 per share), and slippage (2 ticks). Add plots for the VWAP + RSI reference levels”.
In seconds, you have a base Pine strategy ready to be iterated upon and dropped into TradingView for testing. This cuts your setup time from an hour to about 90 seconds.

Here is the basic application of the Pine Script obtained from the above given prompt. This way, you can create your core entry and exit logic and get a Pine Script from AI by giving a clear and well-defined prompt.
Built-in Diagnostics:
Now, most AI models have become highly advanced, and you can easily use them for testing your strategy itself. For this, request a “sanity-check mode” from your AI. In this mode, the script will only plot signals (arrows and/or labels) without actually placing orders. It lets you visually inspect the system’s logic on the chart before risking any theoretical (or actual) capital.
Add Non-Negotiable Guardrails:
If you take one thing from this entire article, let it be this:
AI won’t automatically build safe, non-repainting, realistic code. You must clearly specify the login and execution behind your guardrails so your AI script-maker can write a control mechanism that gives realistic outputs.
Here are the essentials:
- Avoid Repainting: Repainting happens when an indicator recalculates based on future data. Give clear instructions like “No future data references” and “No intrabar evaluation unless specified”.
- Confirm-on-Close Logic: Ensure that entry conditions are only checked and executed after the bar has fully closed. It eliminates the risk of acting on temporary intrabar price moves.
- Explicit Cost Inputs: Demand clear inputs for commission, slippage, and borrowing costs for shorting. If you don’t model these real-world frictions, your fantastic Profit factor of 1.20 might become a losing 0.98.
Step 3: Build the baseline backtest.
The real testing begins once you have the scaffold in place. My advice? Start simple, like really simple. The initial run is all about stress-testing the core premise of your trade.
Your first version must include only the core entry and exit logic. Don’t think about trend filters, volatility gates, or advanced timing mechanisms just yet. If the initial simple strategy, I mean the heart of your idea, doesn’t show promise, the complex version won’t save it. You’re simply polishing a useless idea.
Before running the test, go into the TradingView Strategy Tester settings and set the stage for reality:
- Commission & Slippage: Be conservative. Use your broker’s actual commission rate and add slippage (maybe 1-2 ticks for liquid assets, more for futures or low-volume stocks).
- Initial Capital: Use a realistic amount as it affects position sizing and drawdown interpretation.
- Order Sizing/Pyramiding: Define whether you use a fixed dollar amount, a percentage of equity, or allow pyramiding (adding to a winning position).
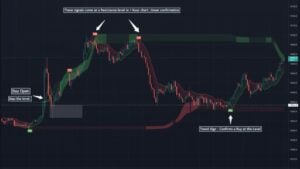
The most critical step after the initial run is to inspect 20–50 trades on the chart visually. Some use the paper trading mode on the TradingView platform or the TradingView rewind tool to go back in time on the chart and remove the predictive nature of knowing where the chart will be headed.
Scroll through the historical data and ask the following questions:
- Did the entry arrow pop up exactly where my rules said it should?
- Did the exit occur due to the stop-loss, take-profit, or the time-based exit?
- Do the arrows/labels precisely match the rules you wrote down in Phase 1?
This eye test is the most effective way to catch coding or logic errors before they skew your entire backtest.
Step 4: Add context and confidence.
If Baseline V1 is sane and shows a PF greater than 1.0, you’ve got something to work with. A good strategy doesn’t trade all the time; it only trades when the market is in the mood.
The Rule: Add one filter at a time. It sounds basic, but it’s the only way to isolate which element is actually adding value. Start by adding the first filter, which can be anything you understand at a fundamental level.
Run the test and compare the new metrics to Baseline v1. If the profit factor and Max drawdown improve, keep it. If not, ditch it immediately. This disciplined approach prevents you from turning your simple V1 strategy into a cluster of redundant indicators that complicate maintenance.
Key Filter Categories:
- Trend Regimes: Use a higher-timeframe MA slope or a dedicated tool to verify the overall direction. We only want to take long trades when the market structure is bullish.
- Volatility Gates: Using the Average True Range (ATR) to avoid choppy, quiet periods. If the volatility is too low, the trade won’t have room to run, and it’ll get chewed up by fees.
- Pressure Confirmation: Tools that track buying vs. selling pressure (like Cumulative Delta) can confirm that institutional money is moving in your direction before you pull the trigger.
Second Opinion for validating logic:
You’ve coded the rules, but what about the market context? It is THE step that catches most traders lacking a shared sense of market dynamics while chasing arbitrary code.
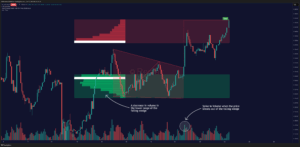
You could spend weeks optimizing a filter until your PF hits 2.5 on the backtest. But if those trades were taken right into major resistance or a key liquidity zone, the logic doesn’t play well. You’ve overfit the code to historical noise. To avoid this and get a good grasp of the context, you can use the Zeiierman AI Chart Analyzer.
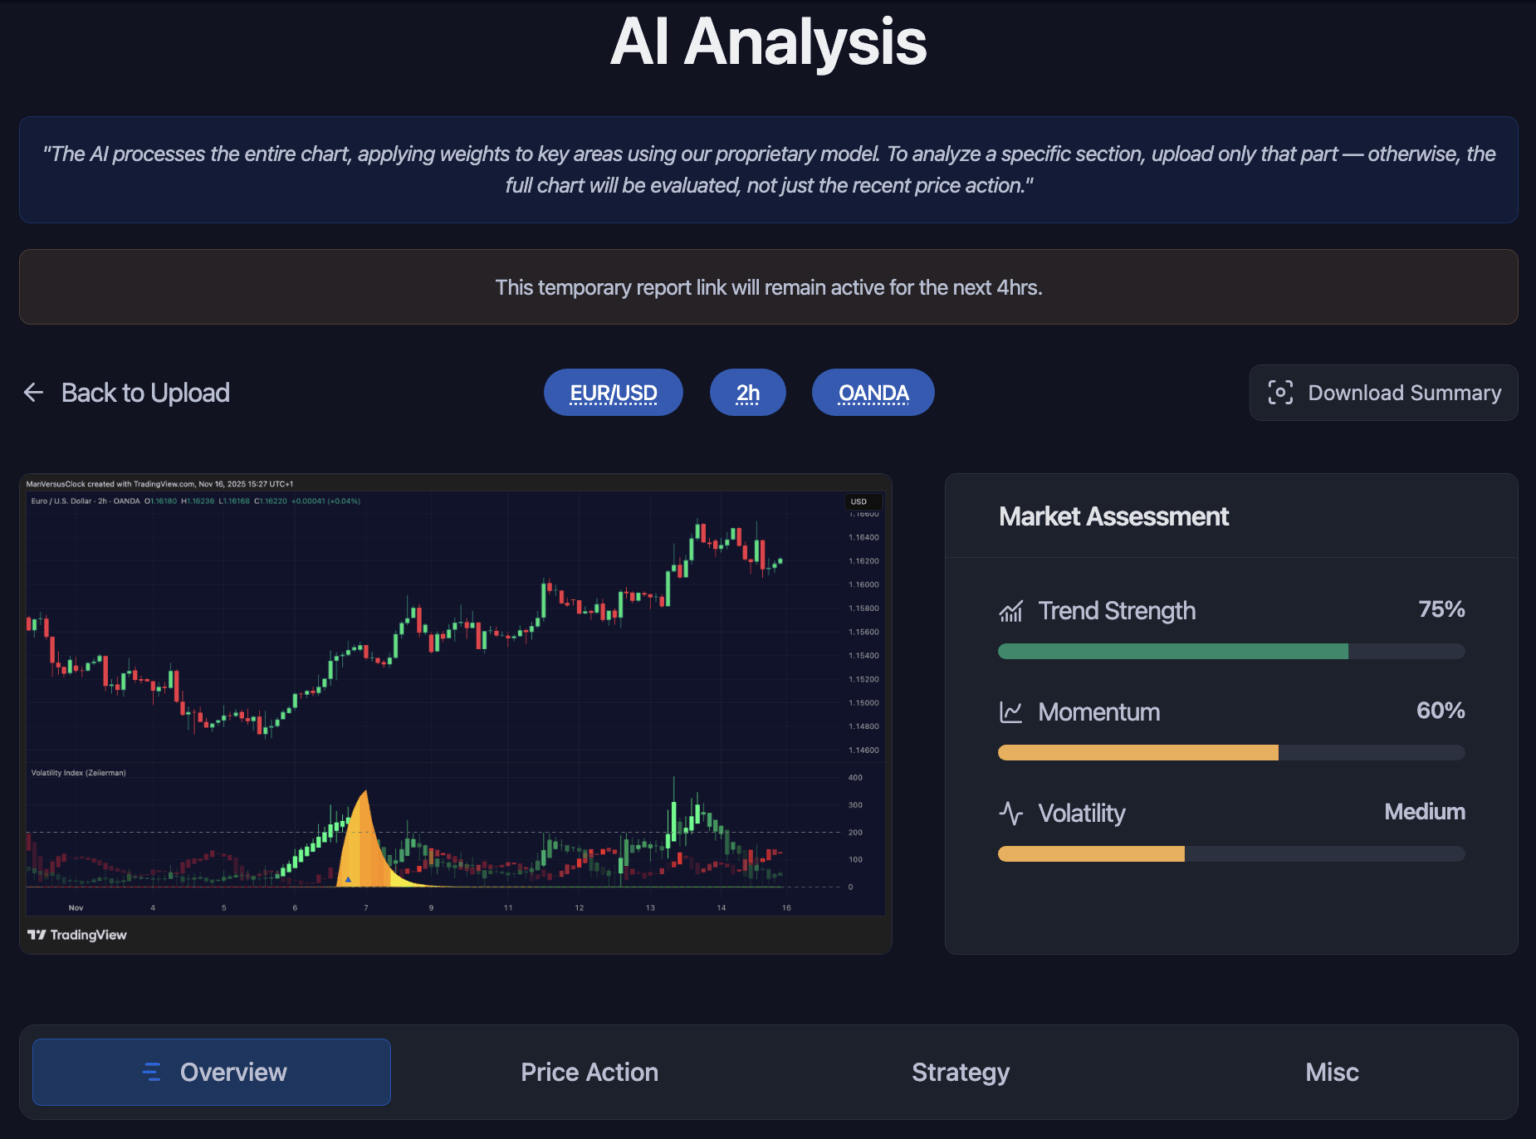
It helps you check:
- Was your entry aligned with momentum?
- Was volatility expanding or contracting?
- Was there a liquidity sweep before your signal?
- Did price pull into a value area or an imbalance?
Most strategies fail not because the code is wrong, but because the idea ignores context. The Analyzer provides a neutral second opinion to help avoid overfitting. Use its insights to refine logic, not to force-fit parameters.
Step 5: Test your backtesting strategy.
If your system looks good after adding filters, it’s time to move it from the test bench to the proving grounds. A strategy is useless if it only works on the data you used to build it.
Due to our general lack of ‘development’ experience, most traders miss an essential step: building and optimizing a strategy using all available historical data. When you do that, your system begins to memorize the dataset instead of learning a repeatable behavior. You end up tuning parameters to fit past price movements that may never occur again.
To avoid this, split your historical data into two blocks:
- In-Sample Data: This portion of the data serves as the training ground. Use it to build the strategy, test ideas, adjust the logic, and fine-tune rules. Usually, traders use around 70% of the available historical data for this.
- Out-of-Sample (OOS) Data: Once your system behaves well on in-sample data, you expose it to the remaining 30% of unused data. It’ll tell you the truth about your strategy.
If the system performs similarly on the training and test data, then your logic is genuinely strong. If performance collapses in OOS, then your system was curve-fit to past environments. Most strategies fail here, and that’s a good thing. It saves you money and shows you precisely what needs refinement. The goal isn’t perfection, it’s consistency across unseen conditions.
Read: The Most Accurate Trading Indicators in 2026To optimize the data, I usually do walk-forward testing. It simulates how your strategy would have performed if you had actually lived through past markets, adjusting your system as conditions changed.
- Optimize your parameters over a short window (e.g., 6 months).
- Test the optimized version on the next 3 months of blind data.
- When those 3 months are done, move the window forward and optimize again.
This tells you if your strategy is constantly adaptable to shifting market conditions.
The final step before going live is a short, dedicated paper-trade forward test. Run the strategy on a demo account in real-time to catch live frictions that backtesting can’t perfectly model: network latency, tiny variations in broker execution, etc. For this, you can use the paper trading option in the TradingView platform.
How to make future iterations of your tool?
Testing is never done. The market evolves, and your system needs controlled updates.
My golden rule is to only change one thing per experiment. Label your versions methodically (V1.1, V1.2, V2.0). If you change the EMA period, the stop-loss, and the volatility filter all at once, you’ll never know which change caused the improvement or the destruction.
Keep a running log of every hypothesis and result:
- Hypothesis: If I tighten the stop-loss to 1.5 ATR, I think the PF will drop, but the Max DD will improve.
- Change: Stop-Loss (SL) changed from 2 ATR to 1.5 ATR.
- Result: PF dropped from 1.35 to 1.28. DD improved from 15% to 12%.
- Action: Keep. (The improvement in risk justified the slight drop in profitability.)
You have to keep a record of every change and effect so that you don’t waste time doing things you’ve already tried.
Common Pitfalls to Avoid
1. Overfitting
Overfitting is when you adjust your system so that it matches past data perfectly, but then it fails miserably in real-life trading. A strategy that uses a bunch of filters or overly fine-tuned settings might look great in backtesting, but it probably won’t hold up when the market changes.
The solution is to keep your logic straightforward, use parameters that have wider ranges, and make sure to test everything with out-of-sample and walk-forward tests before you put any faith in the results.
2. Repainting
A repainting strategy changes past signals when new candles appear, which means the backtest is showing a world that never existed. It makes entries look cleaner, exits look smarter, and drawdowns look smaller than they actually were. If your script relies on intrabar estimates, future data, or non-confirmed signals, you’re not testing reality, but you’re actually testing hindsight.
3. Unrealistic Costs
Most traders underestimate how deeply transaction costs eat into returns, especially on lower timeframes or high-frequency signals. A strategy that looks profitable on paper can turn negative the moment you add spreads, slippage, commissions, and overnight borrow fees for shorts. Real markets aren’t ideal, you pay for every interaction, and those micro-costs can stack up fast. Always model realistic trading conditions inside TradingView, so your backtest reflects how the strategy will behave when actual money is on the line.
4. Survivorship Bias
Relying only on assets that have done well in the past can lead to some major disappointments. It’s easy to think the market looks great when you’re only seeing the success stories and the failures have either been wiped out, overlooked, or just faded away. A solid trading strategy should perform consistently across various stocks, sectors, market conditions, and even different time periods. You’ll gain way more insights by testing your strategy on those ‘ugly’ charts than on the ones that seem straightforward and reliable.
5. Signal Clutter
It’s tempting to keep adding filters to smooth your equity curve, like maybe one extra trend filter, a volatility gate, a volume threshold, a session rule, and so on. After a point, you aren’t improving the logic, you’re suffocating it. A strategy with too many conditions becomes fragile, hard to execute, and overly dependent on a very specific environment. Strong systems usually rely on a small set of rules that work consistently, not a long list of conditions that only worked in the past ten years of perfect data.
Zeiierman
With over 16 years in the market, Zeiierman has extensive experience as a full-time trader and risk advisory consultant for hedge funds. He has developed many profitable trading strategies, drawing on his background in risk management and strategy execution.
More from Zeiierman