Works on the Following Platforms
TradingView
For use on the TradingView platform
The Relative Strength Index (RSI) and the Exponential Moving Average (EMA) are two popular indicators. Traders use these indicators to understand market trends and predict future price changes. However, traders often wonder which indicator is better: RSI or EMA.
What if these indicators give similar results? To find out, we wanted to study the relationship between RSI and EMA. We focused on a hypothesis: when the RSI goes above 50, it might be similar to the price crossing above a certain length of EMA. Similarly, when the RSI goes below 50, it might be similar to the price crossing below a certain length of EMA.
Our goal was simple: to figure out if there is any connection between RSI and EMA.
Conclusion: Yes, it seems that there is a correlation between RSI and EMA, and this indicator clearly displays that relationship. Read more about the study here!
Overview of the indicator
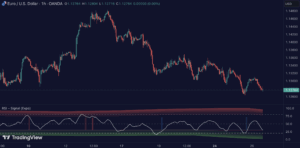
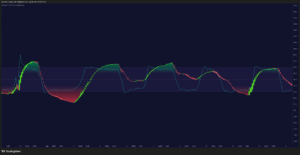
The RSI Exponential Smoothing indicator displays RSI levels with clear overbought and oversold zones, shown as easy-to-understand moving averages, and the RSI 50 line as an EMA. Another excellent feature is the added FIB levels. To activate, open the settings and click on “FIB Bands.” These levels act as short-term support and resistance levels which can be used for scalping.
Benefits of using this indicator instead of regular RSI
The findings about the Relative Strength Index (RSI) and the Exponential Moving Average (EMA) highlight that both indicators are equally accurate (when it comes to crossings), meaning traders can choose either one without compromising accuracy. This empowers traders to pick the indicator that suits their personal preferences and trading style.
How it works
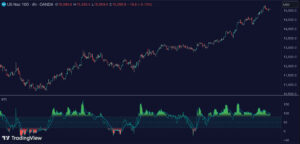
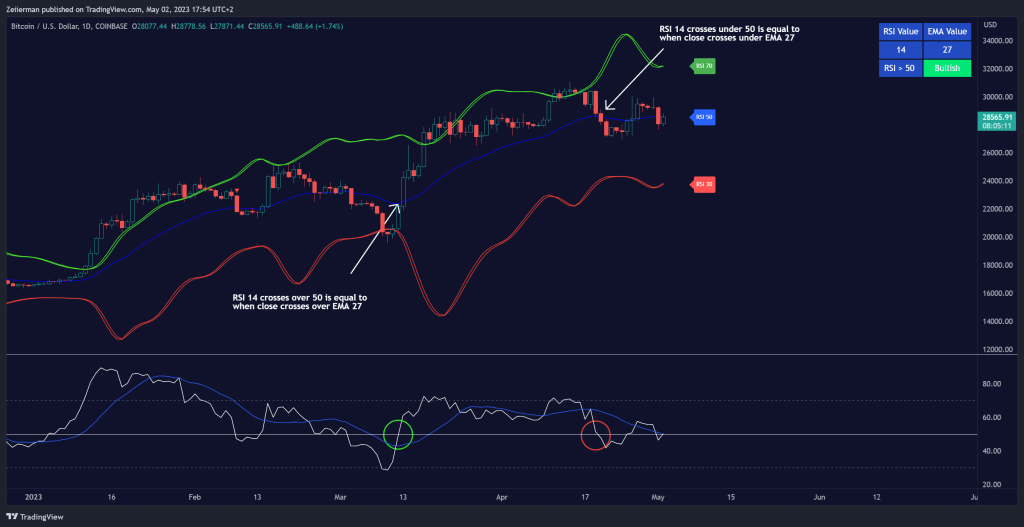
Crossings over/under the value of 50
The EMA line in the indicator acts as the corresponding 50 line in the RSI. When the RSI crosses, the value 50 equals when Close crosses the EMA line.
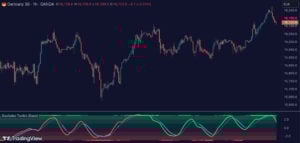
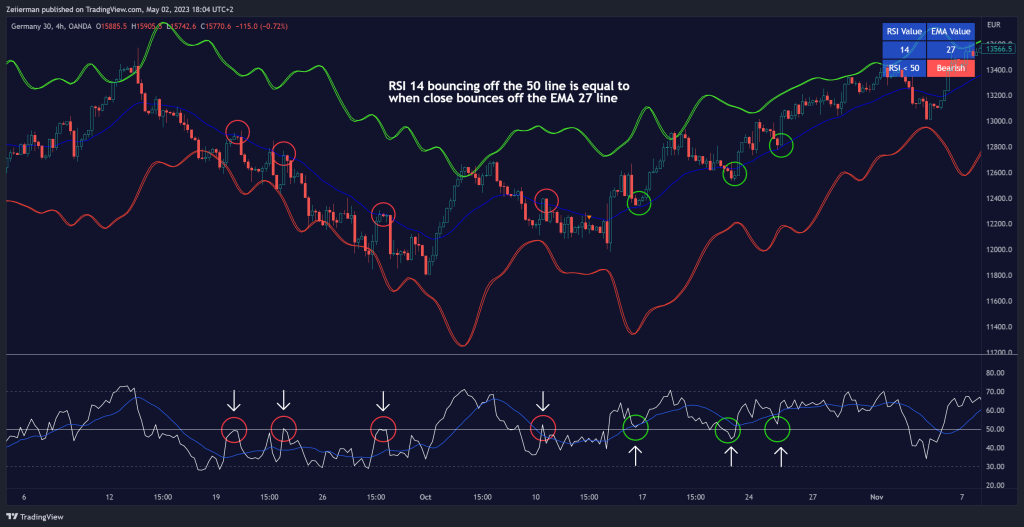
Bouncess from the value 50
In this example, we can see that the EMA line on the chart acts as support/resistance equals when RSI rejects the 50 level.
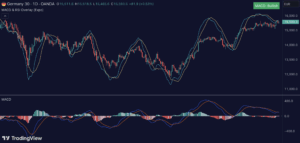
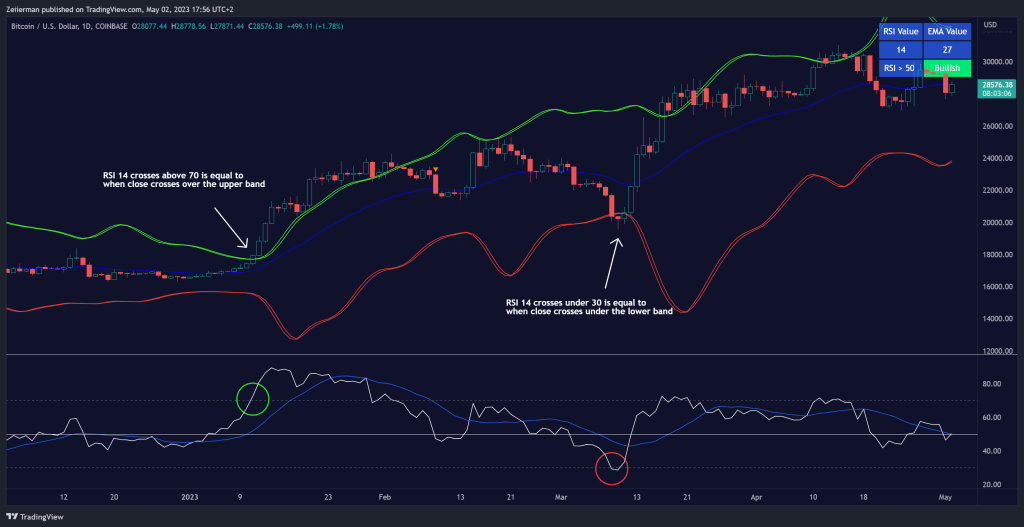
Overbougt and Oversold
The indicator comes with overbought and oversold bands equal when RSI becomes overbought or oversold.
How to use
This visual representation helps traders to apply RSI strategies directly on the price chart, potentially making RSI trading easier for Traders.
Zeiierman
With over 16 years in the market, Zeiierman has extensive experience as a full-time trader and risk advisory consultant for hedge funds. He has developed many profitable trading strategies, drawing on his background in risk management and strategy execution.
More from Zeiierman