Works on the Following Platforms
TradingView
For use on the TradingView platform
ATR Trend & ATR Top/Bottom is a momentum-and-volatility indicator that blends an oscillator with adaptive trend filtering and ATR-based reversal detection. It helps traders spot turning points, align with the prevailing trend, and manage trades with dynamic trailing stops.
This tool performs exceptionally well in established, long-term trends. Its signals are most effective once the trend has matured and demonstrated consistent strength, allowing traders to follow the direction of the market with greater confidence and reduced noise.
1. Oscillator Feature with Signals
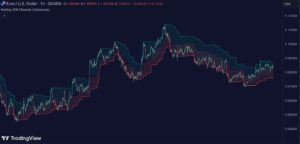
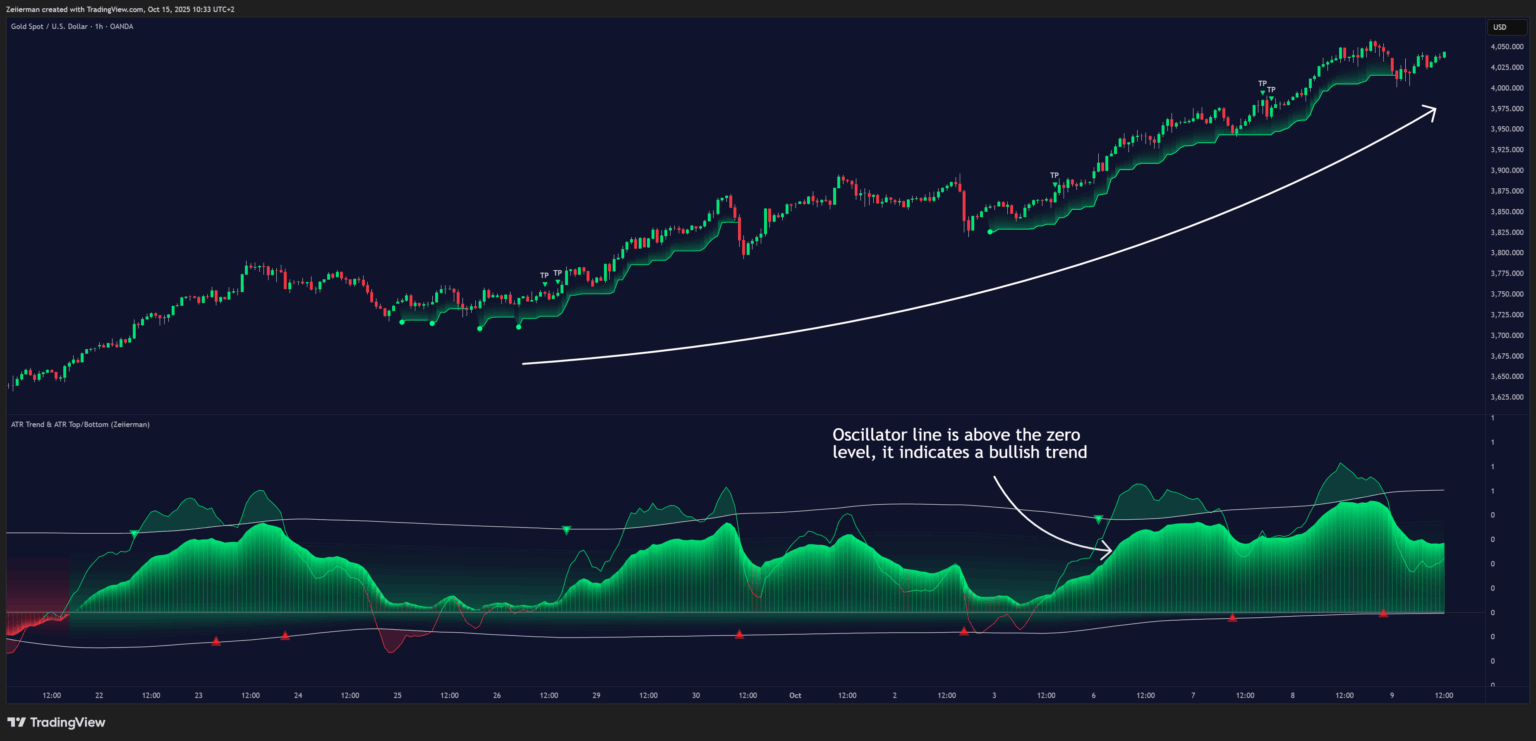
The Oscillator Feature offers a clear visual representation of both momentum shifts and the overall trend direction. It helps traders easily identify whether the market is trending upward or downward, providing a reliable view of trend strength and alignment.
The signals generated by the oscillator are based on pullbacks within the existing trend, allowing traders to enter in the direction of the dominant move rather than against it. This makes it a highly effective tool for trend trading, as it highlights moments when momentum is likely to resume after a temporary pause.
Simple to read and interpret, this feature is suitable for both beginners and experienced traders who want to trade confidently with the trend.
2. ATR Top/Bottom Feature
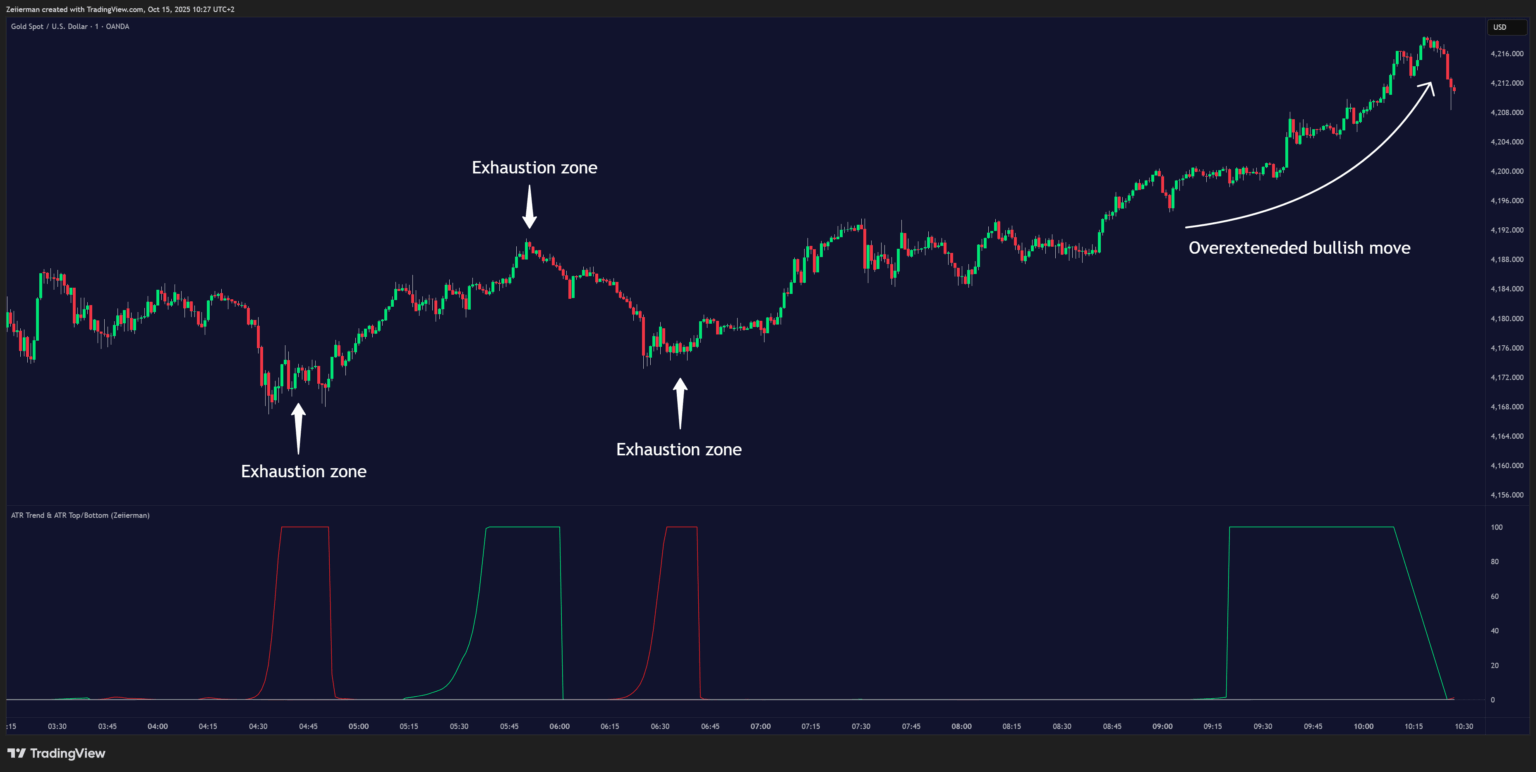
The ATR Top/Bottom Feature identifies high-probability exhaustion zones within the market. These zones act as potential “Top” and “Bottom” areas where price may pause, reverse, or accelerate.
It can be used as a confirmation tool for reversals or as a warning indicator for potential overextended price conditions.
3. How to Trade with ATR Trend & ATR Top/Bottom
A. Trend Following
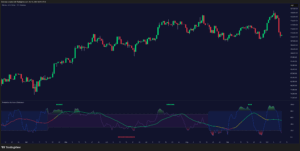
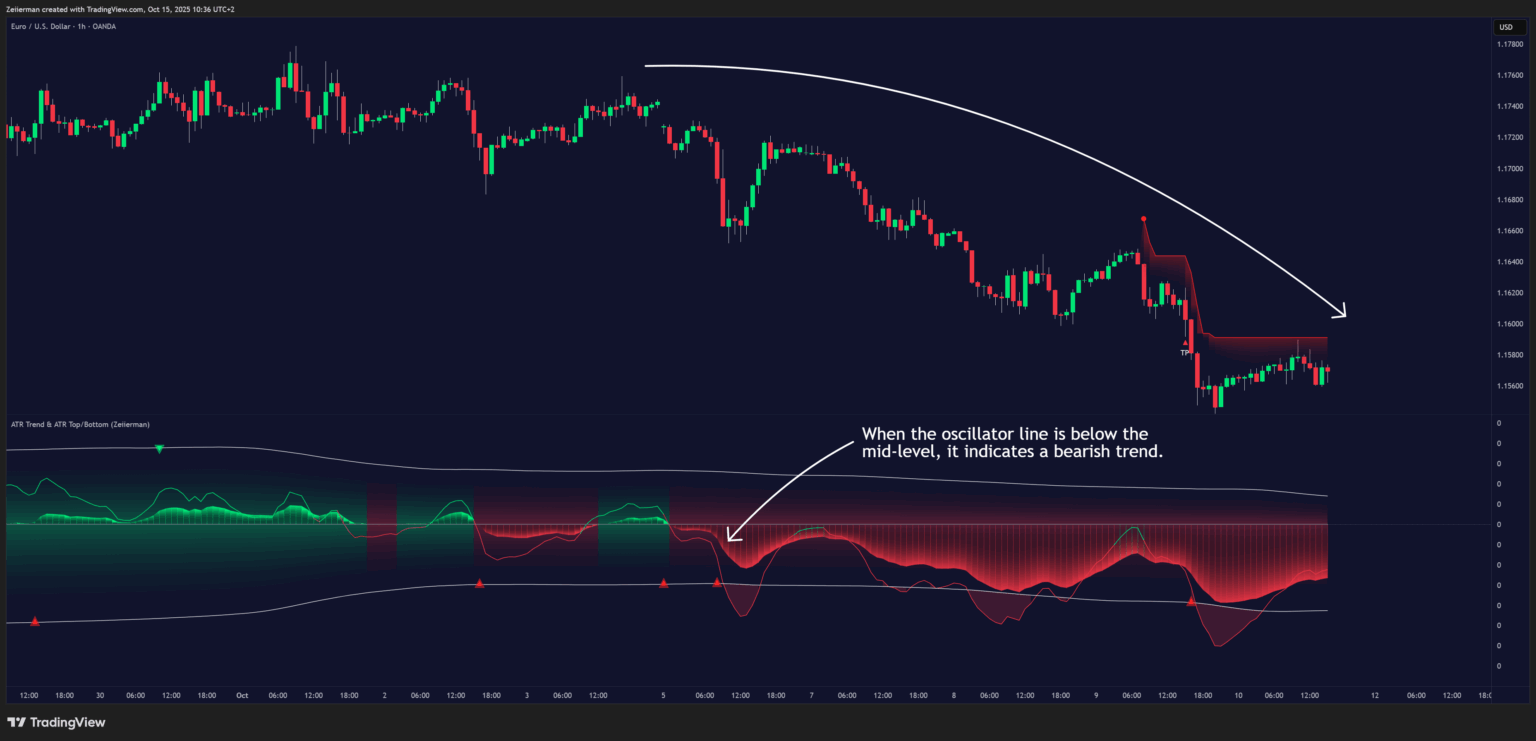
When the oscillator line is above the mid-level, it indicates a bullish trend. When it is below mid, it signals a bearish trend.
The color of the oscillator line also changes with trend direction, making it easy to visually identify whether the market is in an uptrend or downtrend. This helps traders instantly understand the market bias and align their trades accordingly.
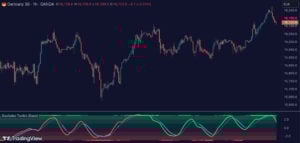
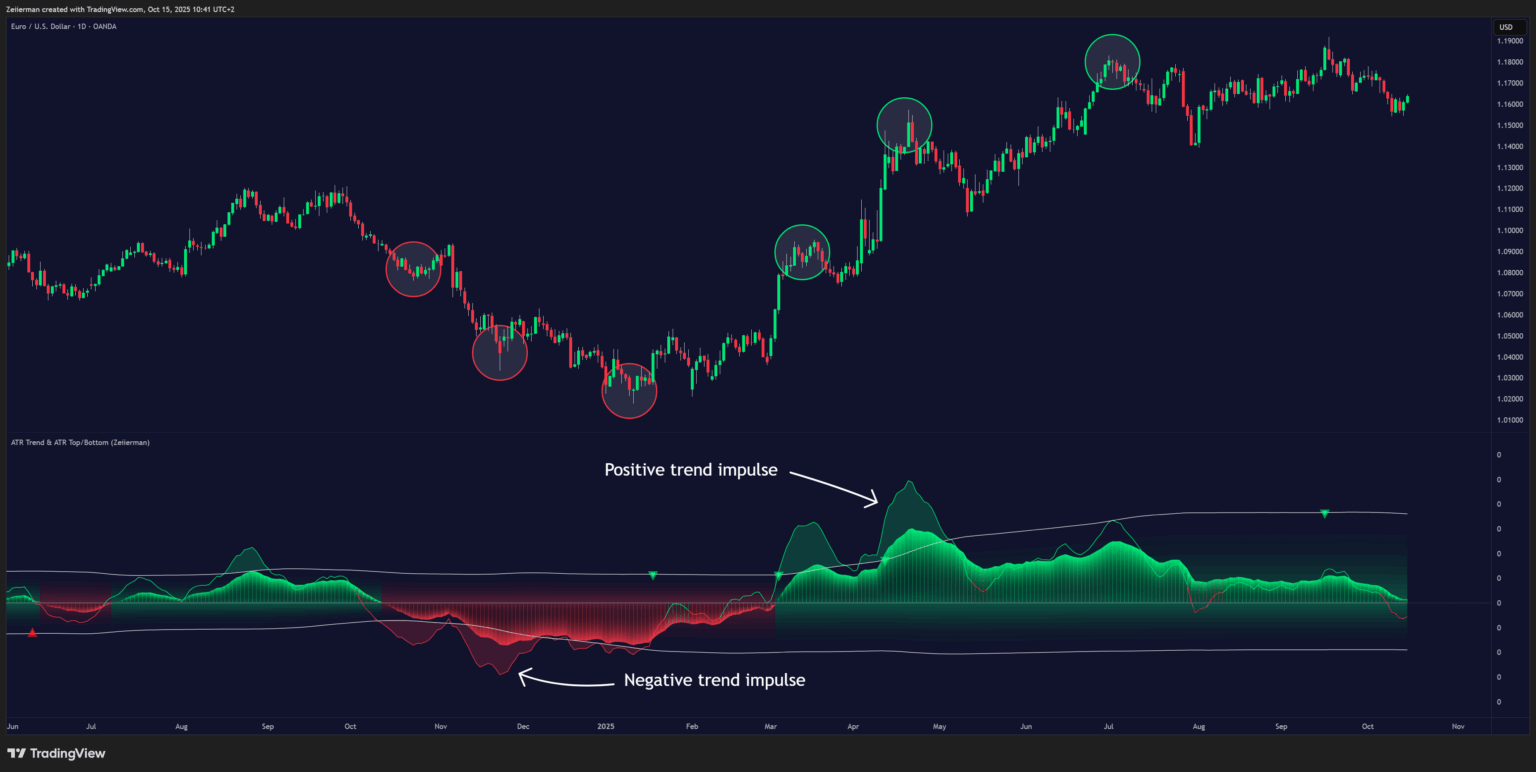
B. Trend Impulses
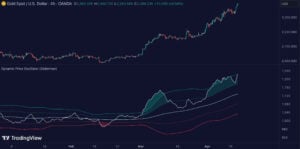
The fast-moving oscillator line shows impulses within the trend direction — short bursts of strong momentum.
- When the oscillator line crosses above the upper band, it signals a positive trend impulse, meaning price is moving strongly upward. This condition is often followed by a short-term pullback before the trend continues.
- When the oscillator line crosses below the lower band, it indicates a negative trend impulse, showing strong downside momentum within a bearish trend. This can also be followed by a temporary retracement.
Each time the fast oscillator crosses either the upper or lower band, it reflects overbought or oversold conditions within the prevailing trend. These moments are ideal for taking partial profits or scaling out of positions while maintaining your core trade with the trailing stop.
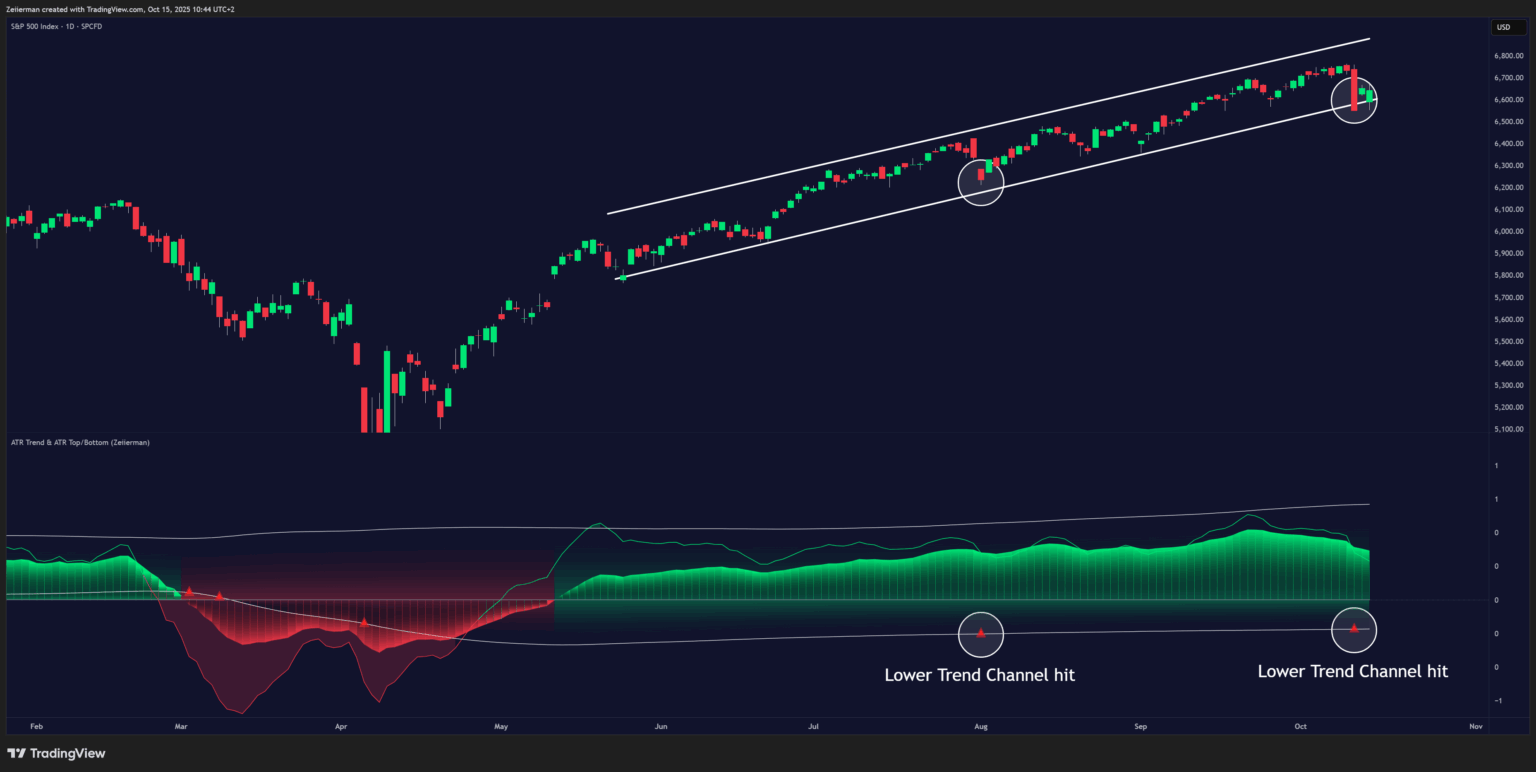
C. Trend Channel Hits
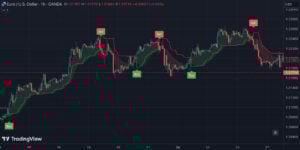
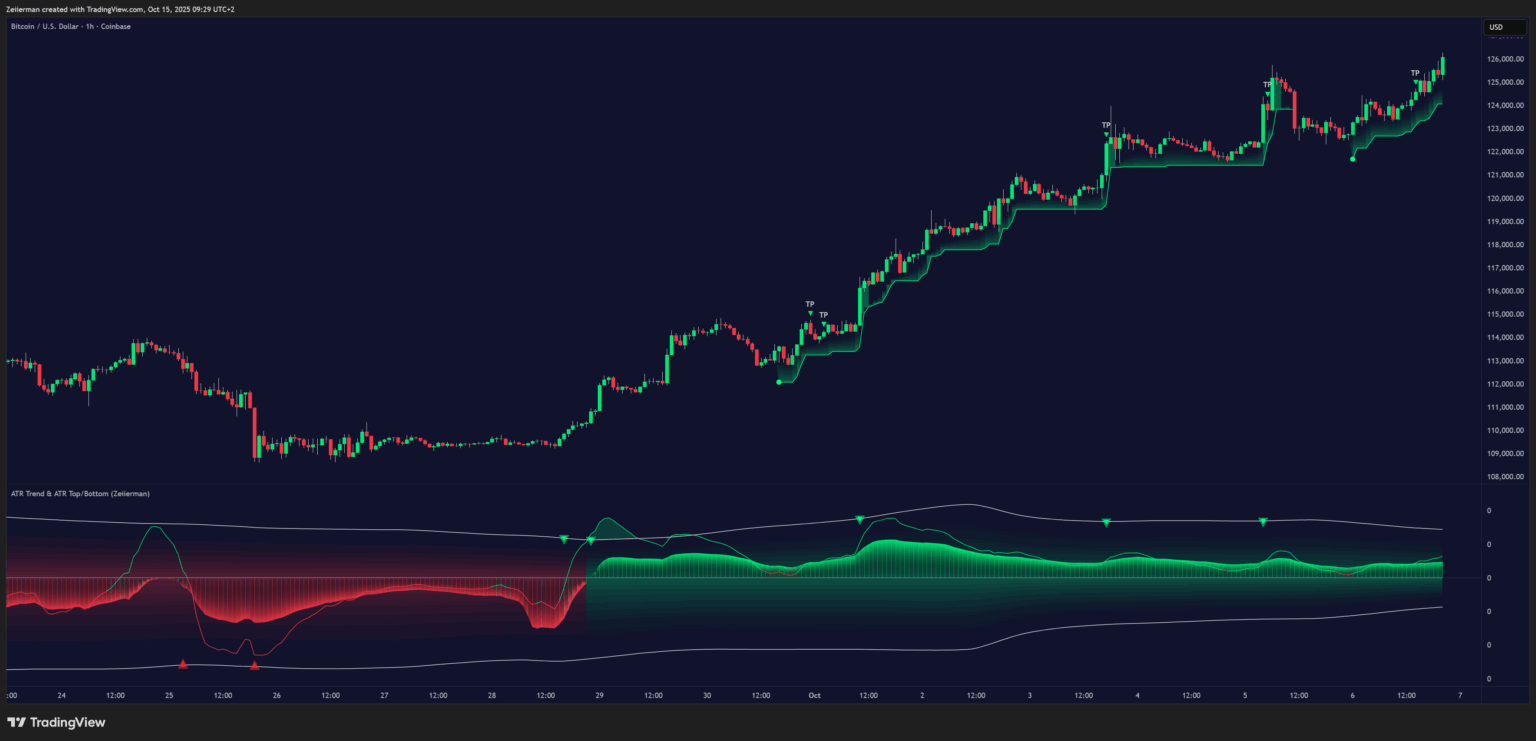
Green and red arrows appear when price crosses above or below a projected trend channel line.
- Green arrows suggest a potential downward continuation or the start of a bullish phase.
- Red arrows indicate possible upward continuation or early signs of a bearish shift.
These areas can act as early warnings of trend changes or as confirmation zones for re-entry in the trend direction.
D. Reversals and Extended Strong Trends
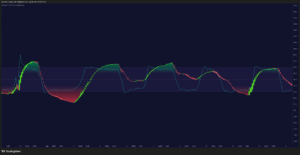
Enable the ATR Top/Bottom feature to visualize areas of strong momentum and potential exhaustion.
- A red peak represents a period of intense selling pressure, signaling that the market is dropping quickly. This can sometimes lead to a reversal, or if the red momentum continues, it confirms a strong ongoing downtrend.
- A green peak shows strong bullish momentum, indicating aggressive buying pressure. If the green momentum extends, it confirms a powerful uptrend, but if it fades, it can mark the beginning of a reversal.
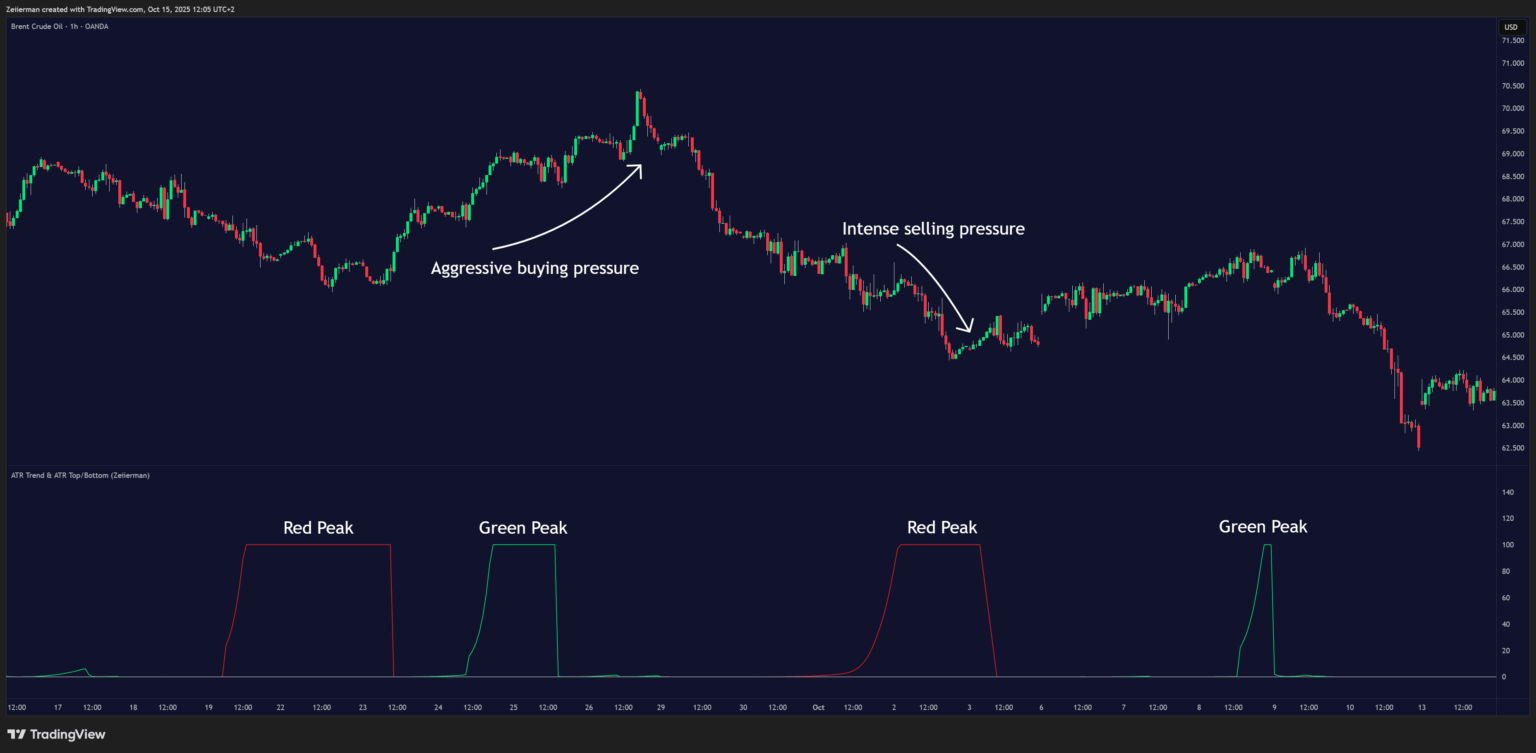
These momentum peaks help traders identify when a move is overextended or when the market may be gearing up for a trend continuation or reversal.
4. Simple Strategy: ATR Trend & ATR Top/Bottom
Goal: A simple trend-following strategy designed to capture strong, established market movements.
This approach focuses only on confirmed long-term trends that have matured and developed over time. The goal is to follow the signals and trailing stop plotted by the indicator, allowing traders to participate in sustained price momentum with minimal decision-making. It works best when the market is trending clearly and has shown consistent directional strength.
Settings: Set the Trailing Stop to 2 and leave all other settings at their default values.
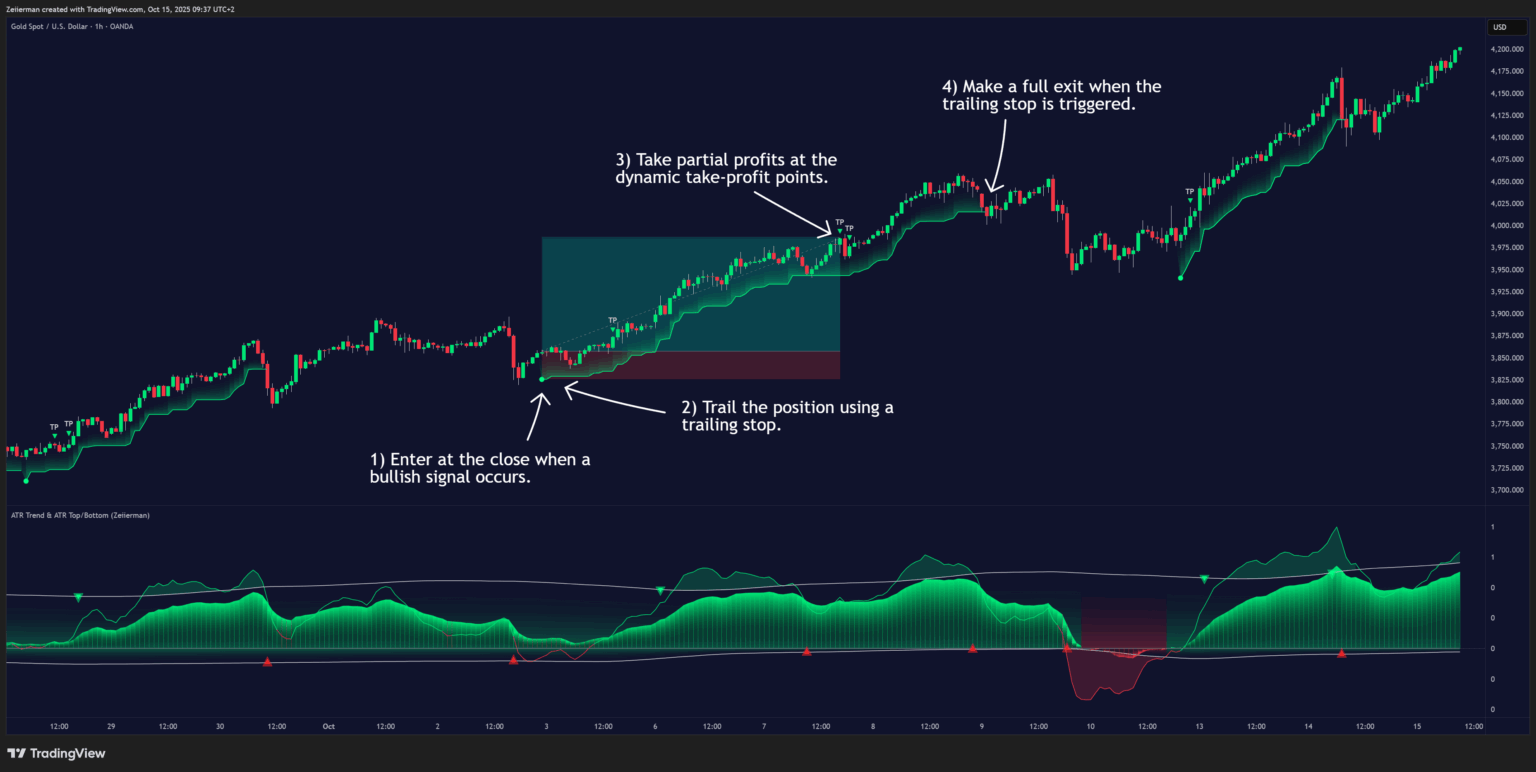
A. Long Setup (Step-by-Step)
Trigger: Wait for a bullish signal to appear on the chart, confirming alignment with the active long-term trend. Allow the signal candle to fully close before taking action.
Entry: Enter a long position on the close of the signal candle.
Stop Loss: Set your stop loss at the trailing stop level plotted by the indicator. This will automatically adjust as price moves in your favor.
Take Profit: Take partial profits at the first dynamic take-profit level displayed on the chart, and exit the full position when the trailing stop is hit.
This ensures that profits are secured progressively while allowing the remainder of the trade to follow the trend until natural exhaustion.
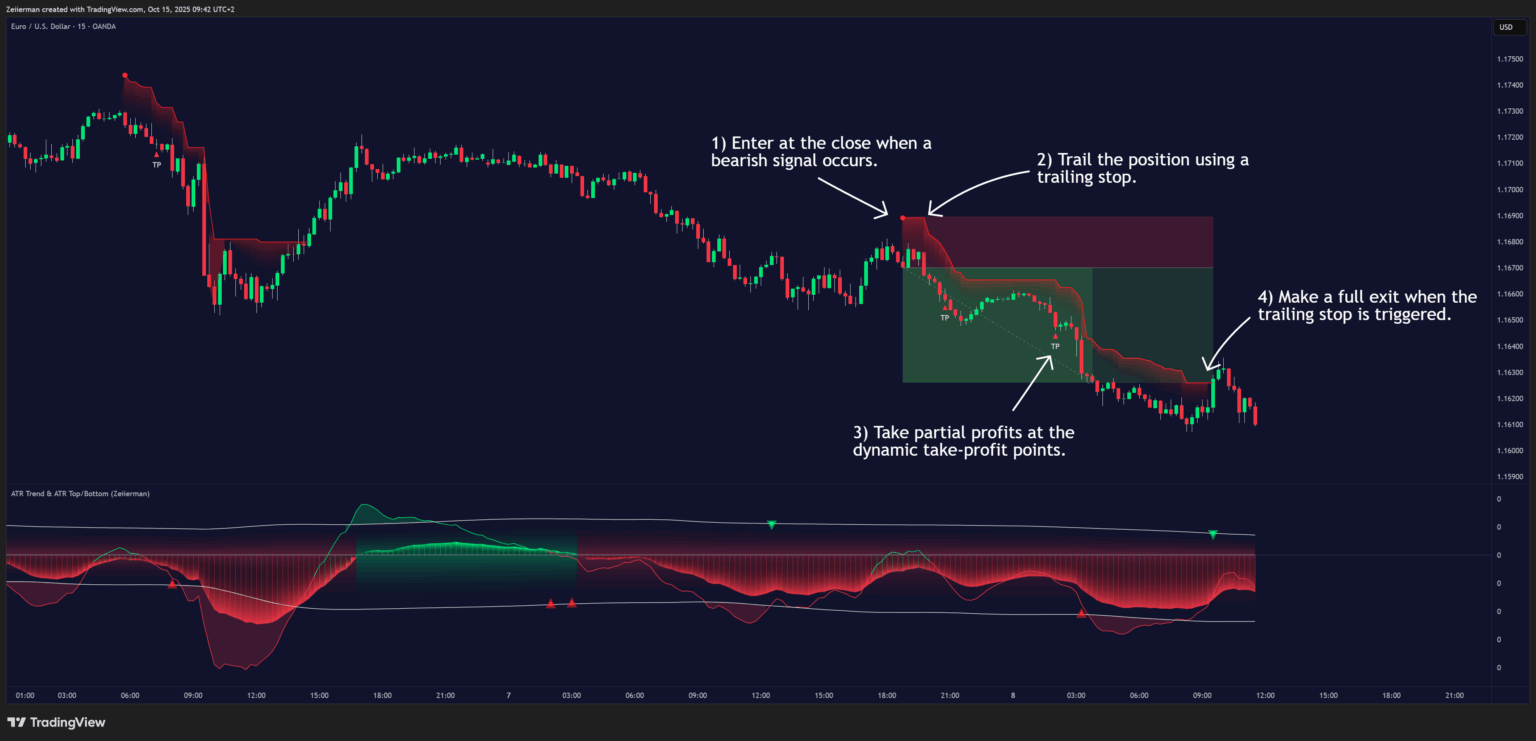
B. Short Setup (Step-by-Step)
Trigger: Wait for a bearish signal to appear on the chart, confirming alignment with the active downtrend. Allow the signal candle to fully close before acting.
Entry: Enter a short position on the close of the signal candle.
Stop Loss: Set your stop loss at the trailing stop level plotted by the indicator. It will automatically trail as the price moves lower.
Take Profit: Take partial profits at the first dynamic take-profit level, and close the remaining position when the trailing stop is reached.
This approach allows traders to follow the strength of the existing bearish trend while managing risk and profit systematically.
5. Settings Explained
Trend Section
Fast Trend
Controls how quickly the indicator reacts to market changes.
- Lower values → more sensitive and responsive for shorter trades.
- Higher values → smoother trend tracking for swing and position trading.
Smooth
Adjusts how fluid the signal transitions appear.
- Lower values → faster reaction to changes.
- Higher values → filters out smaller fluctuations.
Slow Trend
Defines the broader market direction.
- Lower values → reacts to shorter-term trend shifts.
- Higher values → focuses on the bigger picture and filters noise.
Trailing Stop
Determines how close the protective stop follows price movement. Tune according to volatility and your trading style.
- Lower values → tighter trailing stop for fast markets.
- Higher values → allows more breathing room for larger trends.
Trend Filter Section
Trend Filter
When enabled, it filters out trades that go against the prevailing market trend.
Focuses on high-probability trades in the direction of the dominant movement.
Trend Length
Defines the scope of the trend being analyzed. Adjust based on whether you scalp or swing trade.
- Lower values → detect short-term trends.
- Higher values → reveal long-term structures.
Trend Flexibility
Controls how adaptive the trend model is to changes in price movement.
- Lower values → stricter trend definition, fewer but stronger signals.
- Higher values → more dynamic response to volatility.
Trend Sensitivity
Sets how tolerant the model is to fluctuations. Adjust to balance between reactivity and stability.
- Lower values → quicker reversals.
- Higher values → smoother, steadier trends.
Trend Channel Hit
Highlights moments when price interacts with the trend channel boundaries. Useful for identifying re-entry or profit-taking zones that align with the main direction.
ATR Top/Bottom Section
Enable ATR Top/Bottom
Master switch for displaying reversal zones.
- Turn on to view potential top and bottom regions.
- Turn off for a cleaner chart while adjusting trend settings.
Source
Selects the data source for calculations. Default is closing price; alternative sources can smooth out visual signals during high volatility.
Length
Defines how wide or narrow the reversal zones appear.
- Shorter → faster and more frequent signals.
- Longer → broader and more stable zones.
Sensitivity
Controls how easily reversal zones appear.
- Lower → more signals.
- Higher → fewer, stronger signals.
ATR Trend Length
Determines the broader volatility environment. Adjust according to your timeframe.
- Shorter → focuses on short-term impulses.
- Longer → captures major trend shifts.
Contrarian Signals
When enabled, highlights possible countertrend setups at volatility extremes. Best used in ranging or sideways conditions.
Signal Limit
Sets how strict the trigger threshold is for ATR-based alerts. Adjust based on your tolerance for early vs. confirmed reversals.
- Lower → earlier warnings, more frequent signals.
- Higher → fewer, more conservative alerts.
Quick Tuning Tips
- Scalping / Fast Markets
• Reduce Fast Trend for quicker responses.
• Lower Trend Length for shorter-term moves.
• Decrease Signal Limit for more frequent alerts.
Result: highly reactive setup suitable for rapid trades. - Swing / Trend Following
• Increase Slow Trend for steadier confirmation.
• Increase Trend Flexibility to adapt more slowly.
• Lengthen ATR Trend Length to emphasize stronger, cleaner trends.
Result: smooth, reliable performance for longer trades. - Reducing Noise / Choppy Markets
• Enable Trend Filter to restrict signals to the main direction.
• Increase Sensitivity to filter out minor spikes.
• Raise Signal Limit to focus on only strong, validated setups.
Result: a calmer chart with fewer false signals.
6. Frequently Asked Questions (FAQs)
Q1: Is this indicator suitable for all markets?
Yes. ATR Trend & ATR Top/Bottom adapts well to forex, crypto, indices, stocks, and futures. It automatically scales with volatility, making it versatile for both fast-moving and slow-trending assets.
Q2: What timeframe works best?
It works effectively on all timeframes.
- Short-term traders can use faster trend settings for quick reactions to intraday impulses.
- Swing and position traders benefit from smoother configurations that highlight large, established trends.
The key is to use it in mature, well-developed trends, where its signals and trailing stops perform best.
Q3: Do I need to enable all features?
No. You can customize it to your style:
- Use only the Oscillator Feature for trend and momentum visualization.
- Enable ATR Top/Bottom when you want to monitor volatility extremes and potential reversals.
- Combine both for a complete view of market strength, direction, and exhaustion zones.
Q4: How can I tell if the trend is bullish or bearish?
When the oscillator line is above zero, the trend is bullish. When it is below zero, the trend is bearish. The color of the oscillator changes to make this easy to read at a glance, clearly showing the market bias and direction of momentum.
Q5: What are Trend Impulses and how should I use them?
Trend Impulses appear when the fast oscillator line crosses above or below its upper or lower band.
- A move above the upper band signals strong bullish momentum within an uptrend.
- A move below the lower band signals strong bearish momentum within a downtrend.
These impulses often indicate temporary overbought or oversold conditions — ideal areas to take partial profit or prepare for a pullback before the trend continues.
Q6: How does the indicator show possible reversals?
The ATR Top/Bottom feature highlights areas of momentum exhaustion that may lead to reversals or strong extensions.
- Red peaks show intense bearish momentum — if they cluster, the market is in a strong downtrend; if they fade, a reversal may form.
- Green peaks show strong bullish momentum — extended runs suggest a strong uptrend, while fading signals may mark the end of the move.
Q7: How can I reduce false signals?
Increase the Smooth, Trend Length, and Signal Limit parameters to reduce noise.
For best results, always keep the Trend Filter enabled — this ensures signals only appear in the direction of the dominant market movement.
Q8: How do I manage trades?
Follow the built-in ATR Trailing Stop for automated, dynamic position management.
This trailing stop adjusts to volatility and price action, protecting profits while allowing trades to breathe during strong trends.
For manual management, consider taking partial profits at the first dynamic take-profit level and exiting the remainder when the trailing stop is hit.
Q9: Can I combine this indicator with others?
Yes. Many traders use it alongside support/resistance zones, volume indicators, or price action patterns for additional confirmation.
However, ATR Trend & ATR Top/Bottom is designed to operate as a standalone system, providing complete signals, trend analysis, and trade management tools within one framework.
Zeiierman
With over 16 years in the market, Zeiierman has extensive experience as a full-time trader and risk advisory consultant for hedge funds. He has developed many profitable trading strategies, drawing on his background in risk management and strategy execution.
More from Zeiierman