Works on the Following Platforms
TradingView
For use on the TradingView platform
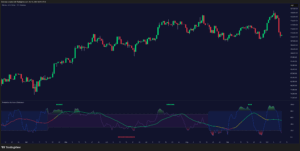
Trend Analysis Ultimate (Zeiierman) highlights meaningful retracements within ongoing trends and marks them using clear green/red columns, triangles, and optional strong trend background shading. The indicator provides intuitive, easy-to-read trend continuation signals, along with dynamic take-profit and trailing stop features.
1. What Is a Retracement?
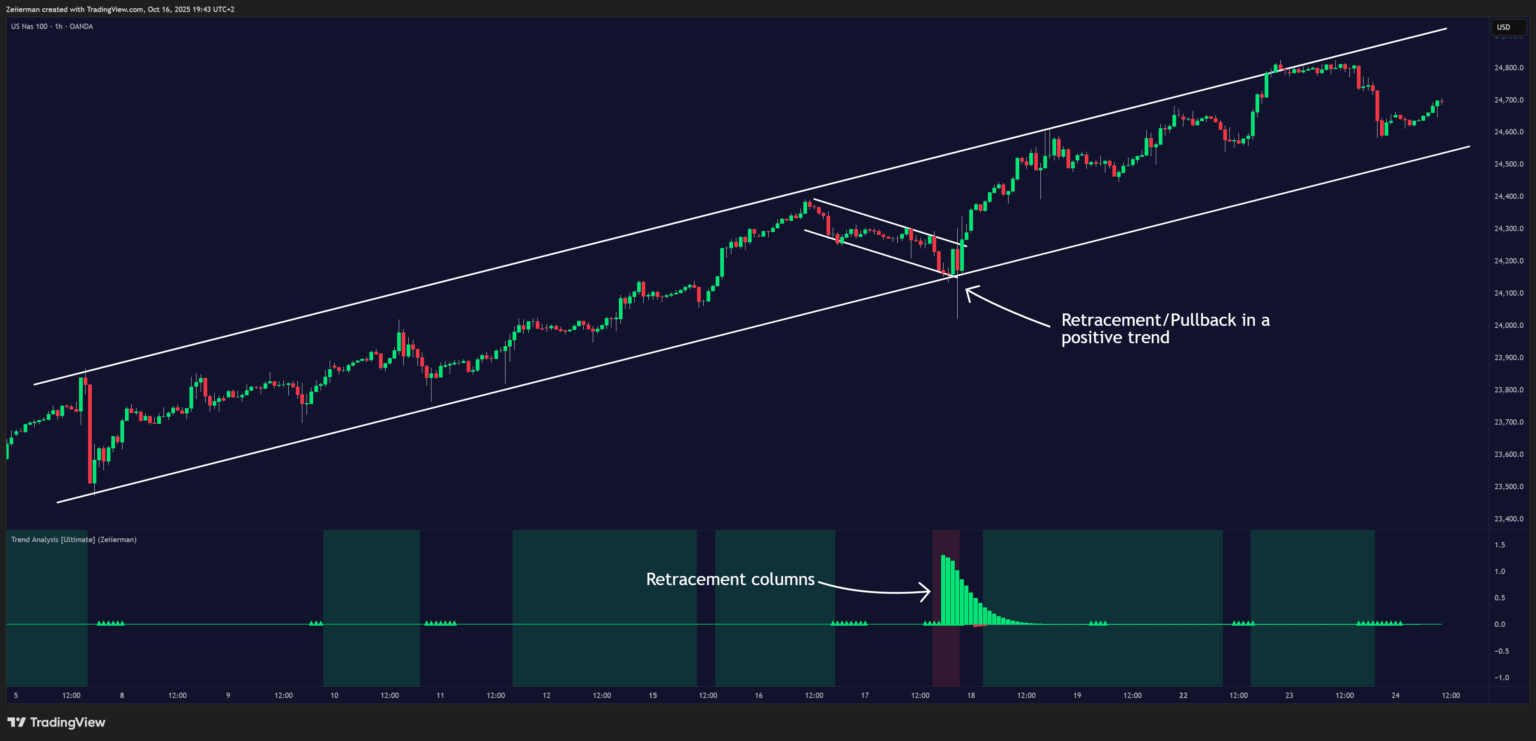
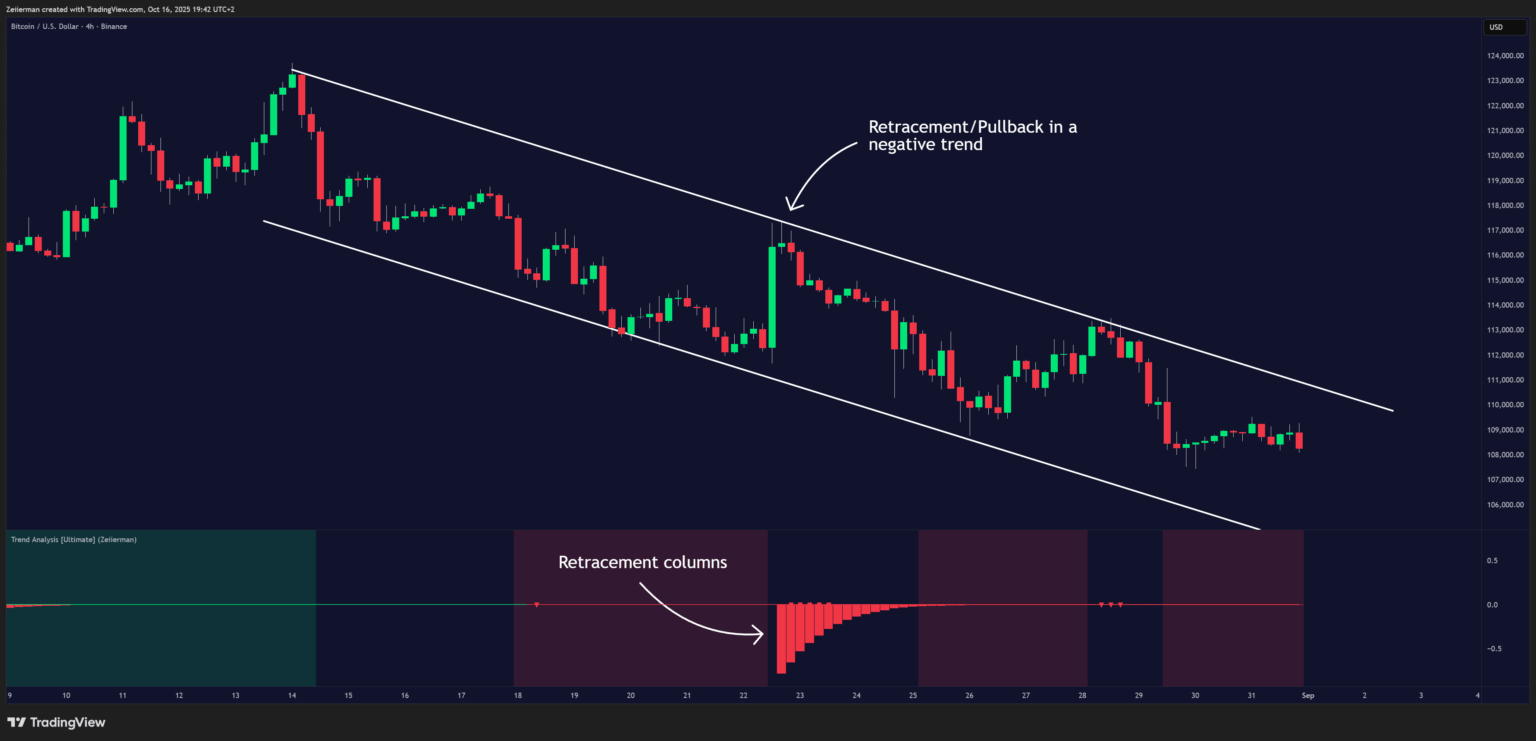
A retracement is a temporary move against the prevailing trend. It often signals a pause, potential continuation opportunity, or the early stages of a reversal. In this indicator, green/red retracement columns mark significant pullbacks that frequently precede new local highs/lows, continuation legs, or the end of a trend.
Key concept: Every trend ultimately ends with a retracement column. The trader’s job is to judge whether that retracement is part of the established trend’s pullback or the area where the trend is changing.
2. How to Trade with Trend Analysis Ultimate (Zeiierman)
A. Major Retracements/Pullbacks
Bullish
Step 1: Ask Key Context Questions
Whenever you see green retracement columns in the indicator window, your first thoughts should be:
- “Are we in a bullish trend?” Look at the price structure — are higher highs (HH) and higher lows (HL) forming? Are trendlines pointing upward?
- “Is this showing a higher low?” Green columns often appear during pullbacks, right before price forms a higher low and resumes the trend.
- “Is this a healthy correction within the uptrend?” If price respects previous structure or the rising trendline, and the histogram starts decreasing again (green bars shrinking), that’s a sign of strength — the pullback is likely ending.
Step 2: How to Use Practically
If you can answer “Yes” to the three questions above, it’s time to look for confirmation signals around this price area that support a new positive trend leg upward.
- Identify an uptrend (higher highs/lows + upward structure).
- When green columns appear → mark that as a pullback zone.
- Watch for:
- Rejection candles
- Break of short-term downtrend line
- Volume confirmation
- Rejection candles
- Enter when price resumes upward movement (not during the retracement).
Bearish
Step 1: Ask Key Context Questions
Whenever you see red retracement columns in the indicator window, your first thoughts should be:
- “Are we in a bearish trend?” Look at the price structure — are lower highs (LH) and lower lows (LL) forming? Are trendlines pointing downward?
- “Is this showing a lower high?” Red columns often appear during pullbacks, right before price forms a lower high and continues the downtrend.
- “Is this a healthy correction within the downtrend?” If price respects previous structure or the falling trendline, and the histogram starts decreasing again (red bars shrinking), that’s a sign of weakness — the pullback is likely ending.
Step 2: How to Use Practically
If you can answer “Yes” to the three questions above, it’s time to look for confirmation signals around this price area that support a new negative trend leg downward.
- Identify a downtrend (lower highs/lows + downward structure).
- When red columns appear → mark that as a pullback zone.
- Watch for:
- Rejection candles
- Break of short-term uptrend line
- Volume confirmation
- Rejection candles
- Enter when price resumes downward movement (not during the retracement).
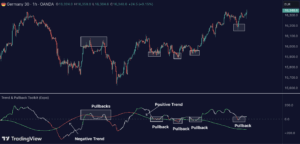
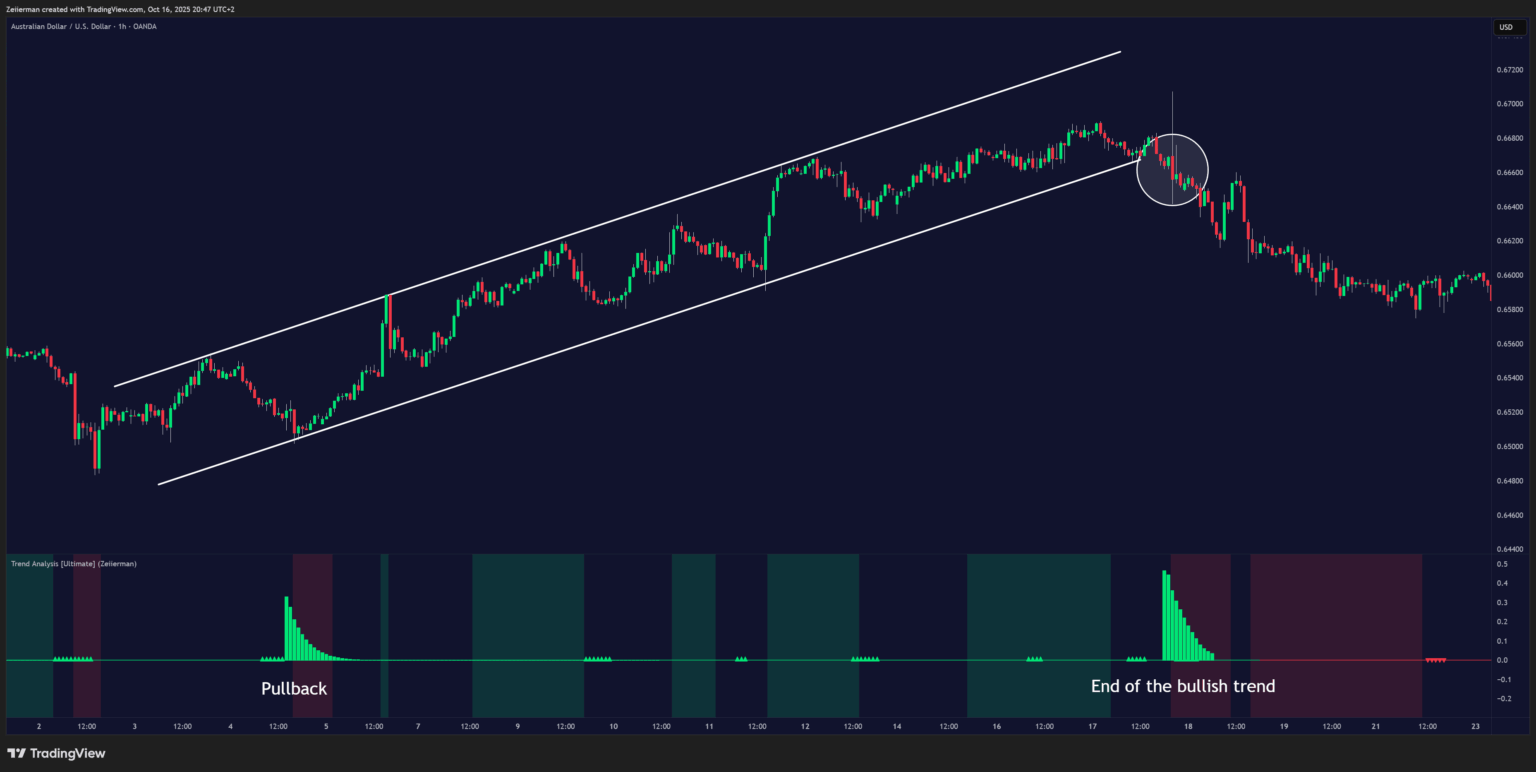
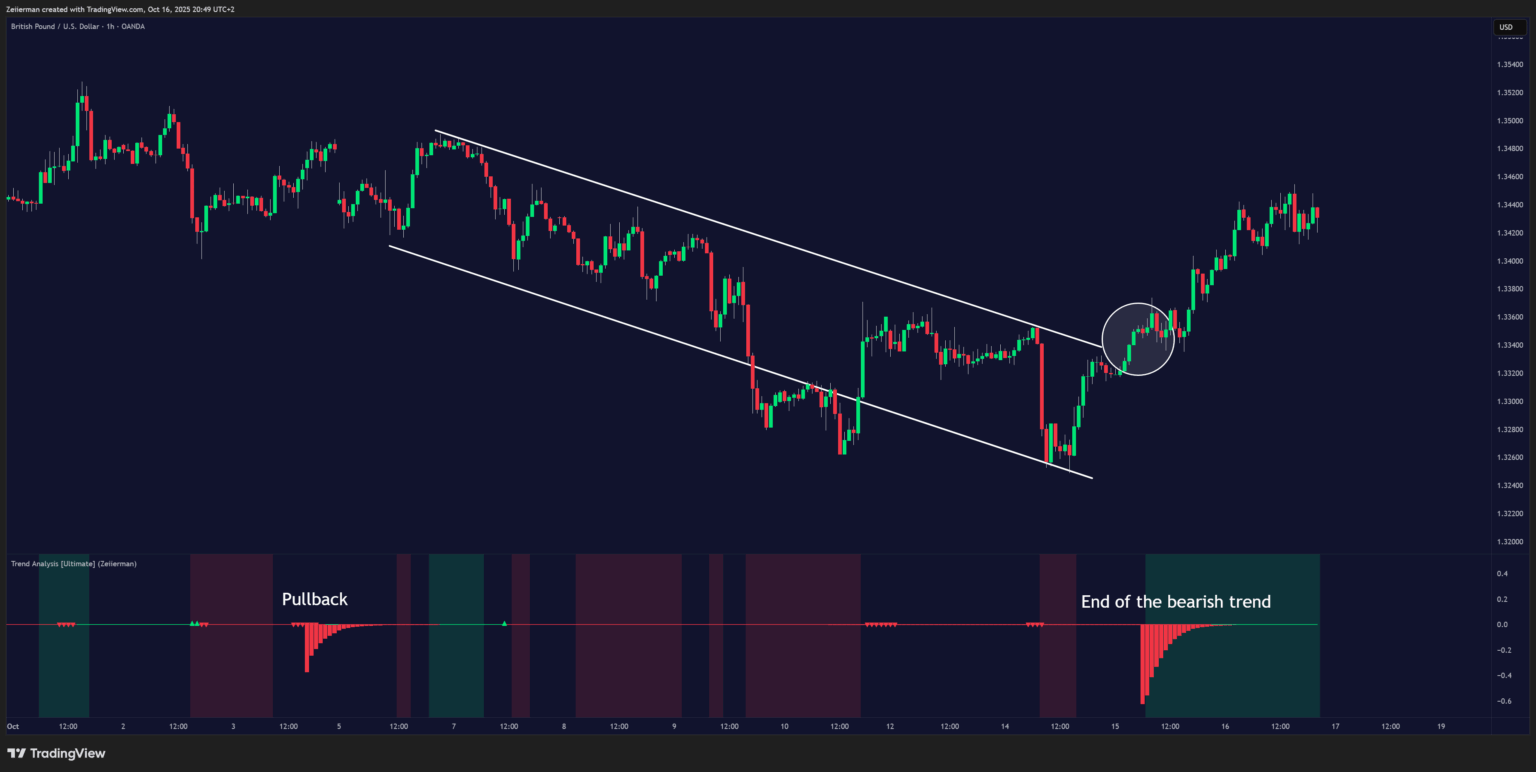
B. Identifying the End of One Trend and the Start of Another
Every trend will end at some point. The first signs often look like a normal retracement — the market pulls back as usual.
The difference this time is that there aren’t enough buyers or sellers at that price level to support another leg in the same direction. What first appears as a retracement becomes the turning point where the trend loses strength.
When price fails to find support (in an uptrend) or resistance (in a downtrend), that’s when the current trend ends and a new one begins.
The retracement columns help highlight these potential transition zones — areas where one trend phase may end, and another may start.
The second thing we should ask ourselves when these retracement columns appear on the chart is:
- “Is there a clear trend, and how long has it continued?” The longer a trend has been running, the higher the chance of a reversal. If we are already in the fifth leg of a trend move and retracement columns appear, we should see this as an early signal that the current trend may be ending and a new one could be starting.
- “Has recent price action shown signs of reversal?” Look for patterns such as double tops, double bottoms, or a break of a trend channel. If these signs appear before a retracement column forms, it’s likely that the column is indicating the end of the current trend and the start of a new one.
To use this feature effectively, we must understand basic trend structure and price action. This helps us correctly categorize the retracement columns — either as a normal pullback within a trend or as a signal of a potential trend reversal.
Bullish Trend Ends
Bearish Trend Ends
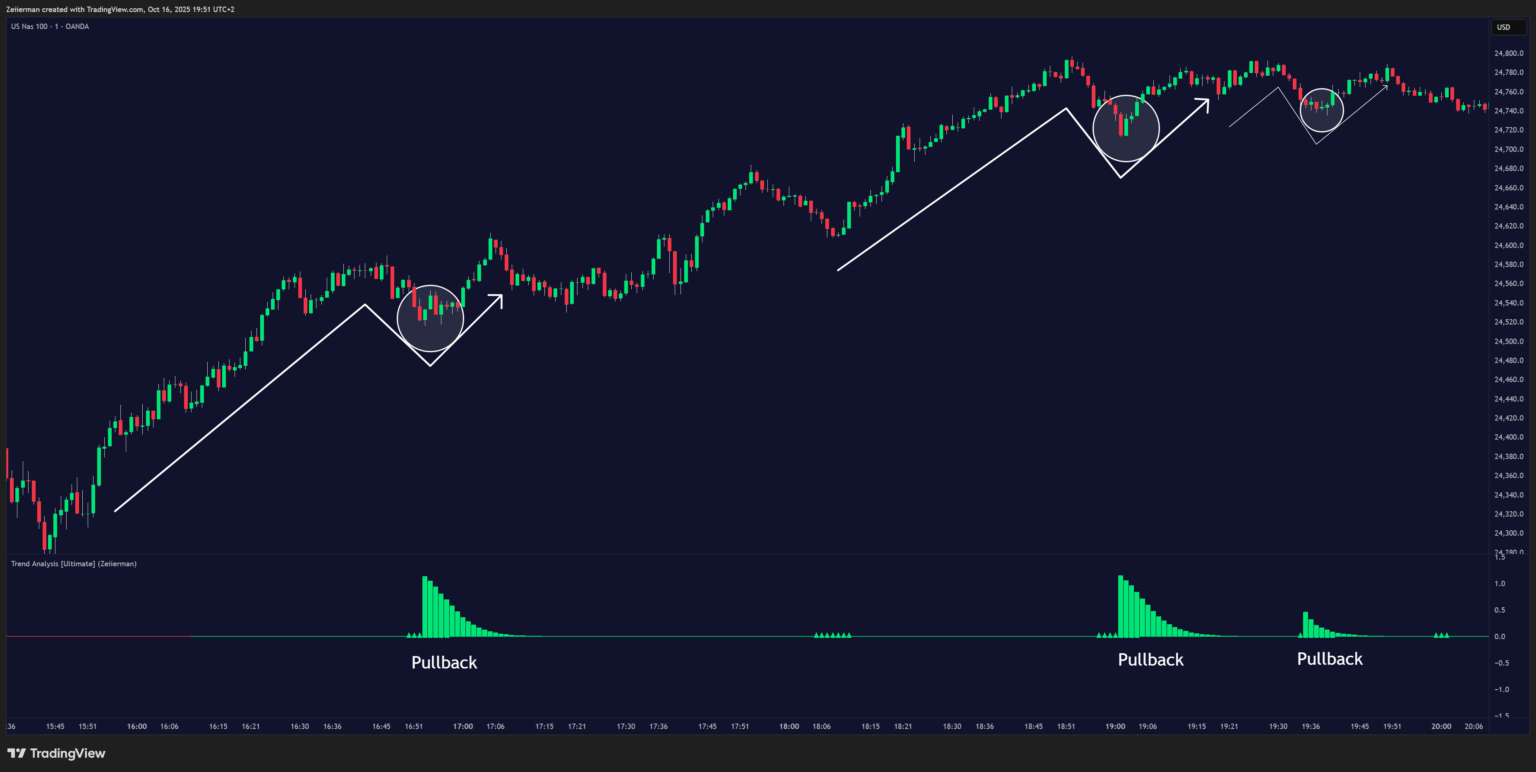
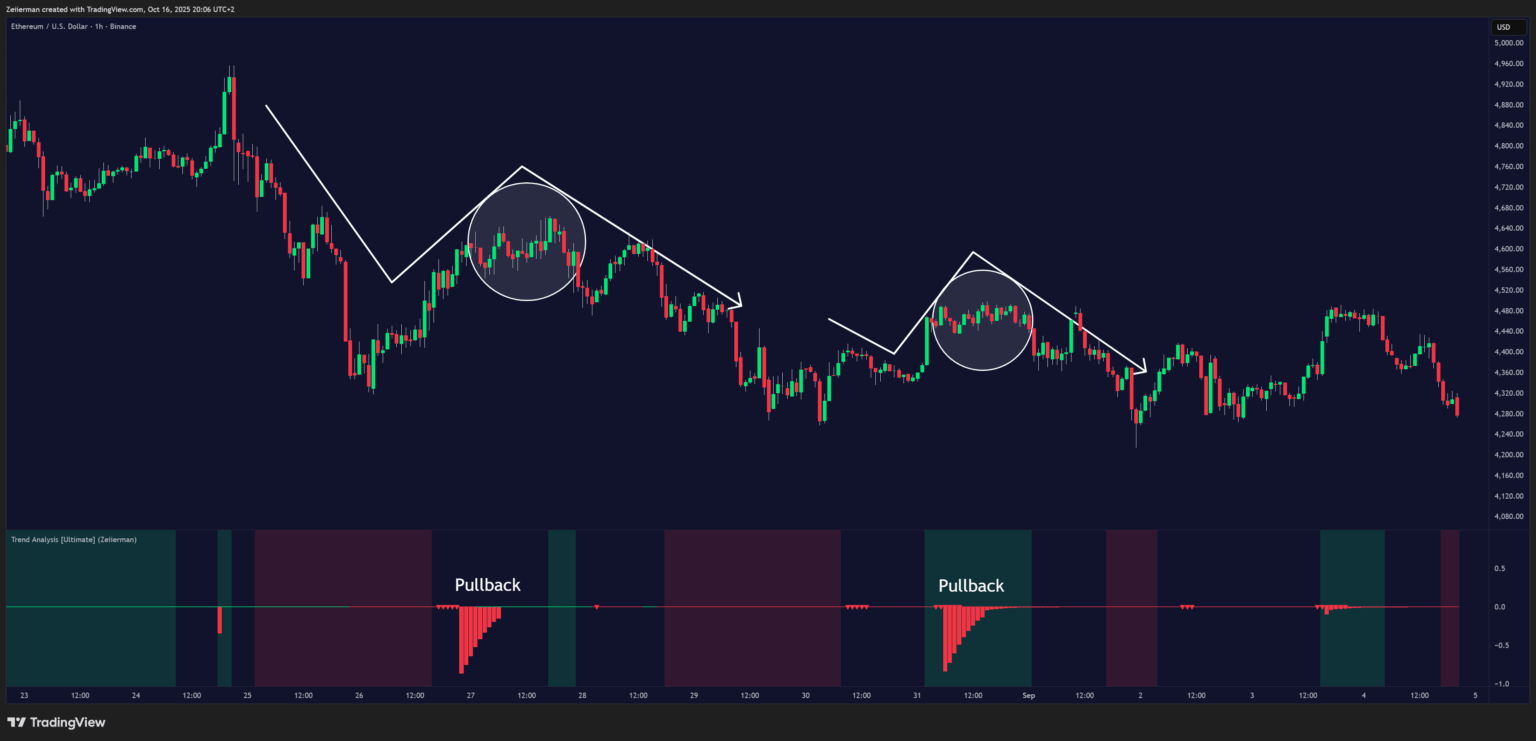
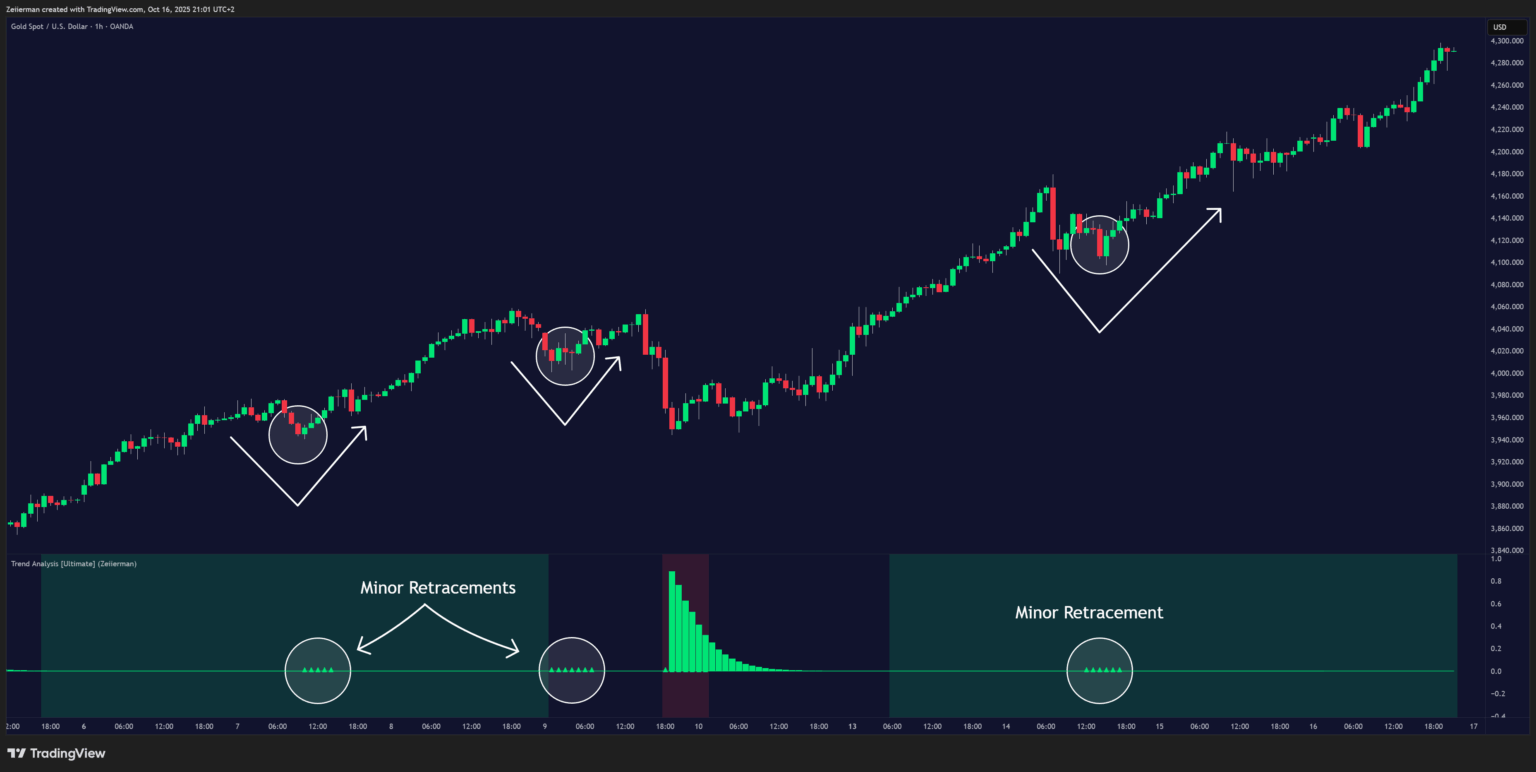
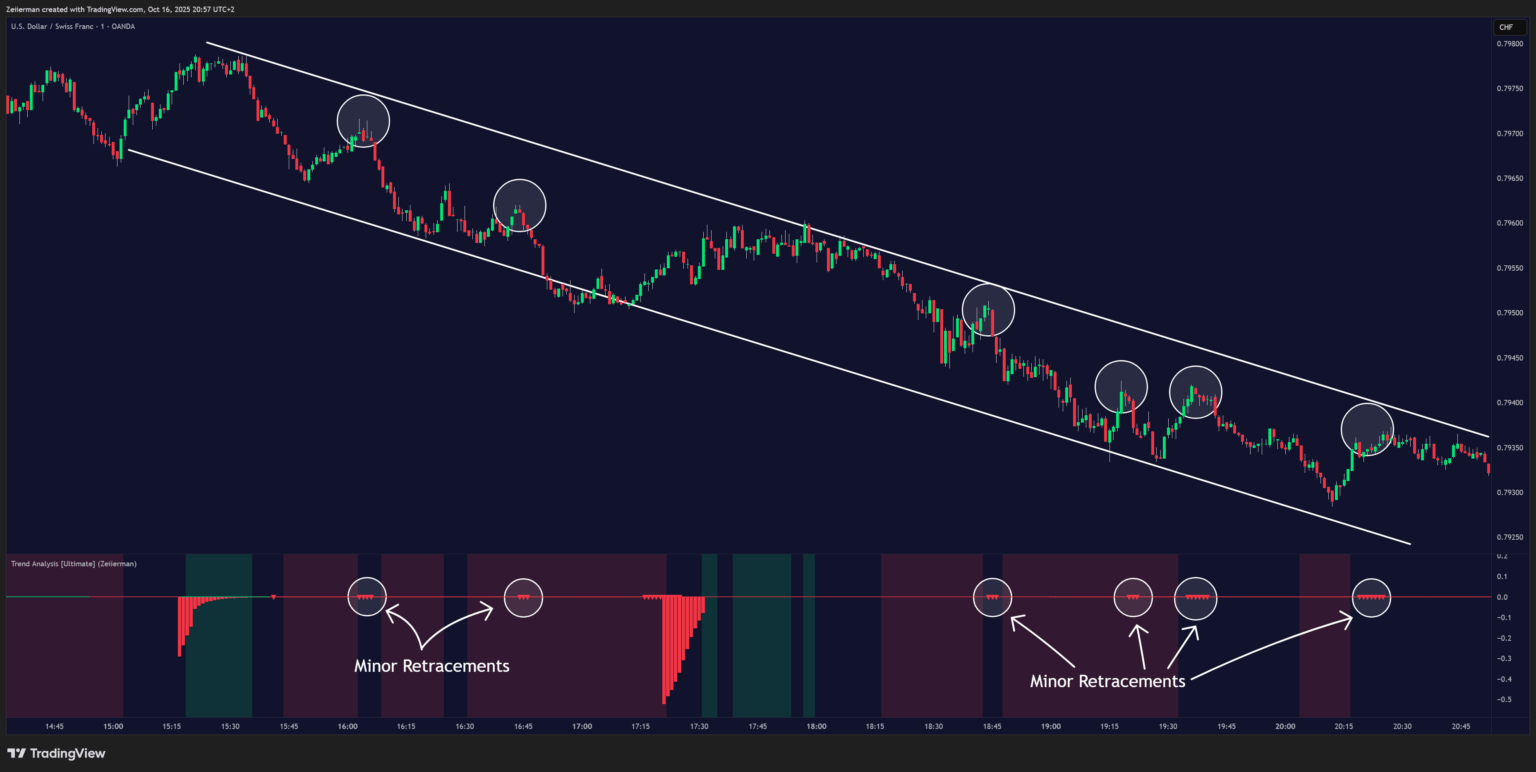
C. Minor Retracements/Pullbacks
Traders can use fast retracements within trends to find scalping opportunities. Always align these signals with clear trendlines to ensure you’re on the right side of the trend.
Bullish Minor Retracements
Bearish Minor Retracements
3. Simple Strategy: Trend Analysis Ultimate
Goal: This strategy helps traders enter on shallow pullbacks within established trends.
Trend trading is often the most effective approach for most traders, as the market generally has a higher likelihood of continuing its current path rather than reversing. That’s why this simple pullback strategy can help you enter an established trend at the best possible price.
Settings: Enable both the Bullish and Bearish signals, and leave the remaining settings at their default values.
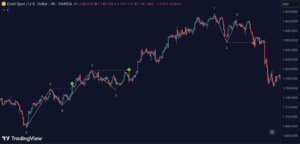
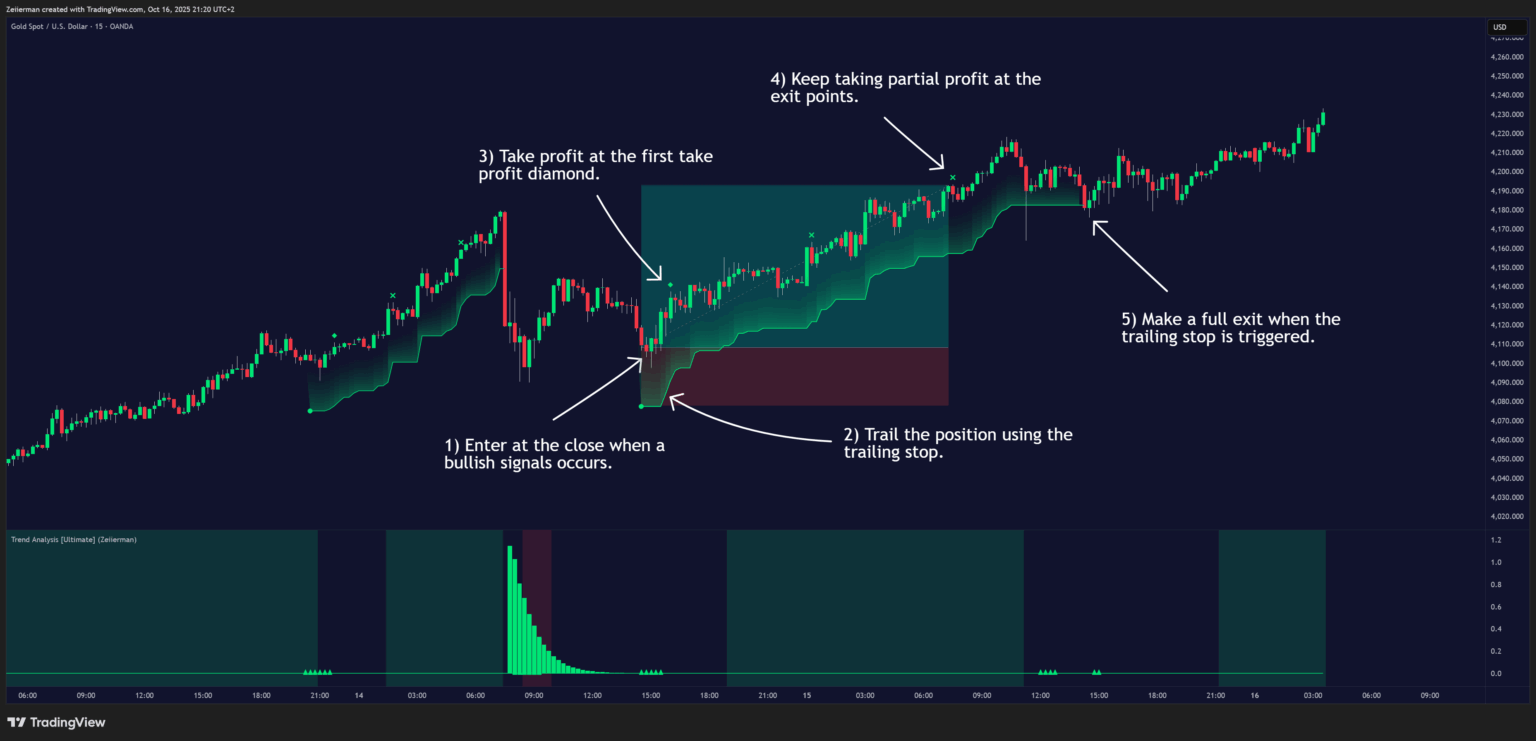
A. Long Setup (Step-by-Step)
Trigger: Wait for a bullish signal to appear on the chart, confirming alignment with the active long-term trend. Allow the signal candle to fully close before taking any action.
Entry: Enter a long position at the close of the signal candle.
Stop Loss: Set your stop loss at the trailing stop level plotted by the indicator. This level will automatically adjust as the price moves in your favor.
Take Profit One: Take partial profits at the first dynamic take-profit point, marked by a diamond shape on the chart.
Partial Profits: Continue to take partial profits at the exit points marked with an “X.”
Full Exit: Close the entire position when the trailing stop is triggered.
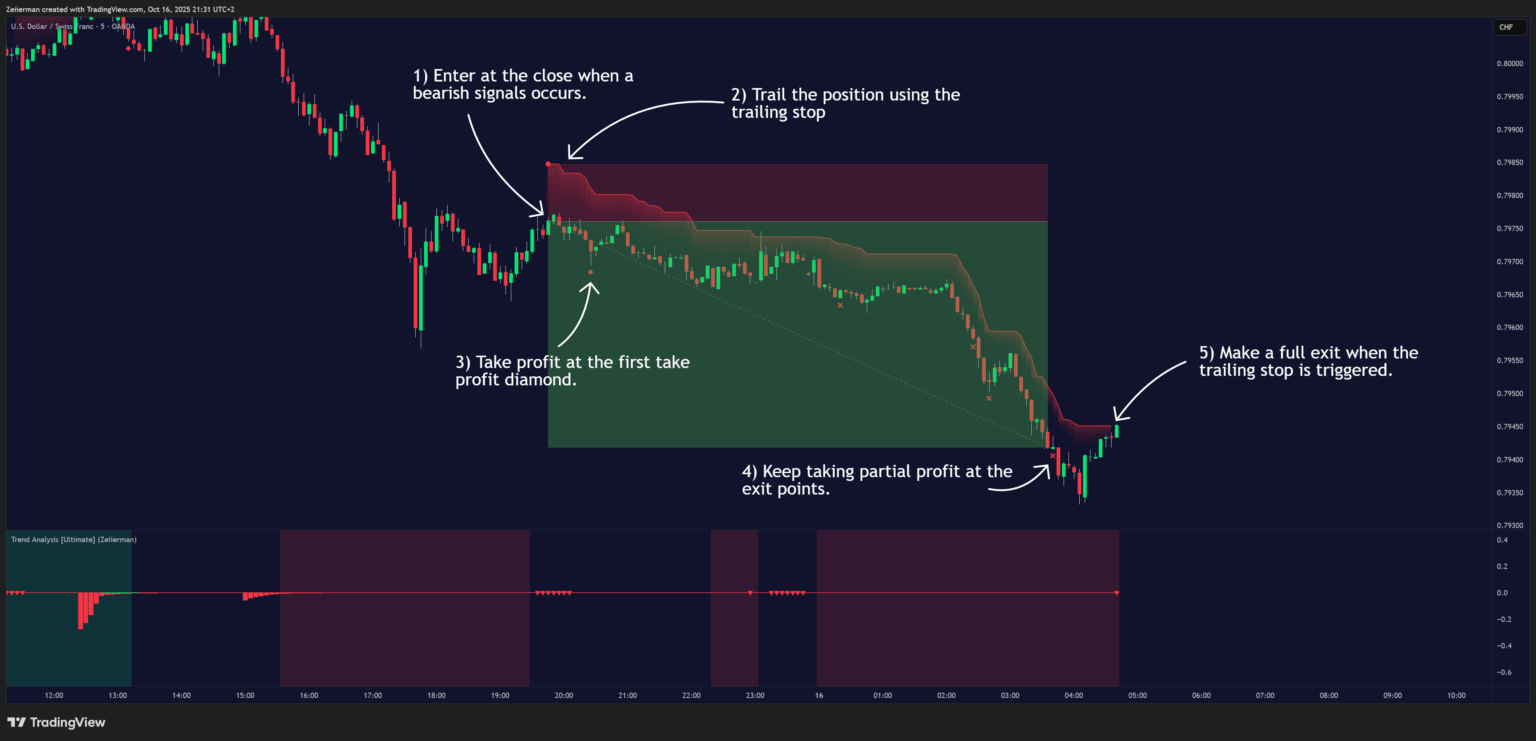
B. Short Setup (Step-by-Step)
Trigger: Wait for a bearish signal to appear on the chart, confirming alignment with the active long-term downtrend. Allow the signal candle to fully close before taking any action.
Entry: Enter a short position at the close of the signal candle.
Stop Loss: Set your stop loss at the trailing stop level plotted by the indicator. This level will automatically adjust as the price moves in your favor.
Take Profit One: Take partial profits at the first dynamic take-profit point, marked by a diamond shape on the chart.
Partial Profits: Continue to take partial profits at the exit points marked with an “X.”
Full Exit: Close the entire position when the trailing stop is triggered.
4. Settings Explained
This section explains how each parameter in Trend Analysis (Zeiierman) works and how it affects the indicator’s behavior. Each setting is grouped logically for clarity, focusing on usability and trading application.
General Settings
Start/End Of Trend Length
Defines how far back the indicator looks to detect the beginning and end of a trend.
- Lower values make it more responsive to short-term swings.
- Higher values smooth the output, focusing on longer-term moves.
This is the main sensitivity control for trend detection.
Show Confirmed Trend?
When enabled, only confirmed trend columns are shown. Green bars indicate confirmed bullish trends, and red bars indicate confirmed bearish trends.
Retracement / Confirmed Colors (Bull & Bear)
Customize the colors for retracement and confirmed phases of a trend. Retracement colors mark early trend weakening, while confirmed colors highlight strong ongoing trends.
Underlying Trend as Color
Bar Color
Applies the detected trend color directly to the price bars.
When active, candles visually reflect the current underlying trend direction.
Background Color
Shades the chart background according to the detected trend (green for bullish, red for bearish).
A subtle alternative to bar coloring that provides overall trend context.
Underlying Trend Lookback
Defines the number of bars used to calculate the underlying trend direction.
- Lower values create faster background color changes.
- Higher values produce smoother and more stable trend coloring.
Trend Colors (Up / Down / No Trend)
Select the colors displayed for bullish, bearish, and neutral conditions.
Transparency
Adjusts how strongly the background shading is displayed.
A higher value makes the shading more transparent; a lower value makes it more visible.
Trend Signals
Bullish / Bearish
Enable or disable long and short signal generation. Turning off one side filters signals to trade only in one direction.
Entry Trend
Controls the sensitivity of the trend filter used to detect potential entry zones.
- Lower values react more quickly and produce more frequent signals.
- Higher values are smoother and more selective.
Entry Sensitivity
Determines how fast the system reacts to pullbacks or impulses.
- Lower values detect smaller retracements sooner.
- Higher values wait for larger, more distinct movements before signaling.
SL (Stop-Loss Multiplier)
Sets how far the dynamic stop line trails behind price.
- Lower multipliers produce tighter stops.
- Higher multipliers give more breathing room but reduce risk control.
Filter Entries by Trend
Allows entries only in the direction of the prevailing trend background (for example, long entries only during a green trend background).
Signal Colors (Bullish / Bearish)
Select marker and line colors for bullish and bearish signal events.
Exit Points
Early Take Profit
Enables early take-profit markers (TP1). These appear when the first favorable move occurs after an entry.
Partial Profit
Displays additional profit-taking prompts at logical price regions while a trade remains active.
Exit Points Sensitivity
Controls how often exit and partial-profit markers appear.
- Lower sensitivity creates more frequent exit prompts.
- Higher sensitivity creates fewer but stronger signals.
TP Colors (Bullish / Bearish)
Define the marker colors for bullish and bearish take-profit points.
Alerts
Custom Alert Msg / Text
Allows you to define your own alert message text when custom alerts are enabled.
Per-Event Alert Switches (ENTRY / TP / EXIT)
Specify which alerts you want to receive: long, short, or off.
This setting directly connects to the indicator’s built-in alert conditions for entries, take profits, and exits.
Retracement Visuals
Retracement (Bullish / Bearish) Colors
Customize the colors for retracement impulses displayed as triangles.
These mark potential turning points or continuation areas within the trend.
Bullish retracements use upward-facing triangles, and bearish retracements use downward-facing ones.
Quick Tuning Tips
These guidelines help you adjust the indicator for different trading styles or market conditions.
1. Scalping / Fast Markets
If you trade short timeframes or fast-moving markets:
- Lower Start/End Of Trend Length for faster reaction.
- Reduce Entry Sensitivity to detect smaller pullbacks quickly.
- Lower Underlying Trend Lookback for more frequent background color changes.
- Use a smaller SL Multiplier for tighter stop management.
Result: A more reactive setup that captures quick swings and short-term reversals. Suitable for scalping and active day trading but may produce more signals and noise.
2. Swing / Trend Following
If you focus on capturing larger, sustained market moves:
- Increase Start/End Of Trend Length to smooth trend detection.
- Increase Entry Sensitivity to focus on significant retracements only.
- Raise Underlying Trend Lookback for a steadier trend background.
- Increase SL Multiplier to give trades room to develop.
Result: A slower, steadier configuration that filters small fluctuations and stays aligned with the dominant trend—ideal for swing or position traders.
3. Reducing Noise / Choppy Markets
If the market is sideways or inconsistent:
- Increase Start/End Of Trend Length to reduce rapid color changes.
- Increase Entry Sensitivity so only strong pullbacks trigger signals.
- Consider disabling Bar Color and rely on the smoother Background Color for clarity.
- Increase Exit Points Sensitivity to reduce frequent exit prompts.
Result: A calmer, more selective indicator that avoids false signals and helps you identify genuine shifts in market direction.
5. Frequently Asked Questions (FAQs)
Q1: What do the green and red retracement bars mean?
They mark significant counter-moves against the current trend. These often precede a local top/bottom, a continuation leg, or the end of the trend.
Q2: How do I tell continuation vs. reversal?
Check alignment: if the retracement bar matches the background trend (e.g., green bar in green background), it often supports continuation. If it contradicts (e.g., red bar in green background) and strength fades, it can warn of a trend change.
Q3: What are the triangles?
They’re retracement impulse markers that help pinpoint timing within the pullback (bullish = triangle up, bearish = triangle down).
Q4: How do stops and take profits work?
The indicator plots a dynamic stop line after entries. It also places partial profit markers and TP1 prompts to help you secure gains and reduce risk.
Q5: Can I customize colors and visuals?
Yes. You can toggle bar/background colors, adjust trend colors, and refine transparency for clarity without cluttering the chart.
Q6: Any tips for beginners?
Start with the default settings, trade with the background trend, and use retracement bars as filters—ask: “Is this a pullback in the established trend, or the area where the trend changes?” Add position sizing and confirm with your preferred higher-timeframe view.
Zeiierman
With over 16 years in the market, Zeiierman has extensive experience as a full-time trader and risk advisory consultant for hedge funds. He has developed many profitable trading strategies, drawing on his background in risk management and strategy execution.
More from Zeiierman