Missing and being on the wrong side of the trend is the silent account killer that haunts even experienced traders. While everyone’s busy chasing the latest hot stock tip on Reddit, community members at Zeiierman are already positioning for the next move.
At a time like this, when traders have thousands of options with data and tools, it’s crucial to be rock solid on fundamentals to identify the right trend that will make you good profits.
In this guide, we’ll break down how Zeiierman members identify trend changes using the Trend Analysis [Ultimate] indicator, which will help you identify when a trend starts and ends, spot pullbacks within trends, and see the current trend direction and potential trend shifts. We will also suggest other indicators for momentum and volume, as well as rules to build your confidence while trading trends.
Key Takeaways
- Whether it’s accumulation, markup, distribution, or markdown, each market phase leaves clues. Learn to spot these before setup, and you’ll stop buying when big money is selling.
- When indicators like RSI or MACD start diverging from price, for example, price is rising, but RSI is falling, it shows that momentum is weakening. That’s your sign to stop chasing and start preparing for a possible trend shift.
- Breaks in market structure (such as the price failing to create a new high or breaking a key low) often signal that the dominant side is losing strength.
- Don’t jump in on the first break. Let the price retest that broken level. If it rejects that level hard, especially with volume, that’s your confirmation. You’re now trading with absolute conviction, not out of FOMO.
- The 50-day and 200-day moving averages are powerful for seeing bigger trend changes. Golden Crosses (bullish) and Death Crosses (bearish) act like traffic lights for trend traders, look for them across various time frames.
- Divergences between momentum indicators and price often mark the end of a move.
- Use multi-timeframe confluence with the Trend Analysis [Ultimate] indicator to align big-picture direction with short-term execution.
What exactly is a market trend?
To put it in simple terms, a market trend is the general direction a price moves over a sustained period of time. It comes in three forms:
- During uptrend, price makes higher highs and higher lows.
- During downtrend, price makes lower lows and lower highs.
- During a sideways (or range) market, price is being consolidated between close support and resistance.
In my experience, traders who understand that trends aren’t hollow structures tend to perform better on the market. What do I mean by that? Well, it’s important to take a holistic approach because trends are products of real buyers and sellers having a tug of war with the price.
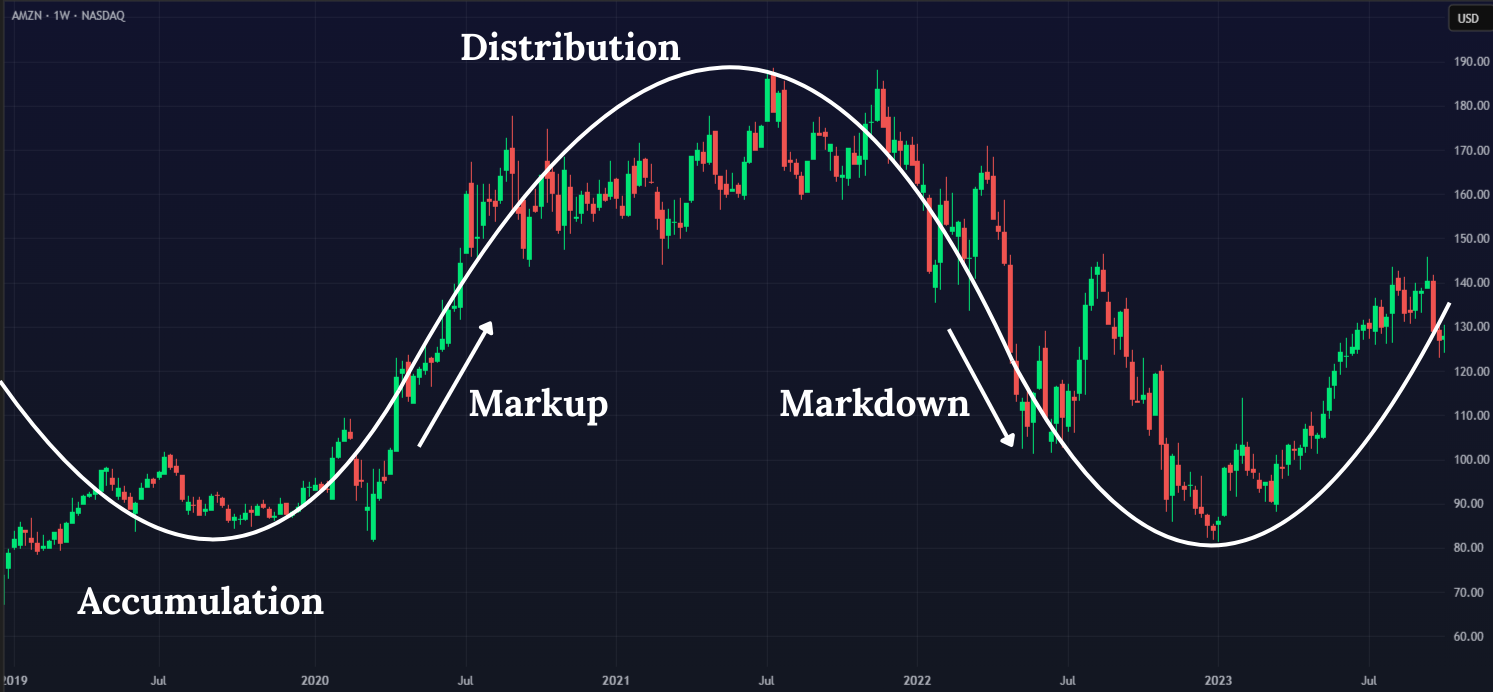
These phases represent the progression of market sentiment and price movement, repeating in a pattern. As such, the classic market cycle theory clearly breaks down all the phases of a trend. For an uptrend, it starts with accumulation when smart money quietly builds after a downtrend. Then there’s markup (price goes high) and distribution (price starts stalling at the top when smart money unloads). Finally, we see a markdown that marks the beginning of a new downtrend.
How to spot the end (or start) of a trend?
Well, this is self-explanatory, but learning this helps you understand both the start and the end of a trend since either is followed by the other. There are four clear indicators we use at Zeiierman Trading.
1. Weak Volume on New Highs or Lows
The price is what you see, but the volume tells you whether anyone actually cares. Think of volume as the gas pedal; without it, price movements are just noise. The golden rule in a healthy uptrend is that volume should increase on rallies and decrease on pullbacks. Lack of volume = lack of interest.
You can read market volume with Zeiierman’s Volumebook script on TradingView.
2. Market Structure Breakdown
In an uptrend, the price should form higher lows consistently. If one of those lows breaks and the price fails to recover, you may be staring at the beginning of a reversal.
Head and shoulders, double tops, ascending wedges – these patterns work because they represent some real shifts in market psychology. But the pattern is often only half the story. You need volume confirmation and a clean break of the neckline or support level.
Read: How to Maximize Profits with Zeiierman’s AI Chart Analyzer3. Momentum Divergence
Momentum divergence is like seeing cracks in a building’s foundation before it collapses. The price keeps pushing up, but the candles get smaller. That’s a red flag. You’re seeing buyers run out of steam.
In other words, price is making new highs, but your momentum indicators (RSI, MACD, Stochastic) are making lower highs. The price may be lying, but momentum is telling the truth. You can check Moving Averages and Divergence with RSI Overlay using our TradingView script.
4. Moving Average Crossovers
The important crossover here is the 50-day moving average and the 200-day moving average. The real money is in watching how price interacts with these moving averages before the cross, and most traders get it wrong.
Use the two timeframes to figure out the status of your trend:
- Golden Cross: 50-day MA pops above the 200-day. Often marks a major shift to the upside.
- Death Cross: 50-day MA falls below the 200-day. It could warn of bears ahead.
Remember to check the MA in all major time frames and always pair it with other indicators and volume confirmation.
5. Use Supertrend scripts
You can use the Supertrend indicator as the base confirmation factor of trends. The Supertrend is a volatility-based trend-following tool. It shows you whether the market is bullish or bearish based on volume data, current price action, and ATR (Average True Range).
Here’s how it works:
- Green Line (Below Price): Price is above volatility support (uptrend)
- Red Line (Above Price): Price is below volatility resistance (downtrend)
The supertrend may not be reliable in a sideways market. To tackle this problem, you can add multiple Supertrends to your chart and adjust their settings. In settings, change the ATR length and the MA source according to the asset you are trading. Take entry only when all the lines give the same signals and are the same color. You can set exit with the reliable 1:2 ratio, or you can monitor for any of the supertrend lines to change color, and that’s your exit.
How to spot a trend reversal?
Step 1: Assess Market Structure
First, you have to identify the ongoing market structure by defining whether it is in a strong uptrend or downtrend. Here, most traders use the ICT Market Structure Screener, which automatically finds swing highs/lows and classifies price swings as bullish or bearish.
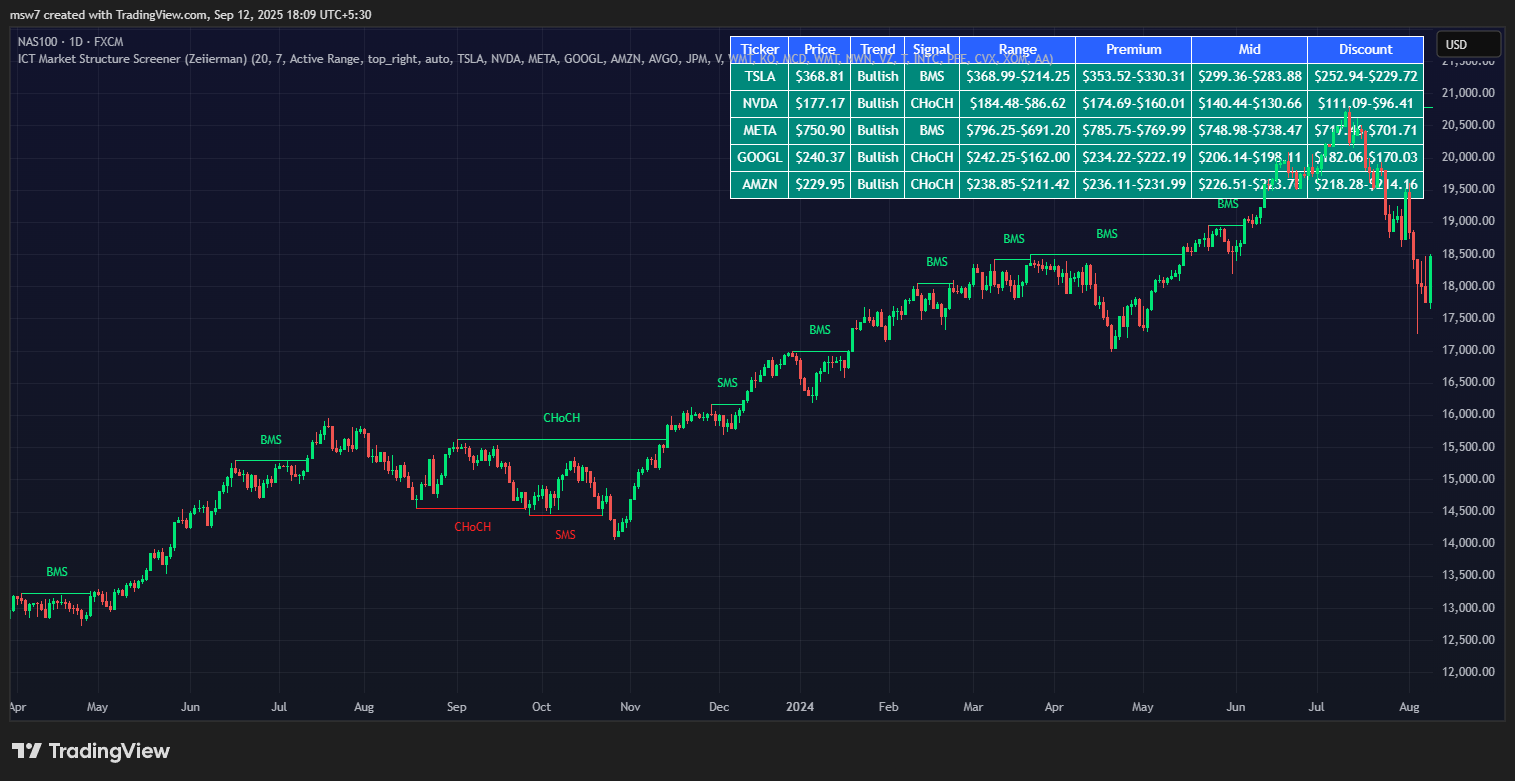
Look for Bullish Market Structure (BMS), marking a series of higher highs and higher lows, or Bearish Market Structure (BMS), lower highs/lows. A clean sequence of BMS indicates a good trend. Also, keep an eye on Smart Money Shift marks that show transitions in market structure where smart money starts accumulating or distributing assets.
Watch for Breaks (Change of Character) where the indicator marks a ChoCH (Change of Character) when the price breaks a key swing high or low. A ChoCH sign often comes before a trend reversal or a major pullback
Read: 2B Reversal Pattern Trading Strategy Explained: How to Enter, Exit and ProfitStep 2: Confirm Trend Dynamics
Once you know the structure, you need to measure the strength behind it. That’s where the Trend Analysis [Ultimate] indicator comes in.
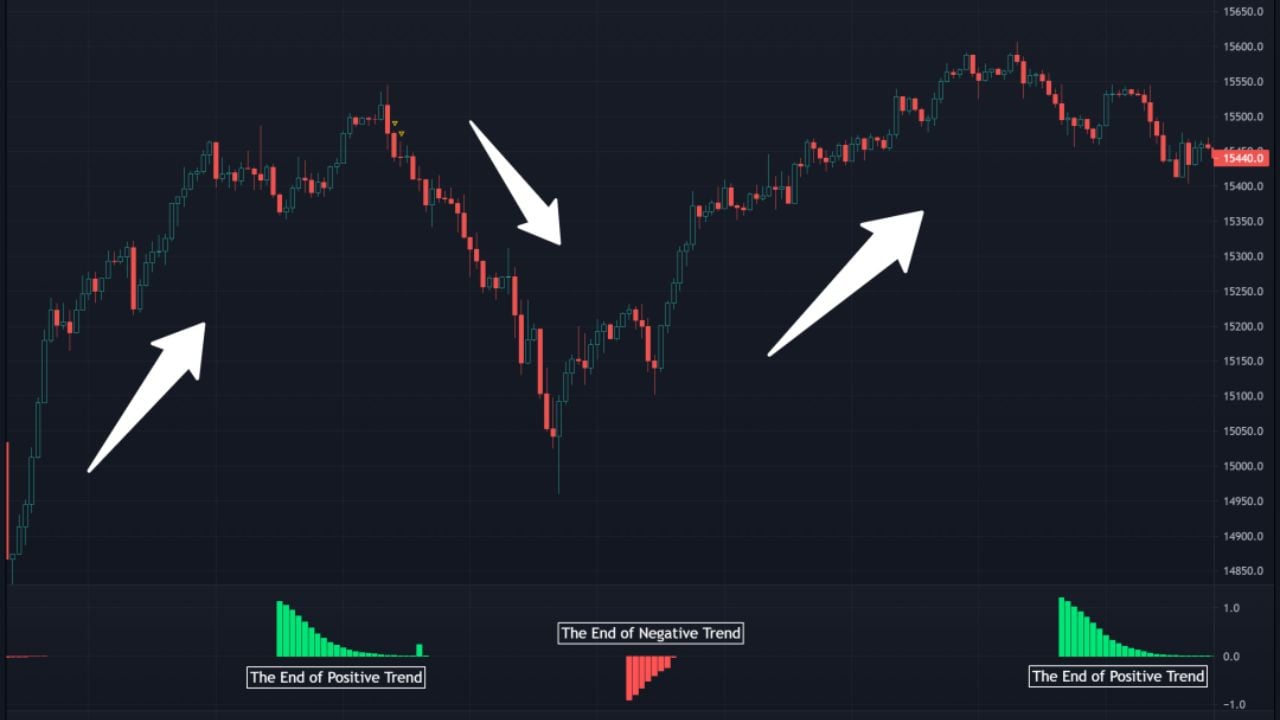
This indicator plots histograms and colors the bars to indicate whether a trend is starting, ending, or out of step. When a new green histogram appears, it suggests the beginning of an uptrend. When a red histogram shows up, it signals the start of a potential downtrend.
There are a few key signals to watch for:
- Start/End bars: These give the earliest warning that a trend is shifting direction.
- Momentum peaks: When the histogram spikes, it often marks the high-energy part of the trend. After that, retracement is common.
Step 3: Confirm with Price & Volume Profile
The next filter is volume, and it’s one of the most important because no trend is valid without enough players participating. Price can move around all day, but unless there’s real money behind it, the move won’t last.
The Price & Volume Profile shows you where most trading activity has happened. Here are the key areas to focus on:
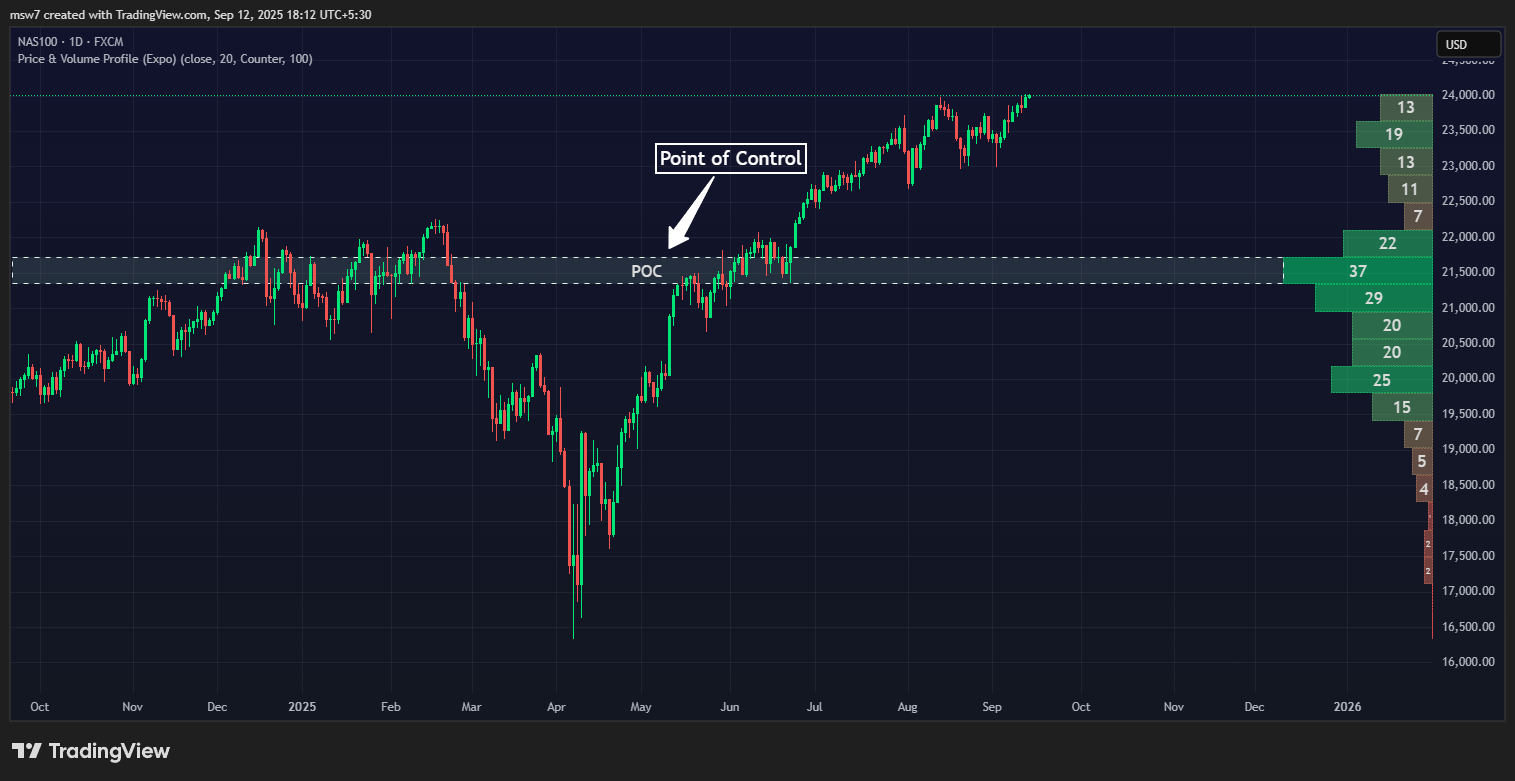
- Point of Control (POC): The price level with the highest traded volume. If the price is moving away from the POC on substantial volume, the trend is likely genuine.
- High-volume bars: These act like magnets. If price pushes through them, it’s a sign that big players are supporting the move. If the price stalls there, it could signal a reversal.
- Low-volume gaps. These are thin zones where the price didn’t spend much time. The market often comes back to fill these gaps, so if you’re trading near one, expect possible retracement. It also helps you find possible FVGs.
When structure, momentum, and volume all agree, that’s when you know you’re seeing the real start or end of a trend.
Read: Order Blocks Explained: The Institutional Strategy Traders Need to KnowFrequently Asked Questions (FAQs)
1. Should I use just one indicator or combine multiple?
It’s actually crucial to combine indicators. Relying on just one can often lead you astray.
Take MACD, for instance. It might show a bullish crossover, but if the price is still hitting lower highs and the volume isn’t changing, then that’s not a genuine trend reversal. It’s essential to look at the structure, volume, and have 2-3 other indicators backing you up.
2. What’s the difference between trend reversal and trend continuation patterns?
The main difference has to do with what goes on at key levels and the volume trends behind them.
Continuation patterns like flags, pennants, and ascending triangles during an uptrend usually signal a period of consolidation with less volume. It is then followed by breakouts in line with the existing trend, where the volume picks up.
Reversal patterns, such as head and shoulders, double tops, and rising wedges, instead show more volume as they form and then break out in the opposite direction of the previous trend.
Where these patterns show up is key: continuation patterns tend to pop up in the middle of a trend, while reversal patterns show up after longer price movements.
3. How can Supertrend be customized to avoid false signals?
Use multiple Supertrend indicators with different ATR settings (like 7, 10, and 14) and apply them all to your chart. When all lines are the same color (like all green), that’s confirmation of a stronger trend. You should also change the MA source (SMA, WMA, EMA, etc) based on your asset’s volatility.
You can try practicing this by using Zeiierman’s Supertrend AI script on TradingView.
4. Can I use this trend identification method in crypto and forex?
This approach is effective in various markets, whether it’s crypto, forex, stocks, or commodities. You’ll find that price action, volume (or tick volume in the case of forex), and momentum indicators tend to behave similarly on larger frames. Just keep in mind that each asset can vary in volatility, so you might need to tweak your indicator settings to match.
Zeiierman
With over 16 years in the market, Zeiierman has extensive experience as a full-time trader and risk advisory consultant for hedge funds. He has developed many profitable trading strategies, drawing on his background in risk management and strategy execution.
More from Zeiierman