Works on the Following Platforms
TradingView
For use on the TradingView platform
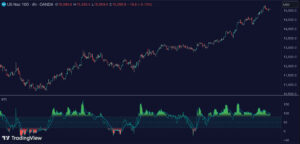
The Probability Oscillator by Zeiierman Trading is a probability-based indicator that adapts dynamically to shifting market conditions. It blends Bayesian probability, trend analysis, and volatility modeling to estimate the likelihood of continuation in either direction.
By allowing the probability framework to shift between Low-Volatility Mode and High-Volatility mode, the oscillator adapts to both smooth directional markets and choppy consolidations.
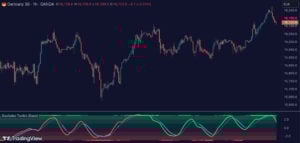
The tool plots a fast Probability line, a slower Signal line, and momentum Impulse dots, giving traders a clear view of strength, exhaustion, reversals, and potential breakout opportunities.
1. What is Bayesian Probability?
Bayesian probability uses Bayes’ theorem to update the odds of an event as new evidence emerges. In trading, this means continuously refining the probability of bullish or bearish continuation by combining prior market context (trend or volatility regime) with the most recent price action. This adaptive updating process is what makes the Probability Oscillator dynamic rather than fixed.
2. What is the Probability Oscillator?
The Probability Oscillator is designed to measure the probability of trend continuation while adapting to market conditions:
- Probability Line (fast): Reflects short-term probability weighted by current regime (calm or volatility).
- Signal Line (slow): A smoothed probability filter that establishes bias and confirms direction.
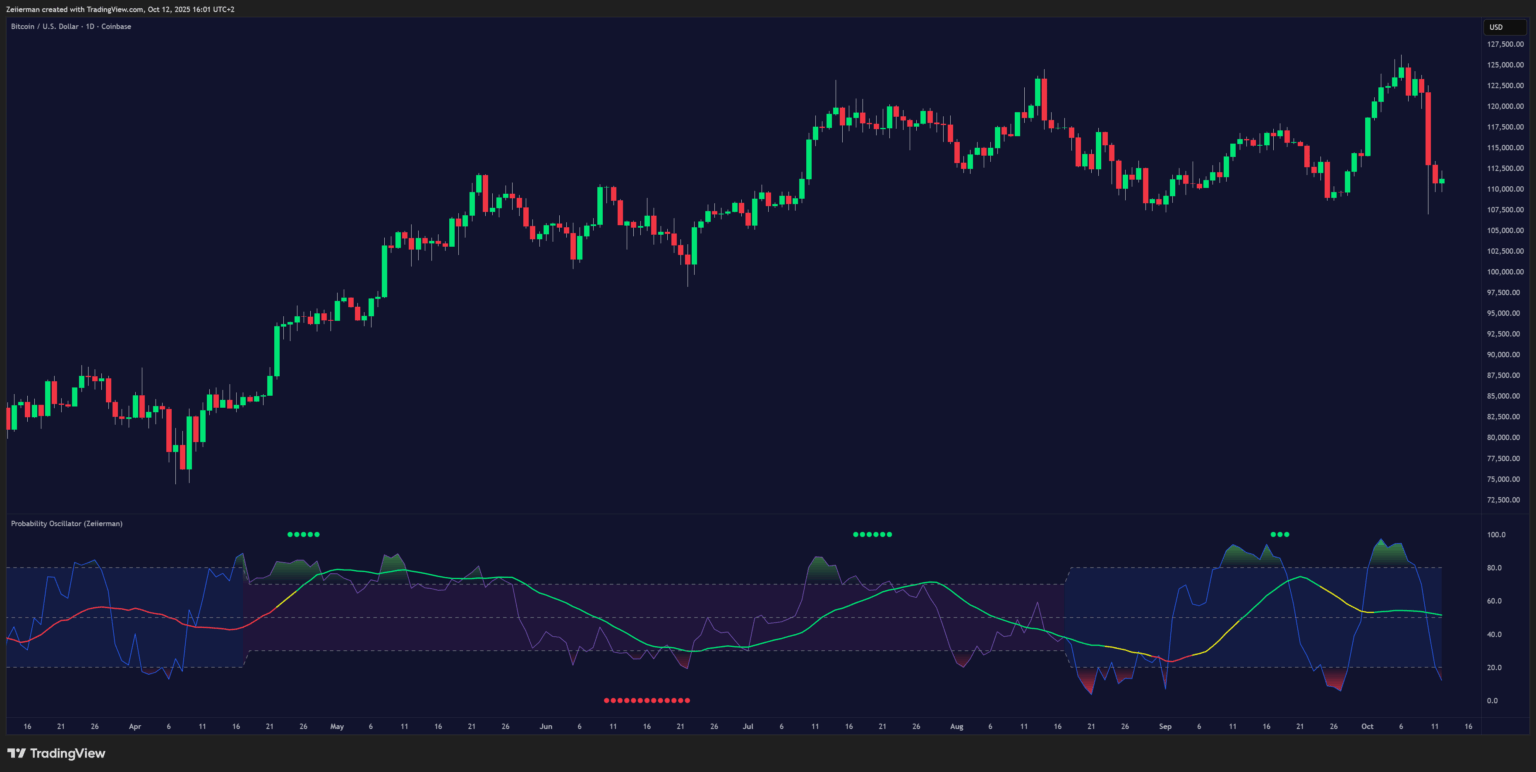
- Momentum Impulse Dots: Small markers that highlight bursts of positive (green) or negative (red) momentum.
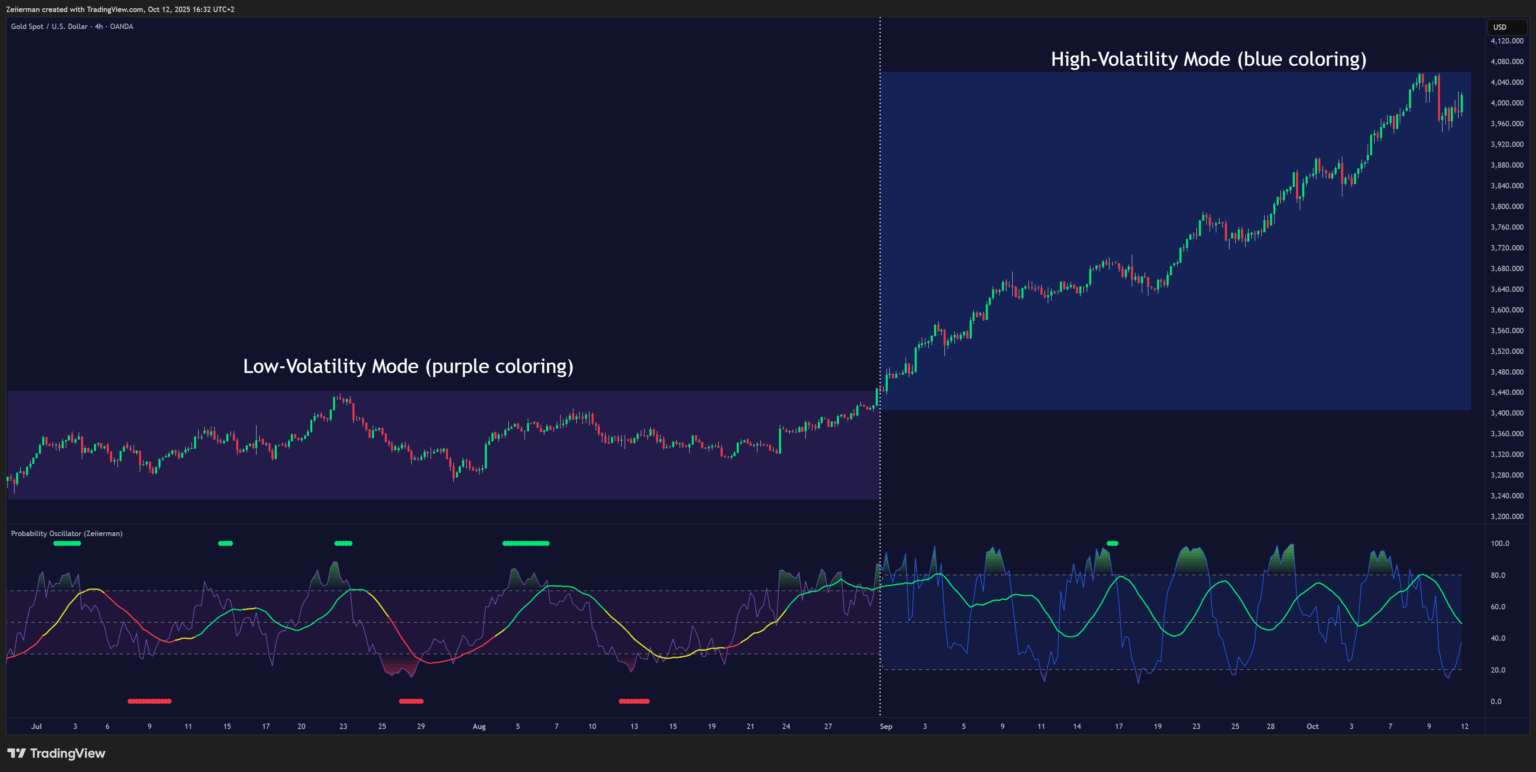
The oscillator’s probability framework automatically shifts between:
- Low-VolatilityMode: Focused on momentum and direction, favoring trending markets.
- High-Volatility Mode: Focused on oscillations and reversals, better suited for ranges and consolidations.
3. How to Trade with the Probability Oscillator?
A. Trend Following
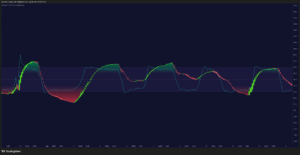
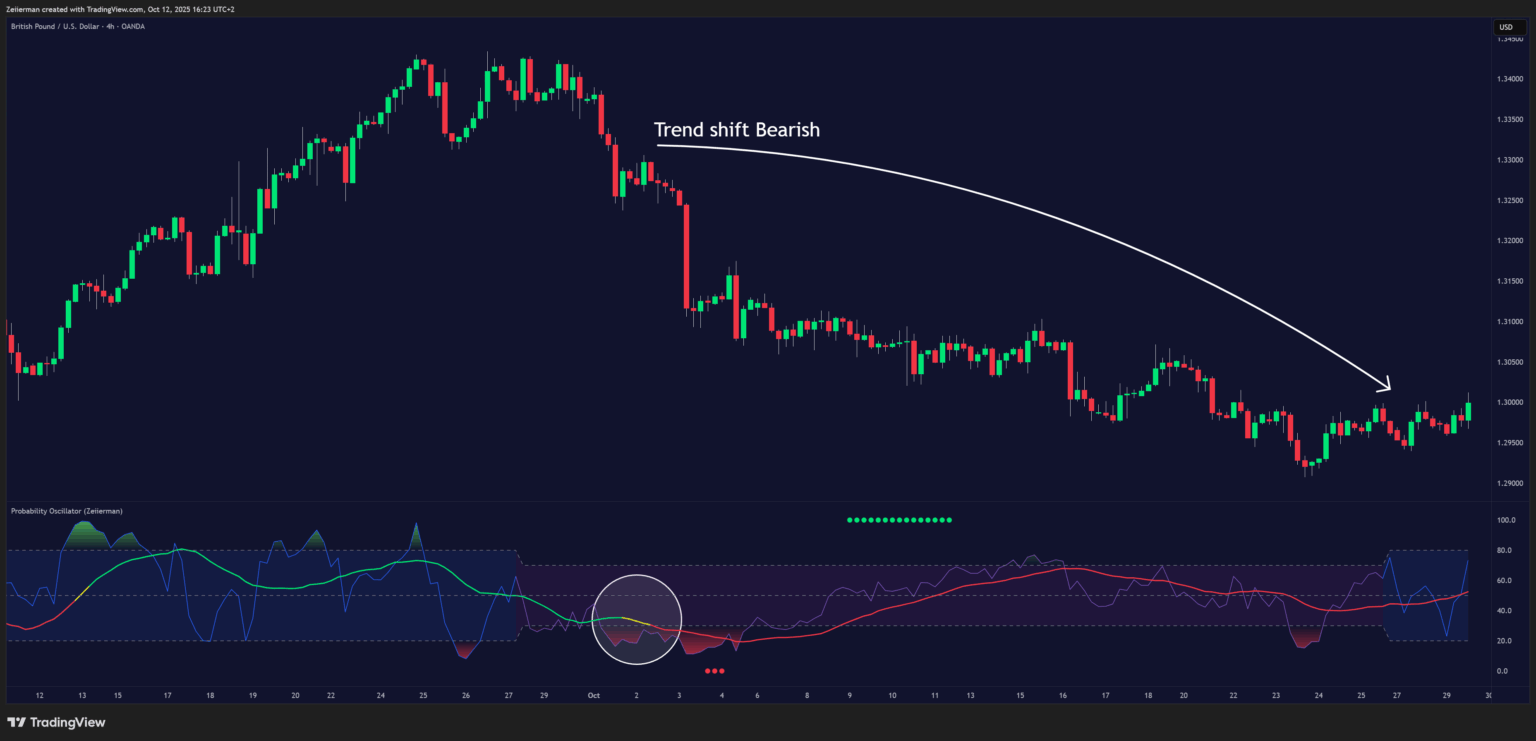
The signal line indicates the long-term trend and shows when the market is about to transition from bullish to bearish, or vice versa. This is visualized through the color of the signal line:
- Green = Bullish trend
- Red = Bearish trend
- Yellow = Transition phase
You can use the signal line to confirm trend shifts:
- When the line transitions from red → yellow → green, it signals that the market is turning bullish.
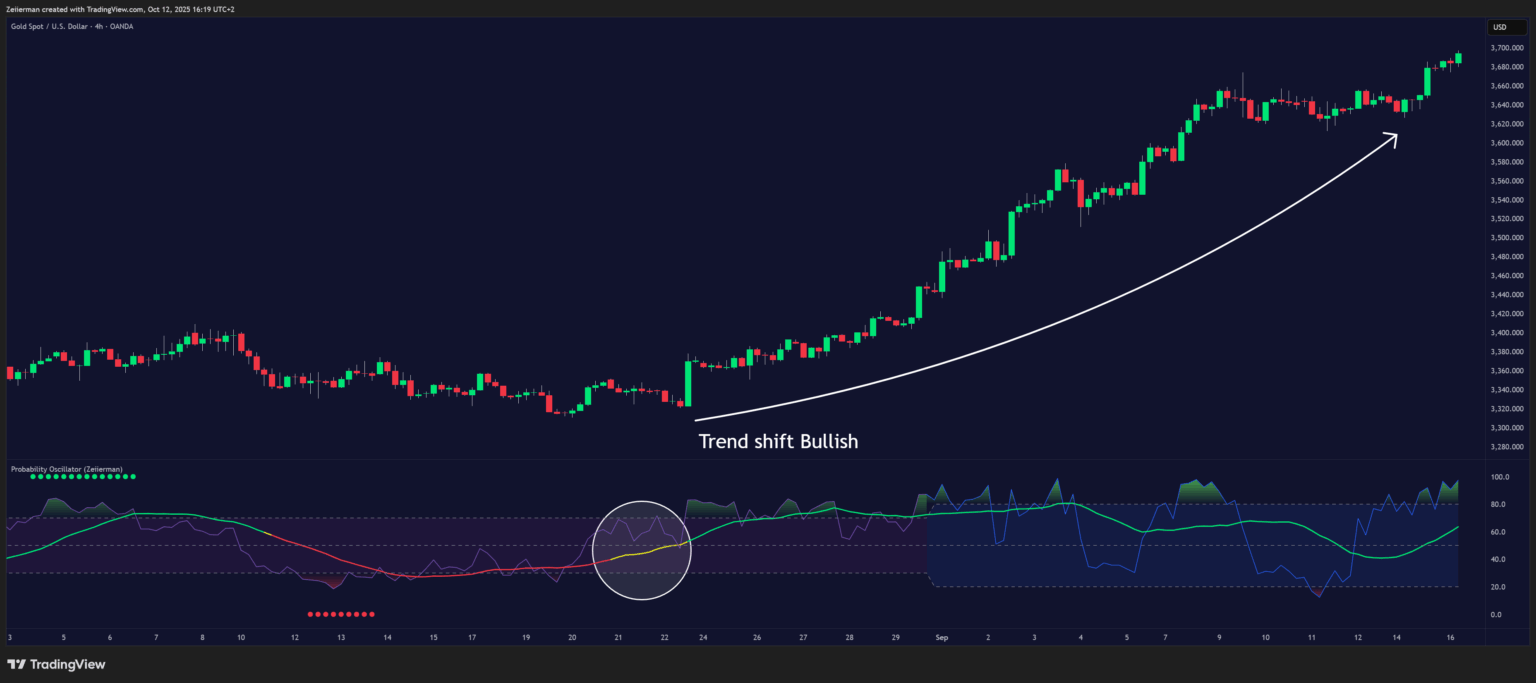
- When the line transitions from green → yellow → red, it indicates that the market is turning bearish.
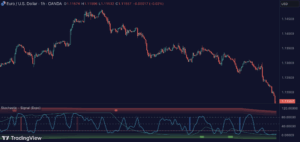
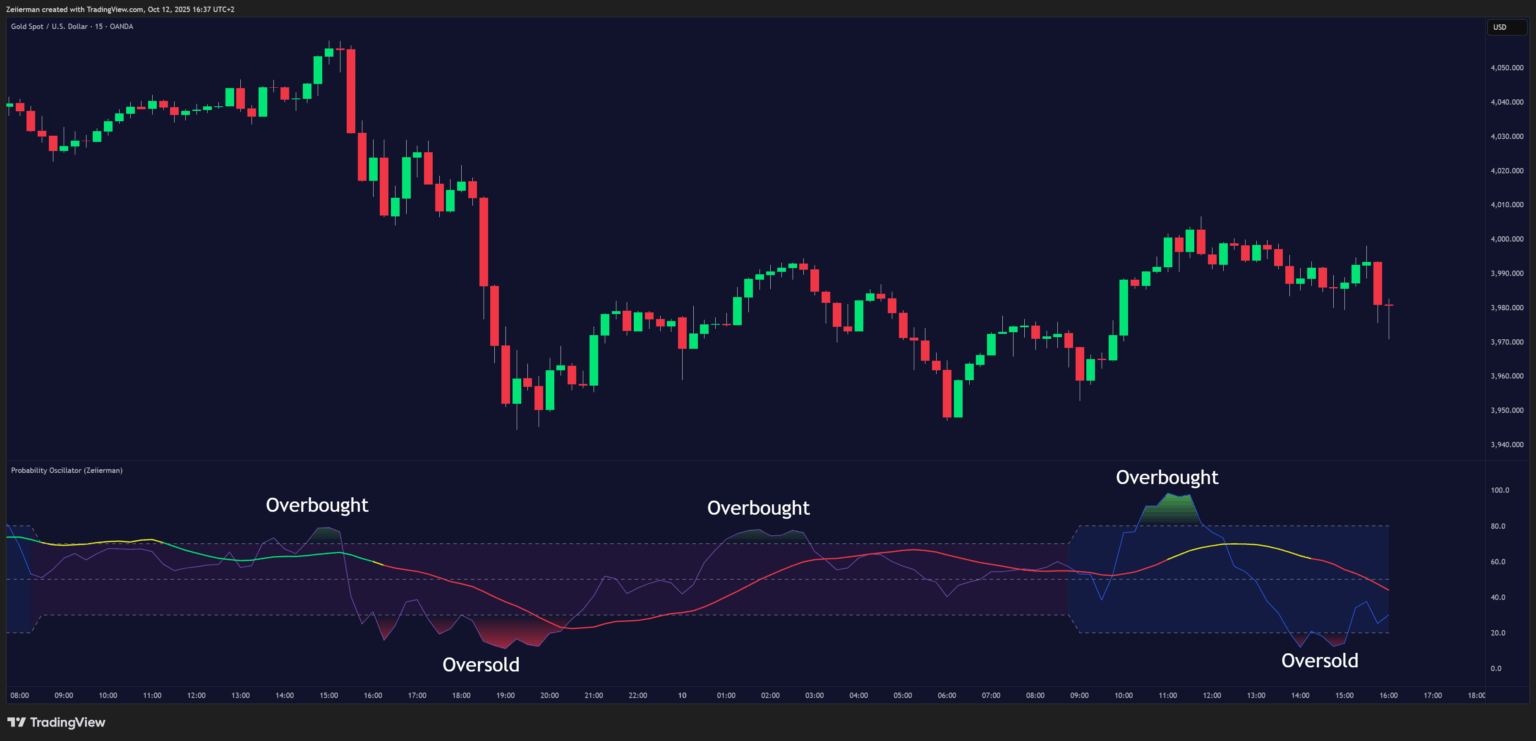
B. Overbought and Oversold
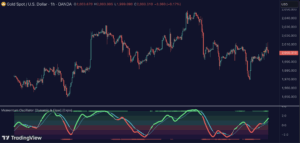
The Probability Oscillator can also be used to identify overbought and oversold conditions by observing when the probability line moves above the upper limit or below the lower limit. These events often signal potential market slowdowns, pullbacks, or even broader reversals.
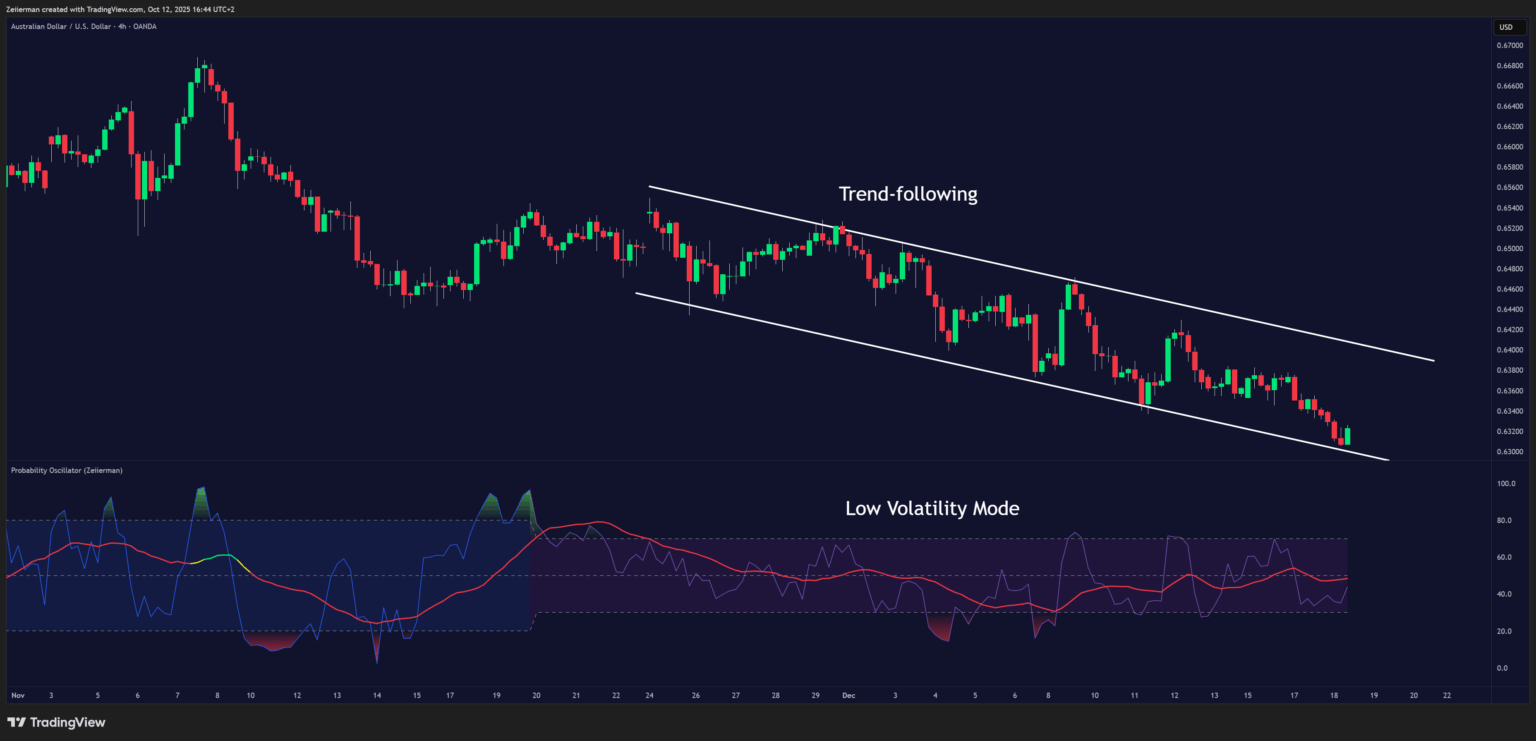
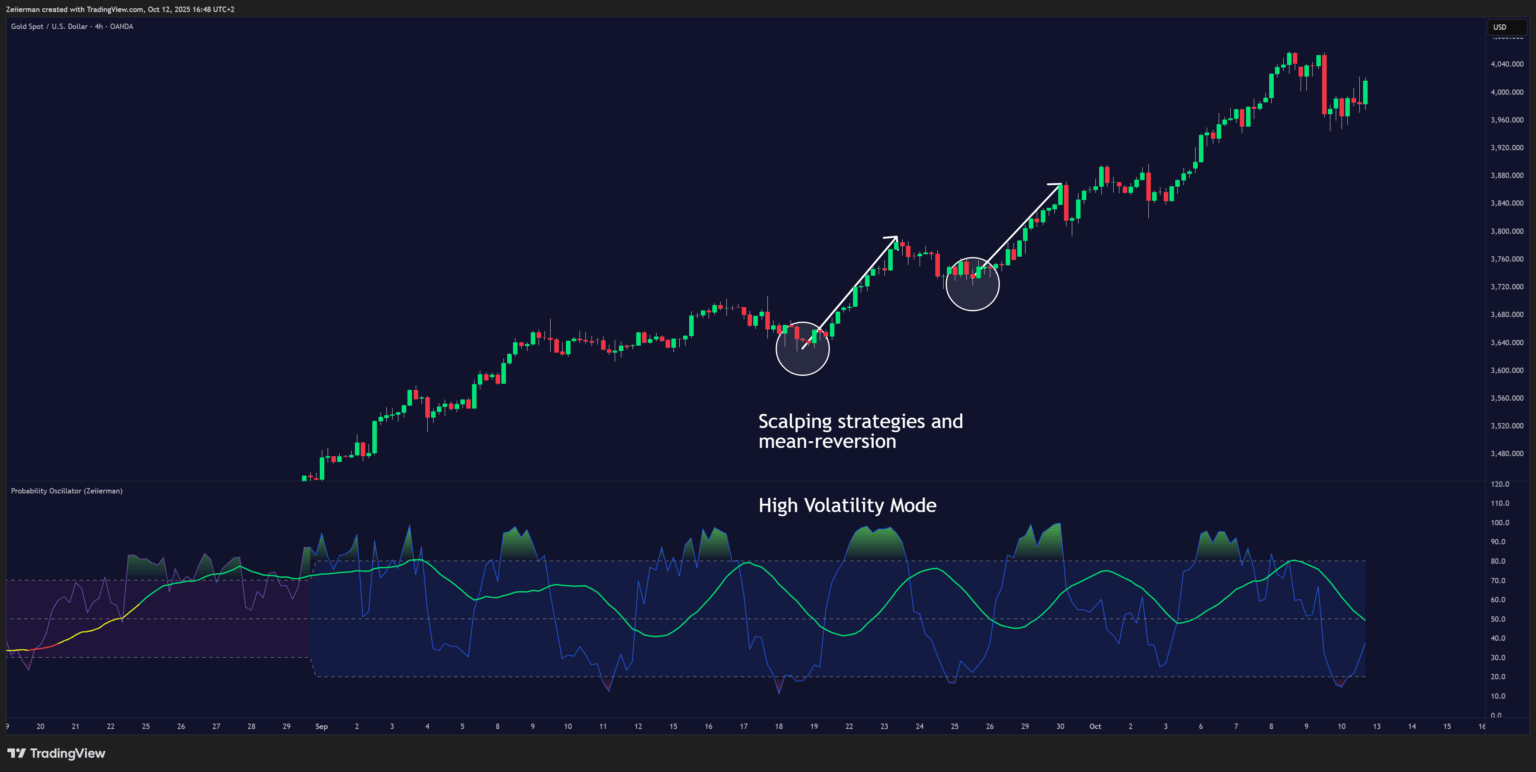
C. Using Volatility Modes to Choose the Right Strategy
One effective way to use the indicator is to determine which trading strategy best fits the current volatility regime.
During low-volatility periods, a trend-following approach is generally more favorable. These calm phases often last for extended periods, and markets tend to transition from low to high volatility over time. In such environments, it’s best to focus on the broader price direction and ride the trend rather than chase short-term fluctuations.
When the high-volatility mode activates, it’s time to trade more actively. Market movements become sharper and faster, creating opportunities to catch pullbacks, buy and sell at overbought or oversold levels, and capitalize on short-term momentum moves.
Scalping strategies and mean-reversion setups tend to perform best during these high-volatility conditions.
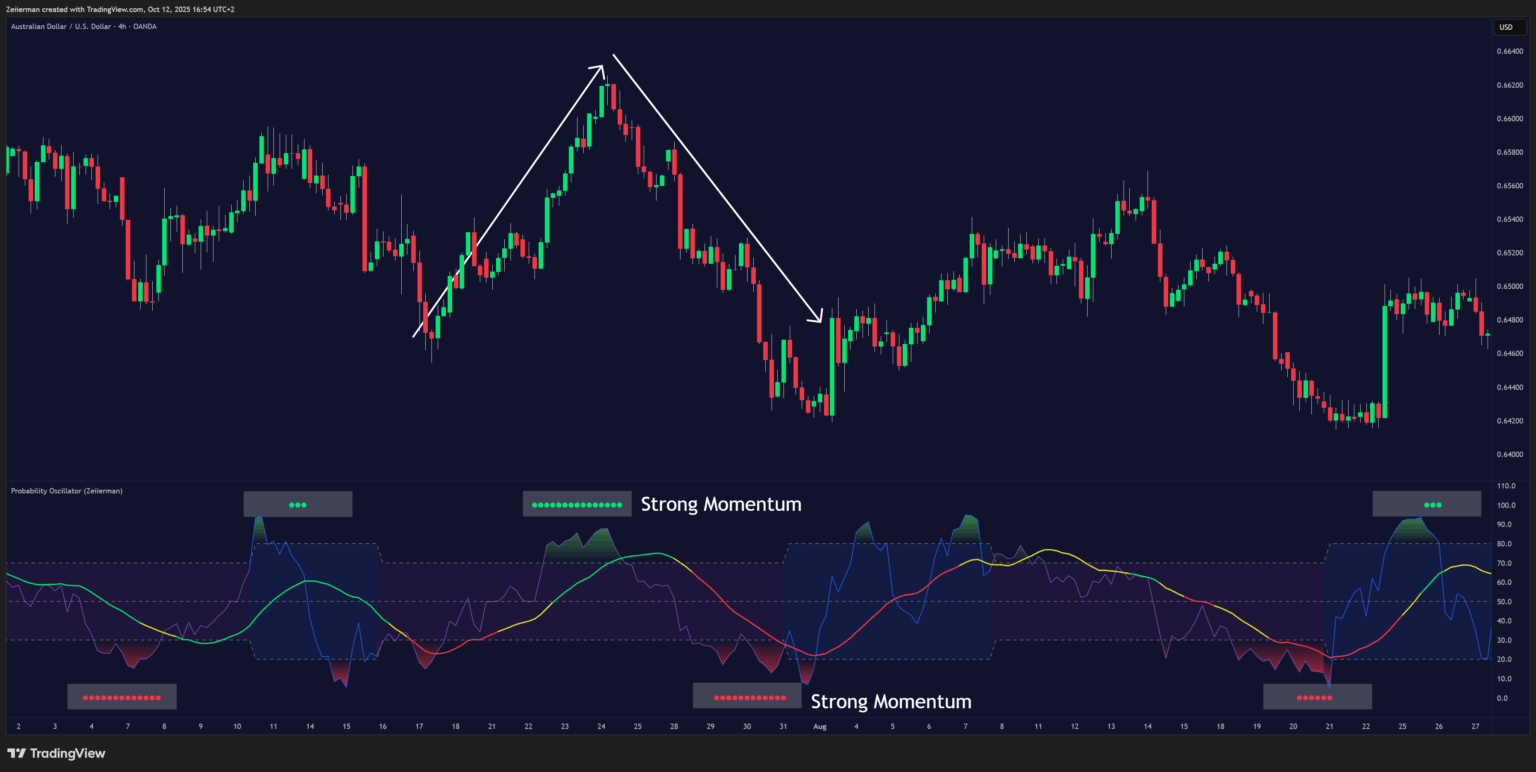
D. Impulse
The momentum impulses highlight periods when the market is experiencing strong directional momentum.
- Green dots indicate a strong bullish momentum move.
- Red dots indicate a strong bearish momentum move.
During ranging markets, these impulses can help confirm overbought and oversold conditions, signaling when reversals are highly likely. They can also be used to confirm breakouts and validate strong momentum moves when the market transitions from range-bound to trending behavior.
4. Recommended Strategies
A. Simple Strategy: Probability Oscillator
Goal: A beginner-friendly trend-scalping setup designed for high-volatility conditions.
This strategy aims to take advantage of the prevailing market trend and strong price momentum to find high-probability entries in the direction of the trend. It works across any market and timeframe.
Settings: Keep all settings at default.
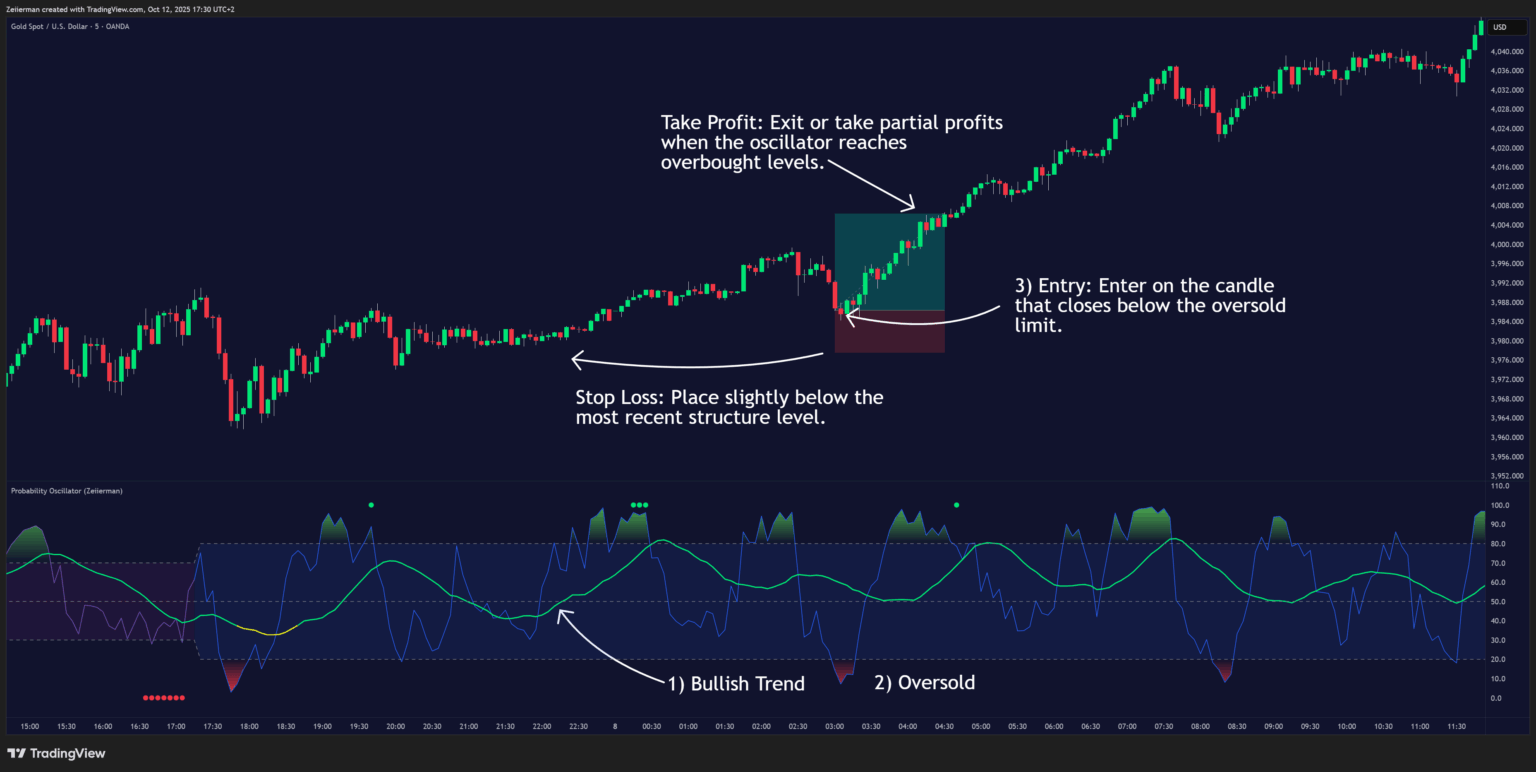
B. Long Setup (step-by-step)
Trend: The trend is determined by the color of the Signal Line.
- If the Signal Line is green, the market is in a bullish trend, and we should look for long entries.
Volatility Mode: This strategy utilizes high-volatility periods, so the Probability Oscillator should appear blue, with a blue background, indicating strong price swings that can be captured.
Trigger: The Probability Oscillator becomes oversold within a bullish trend.
Entry: Enter when the Probability Oscillator crosses back above the oversold limit (aggressive entry).
Stop Loss: Place your stop loss below the most recent swing low to protect against a deeper pullback.
Take Profit: Exit or take partial profits when the Probability Oscillator becomes overbought.
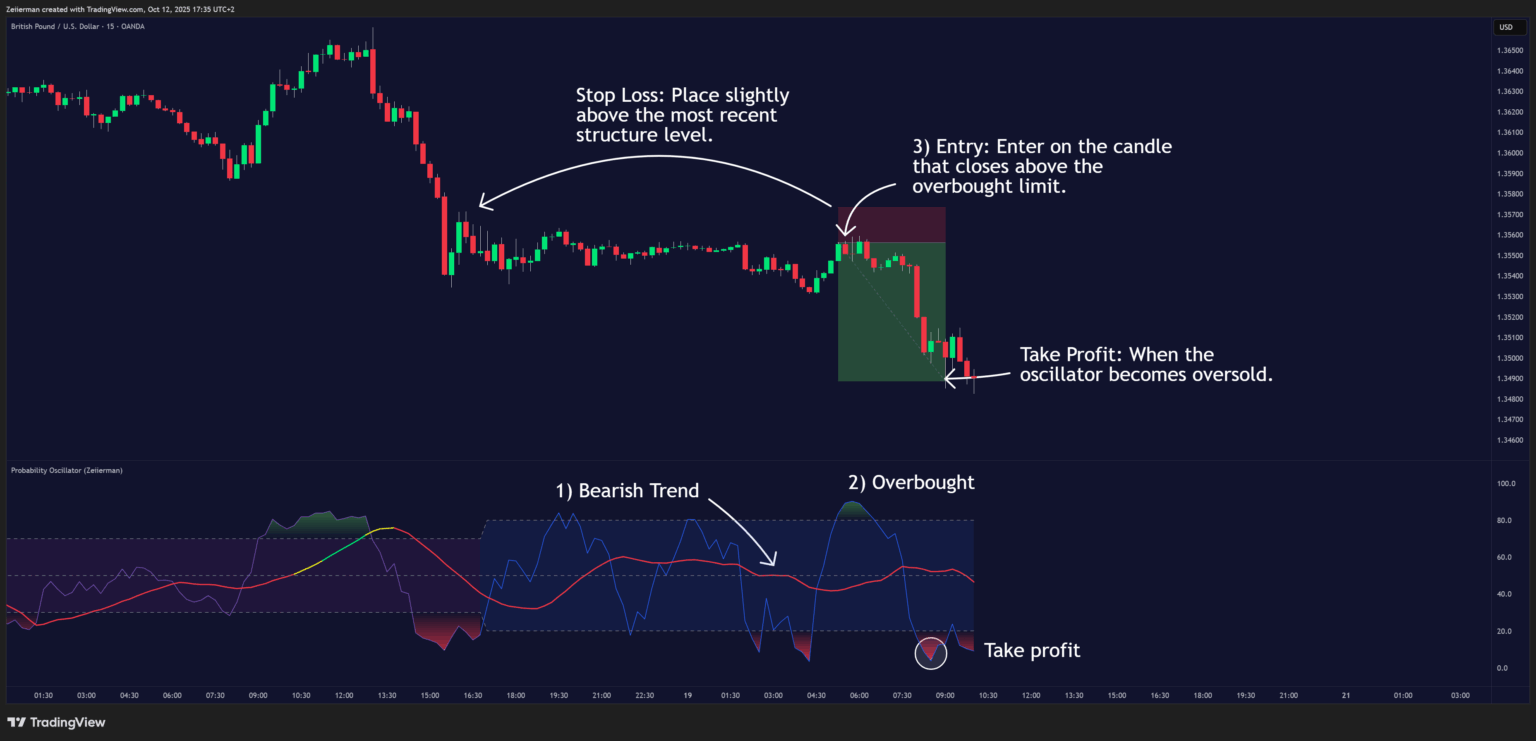
C. Short Setup (step-by-step)
Trend: The trend is determined by the color of the Signal Line.
- If the Signal Line is red, the market is in a bearish trend, and we should look for short entries.
Volatility Mode: This strategy utilizes high-volatility periods, so the Probability Oscillator should appear blue, with a blue background, indicating strong price swings that can be captured.
Trigger: The Probability Oscillator becomes overbought within a bearish trend.
Entry: Enter when the Probability Oscillator crosses back below the overbought limit (aggressive entry).
Stop Loss: Place your stop loss above the most recent swing high to protect against a reversal.
Take Profit: Exit or take partial profits when the Probability Oscillator becomes oversold.
5. Frequently Asked Questions (FAQs)
Q1: What do the colors mean on the Signal line?
- Green = bullish bias (probability favors upside continuation).
- Red = bearish bias (probability favors downside continuation).
- Yellow = indecision or transition (shift between regimes, low conviction).
Q2: What are the purple/blue background fills?
The background fill reflects the active mode of the probability framework:
- Purple fill = Indicates low-volatility mode, where the oscillator focuses on trend continuation and directional stability.
- Blue fill = Marks the high-volatility mode activation, signaling the bar where the model shifts into a volatility-driven regime.
This helps traders instantly see whether the oscillator is weighting trend-following or volatility dynamics.
Q3: How do the momentum dots help?
- Green dots = positive momentum impulses.
- Red dots = negative momentum impulses.
In trending conditions, impulses often confirm continuation entries. Near Overbought/Oversold levels, they can signal exhaustion, warn of false breakouts, or highlight potential reversals.
Q4: What’s the difference between the Probability Oscillator line and the Signal line?
- Probability Oscillator line (fast): Adapts quickly to price and mode (high volatility or low volatility). Reflects short-term probability shifts.
- Signal line (slow): Smoothed baseline that filters noise and defines the directional bias.
The Probability line provides early signals, while the Signal line validates trend or regime bias.
Q5: Which timeframes work best?
The oscillator is multi-timeframe:
- For higher timeframes (4H, Daily+), use longer Trend Lengths (20–50+) for smoother probability bias.
- For intraday or scalping, use shorter lengths for responsiveness.
Q6: Can I use alerts?
Yes. The oscillator is fully alert-ready. Traders can set alerts for regime shifts, impulses, OB/OS events, or line crosses.
Q7: Are alerts supported?
Yes. Built-in alerts include:
- Probability/Signal line crosses.
- Crosses above/below the 50 midline.
- Entry/Exit of Overbought or Oversold zones.
- Mode switches (trend ↔ volatility).
- Positive and negative momentum impulses.
Q8: How to reduce false signals?
- Increase Probability Length, Trend Length, or smoothing.
- Pay attention to the active mode (trend vs. volatility).
- Confirm signals with a 50-line reclaim or a break of recent swing structure.
Combine with price action or volume for added context.
Zeiierman
With over 16 years in the market, Zeiierman has extensive experience as a full-time trader and risk advisory consultant for hedge funds. He has developed many profitable trading strategies, drawing on his background in risk management and strategy execution.
More from Zeiierman