Works on the Following Platforms
TradingView
For use on the TradingView platform
Climax Volume is a powerful volume-based tool designed to identify market turning points driven by extreme activity. By detecting moments of volume climax — when price action becomes unsustainable — it helps traders anticipate potential reversals, pauses, or imbalances before key market shifts occur.
1. What Is Climax Volume?
Climax Volume is an advanced volume analysis indicator that spots abnormal spikes in trading activity relative to recent history. These spikes, called volume climaxes, signal exhaustion or acceleration in buying or selling pressure — moments when one side of the market becomes overly aggressive and price movement often stalls or reverses.
The indicator also includes a dynamic Point of Control (POC) system that tracks where the majority of trading volume clustered after a climax, acting as adaptive support and resistance over time.
2. How to Trade with Climax Volume (Zeiierman)
Climax Volume is versatile and can be used to identify turning points, potential breakouts, and fair value zones. It combines visual climax markers with a volume-weighted POC curve to help you interpret the flow of market strength.
A. Trend Following
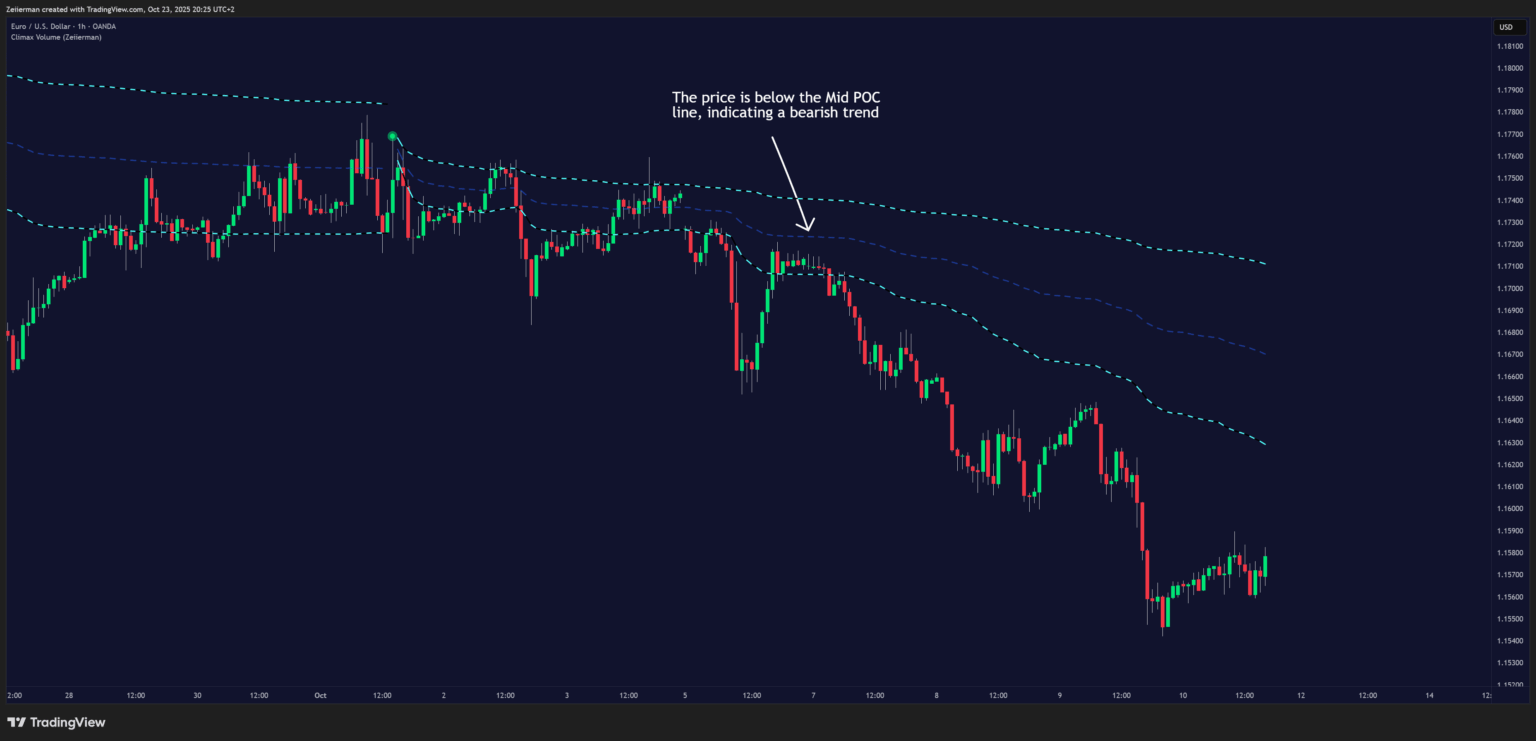
Use the Volume Point of Control (POC) line as a dynamic trend guide.
- When price holds above the POC, it often suggests sustained bullish sentiment.
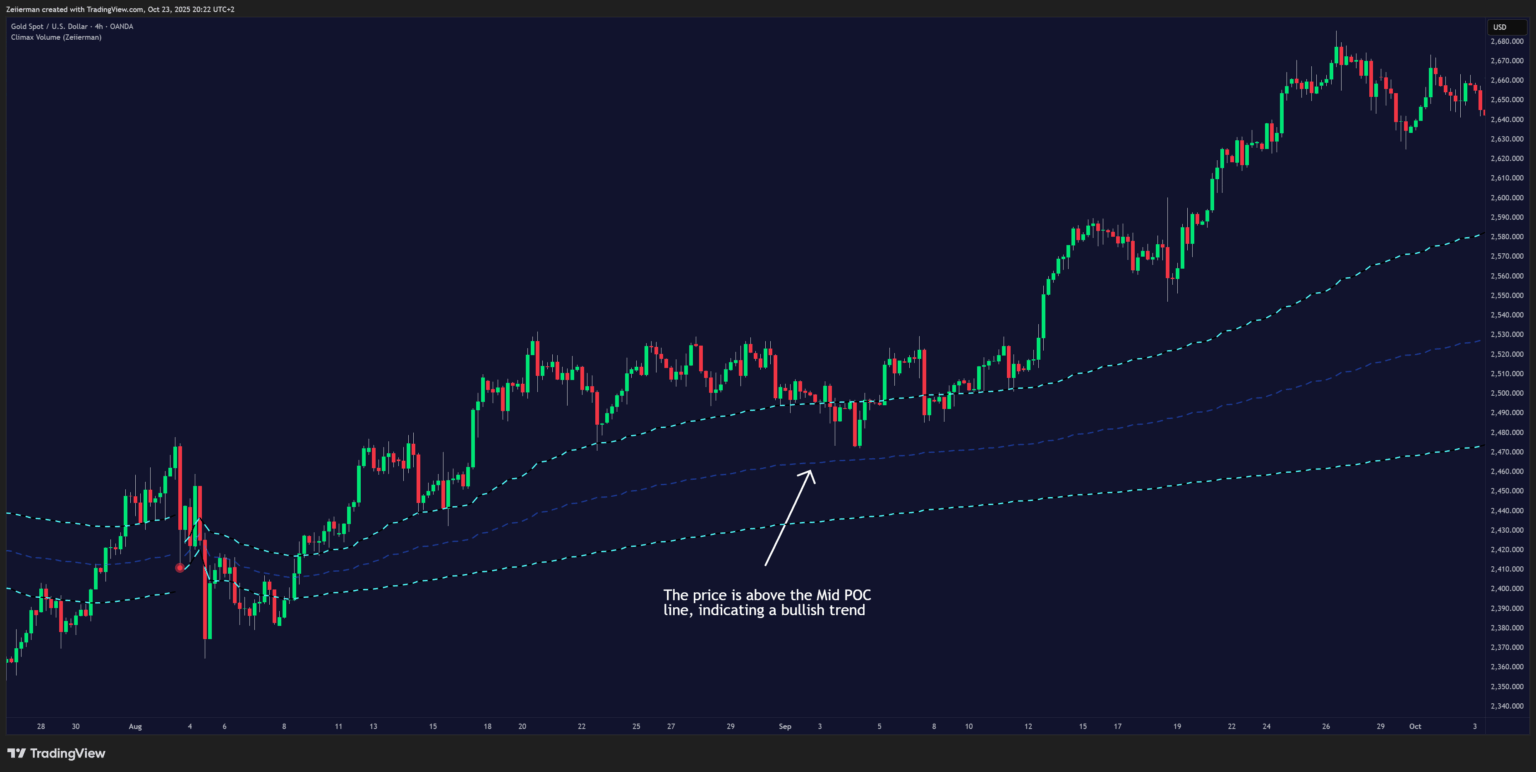
- When price stays below, it indicates bearish control.
B. Trend Continuations retest
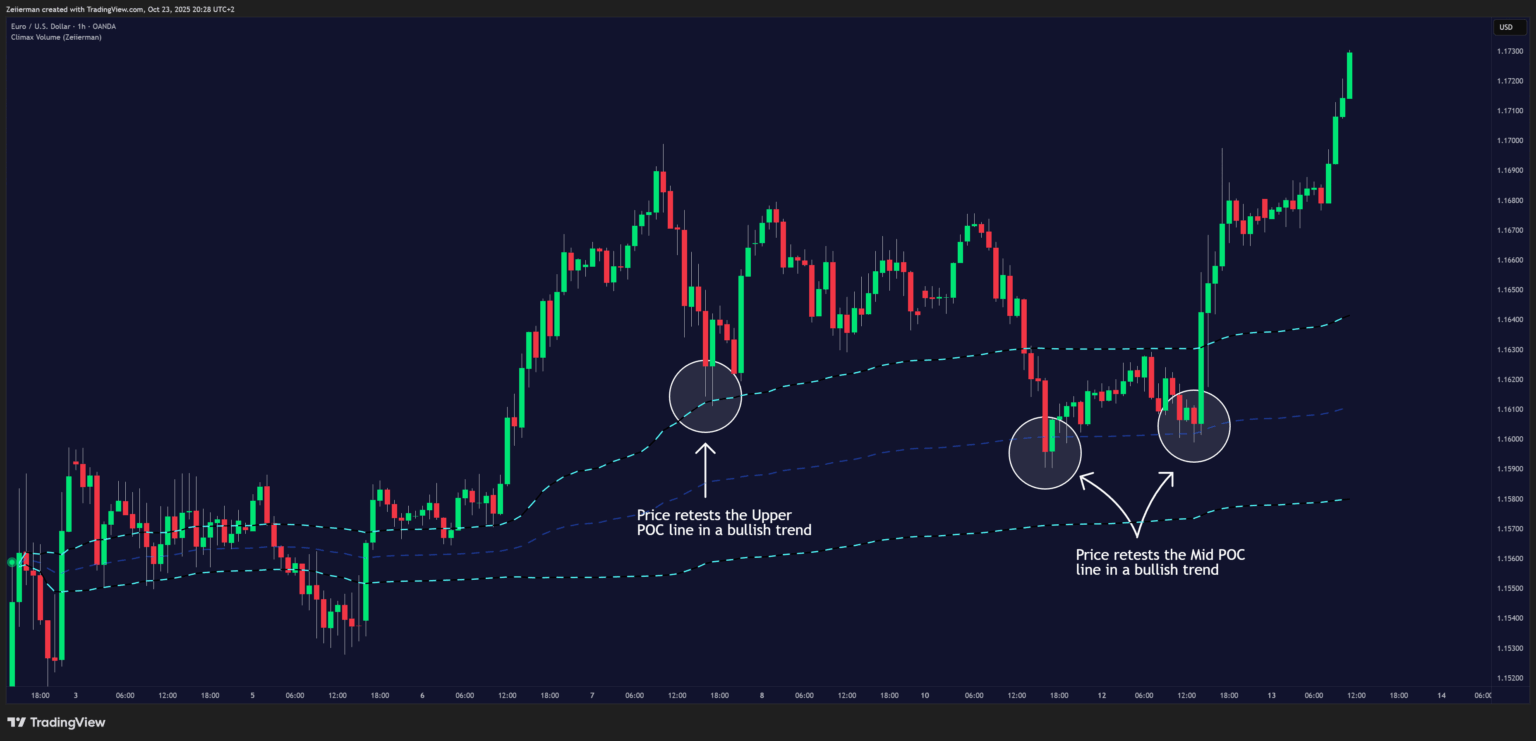
When the POC line has a strong slope, it reflects clear market momentum.
- In a bullish scenario, look for the price to retest the mid or upper POC line after a pullback. This retest often provides a high-probability continuation entry, signaling that buyers are defending control.
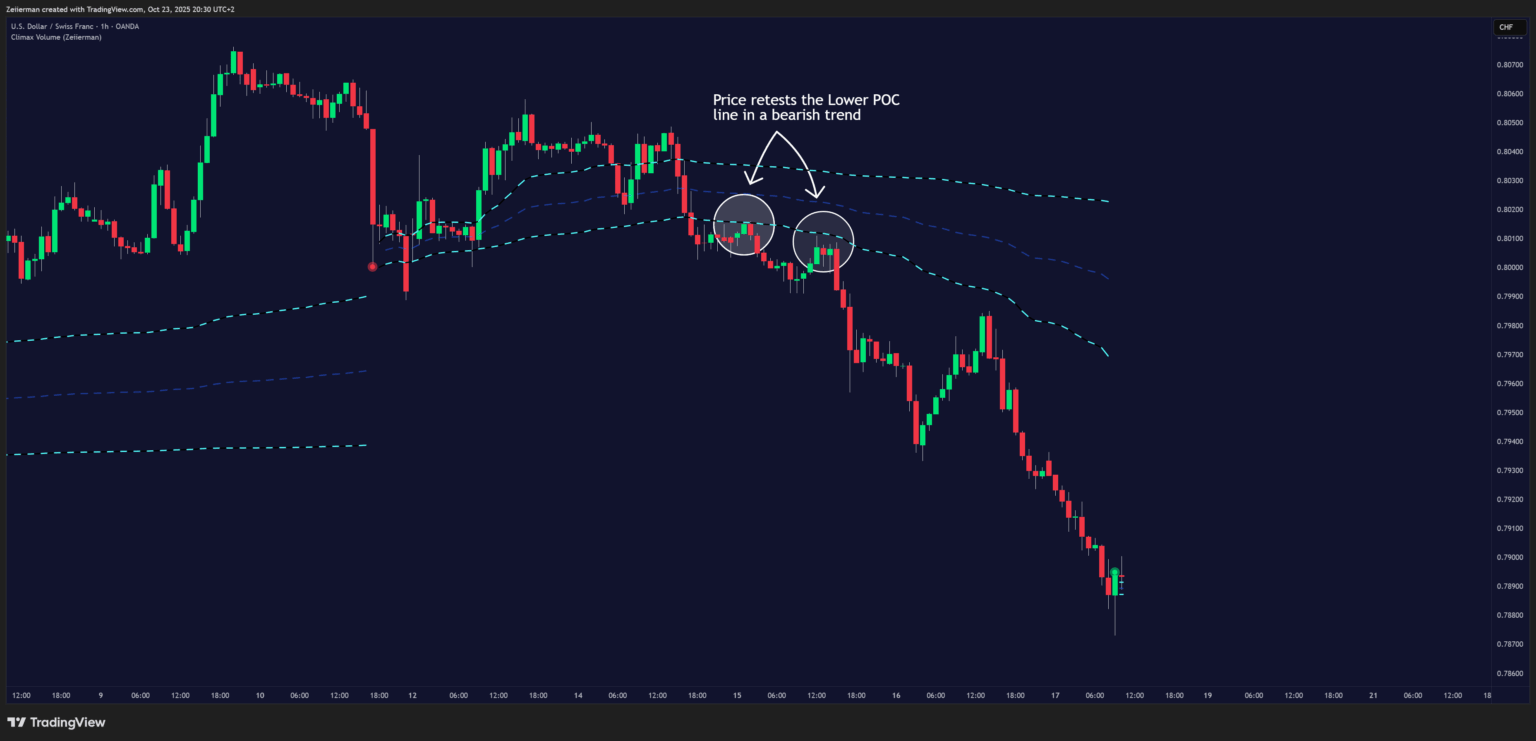
- In a bearish scenario, when the POC line slopes downward, wait for price to retest the mid or lower POC line from below. If the market rejects that area, it can mark the continuation of downside momentum.
The key is slope: the stronger the angle of the POC, the more momentum is present in the trend. Avoid flat lines — they suggest lack of conviction or range-bound conditions.
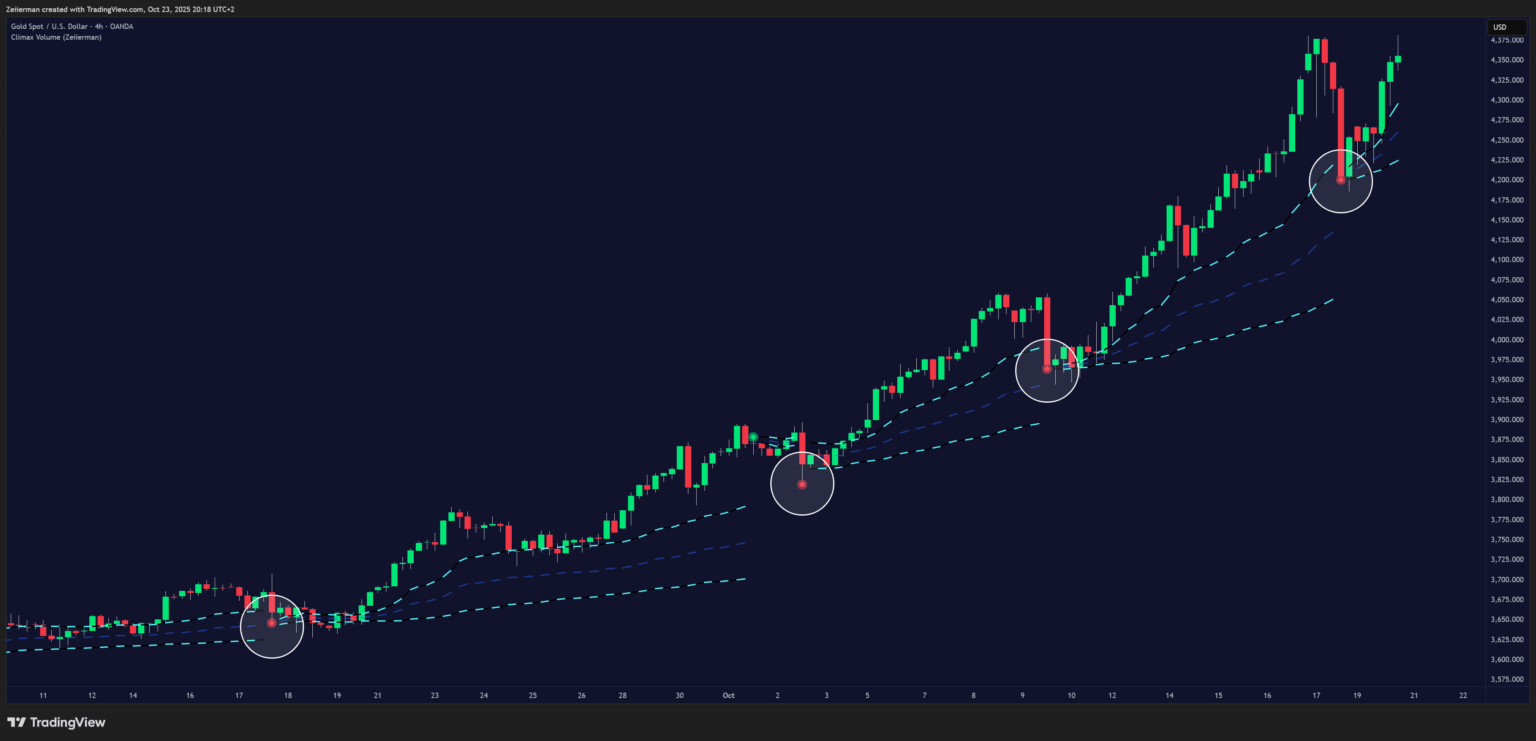
C. Reversals
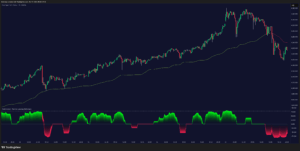
Look for Climax Points — color-coded circles that appear during moments of extreme volume.
- 🟢 Bullish Climax Points appear during high-volume surges to the upside.
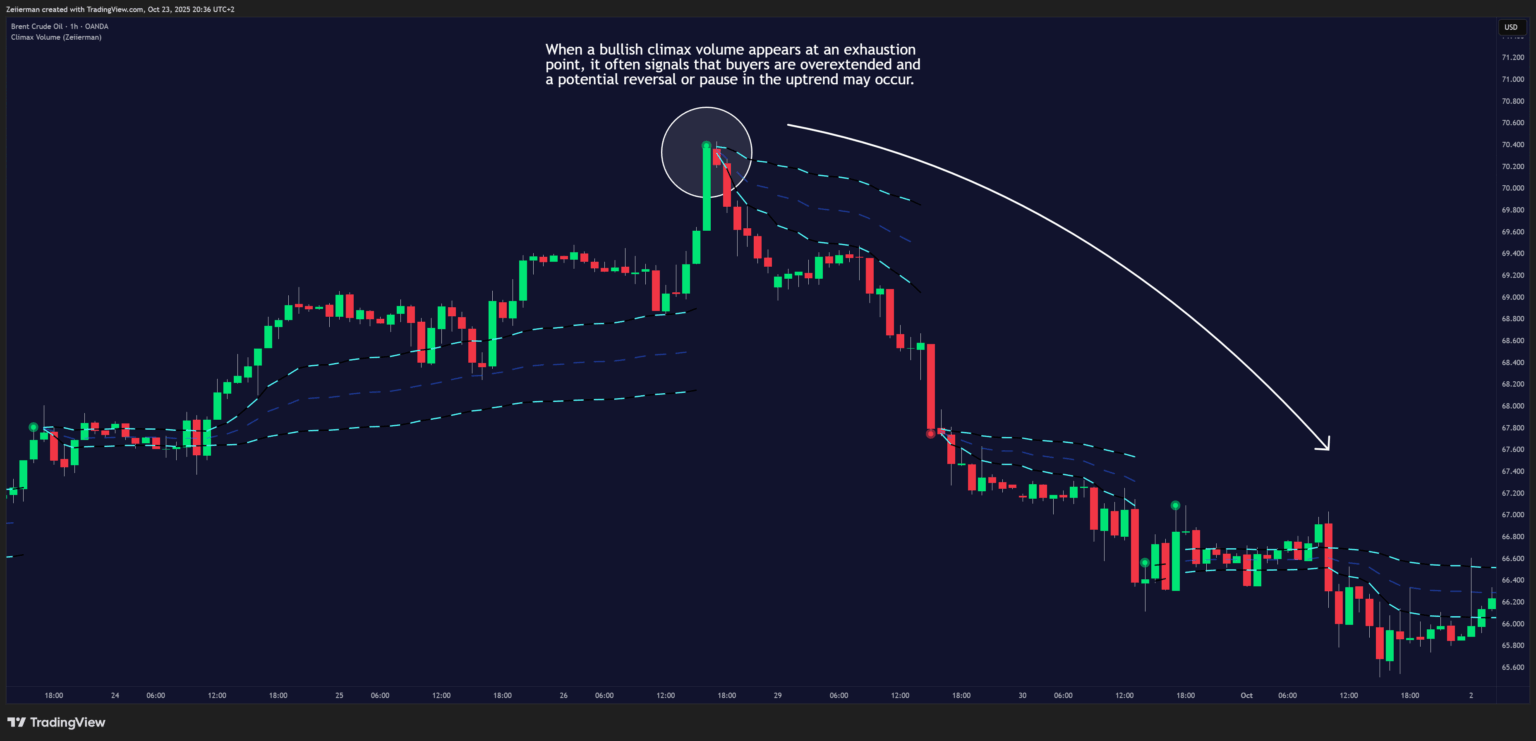
- 🔴 Bearish Climax Points appear during aggressive down moves.
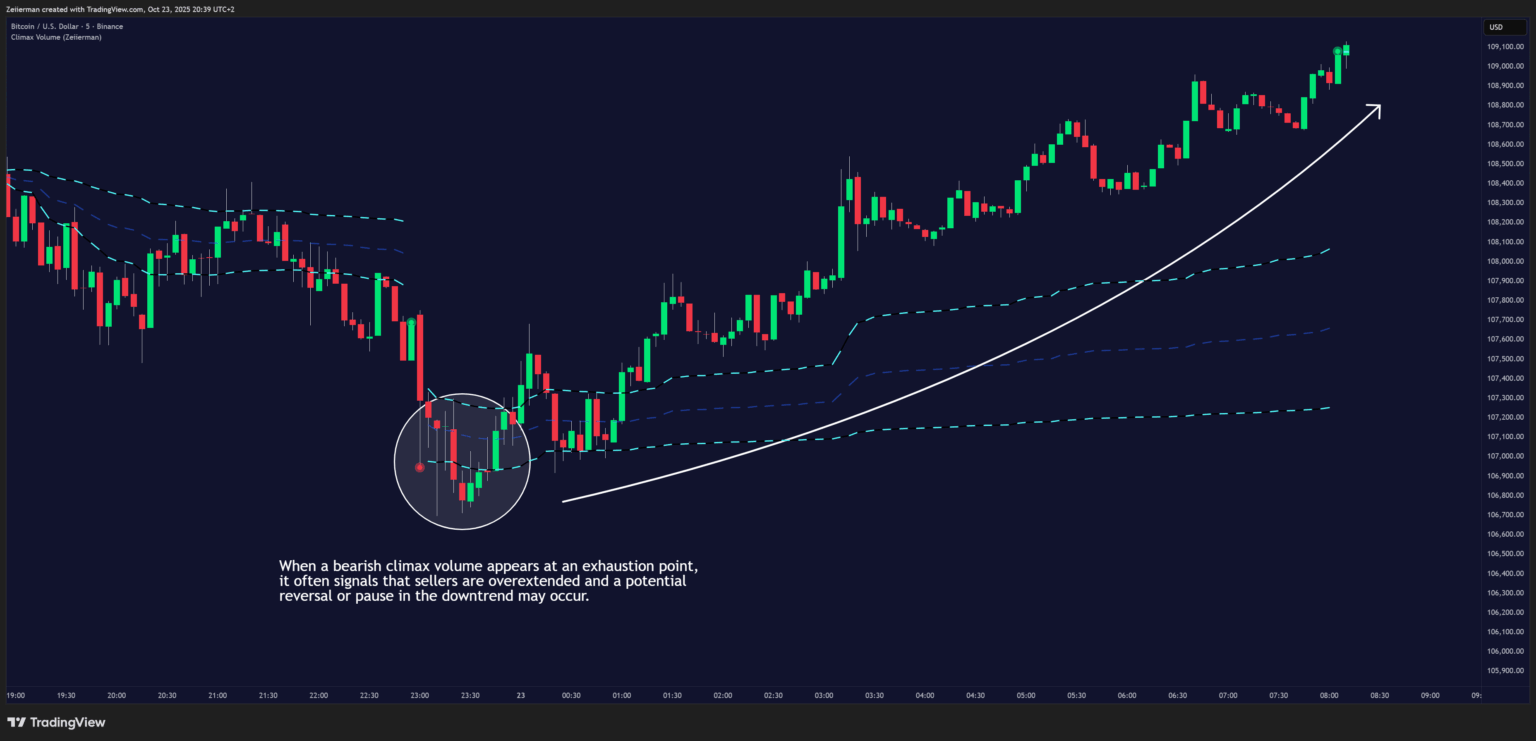
These often signal buyer or seller exhaustion, hinting that the market may soon pause or reverse direction.
D. Confirm breakouts
High-volume breakouts with Climax Volume signals often mark the start of strong moves.
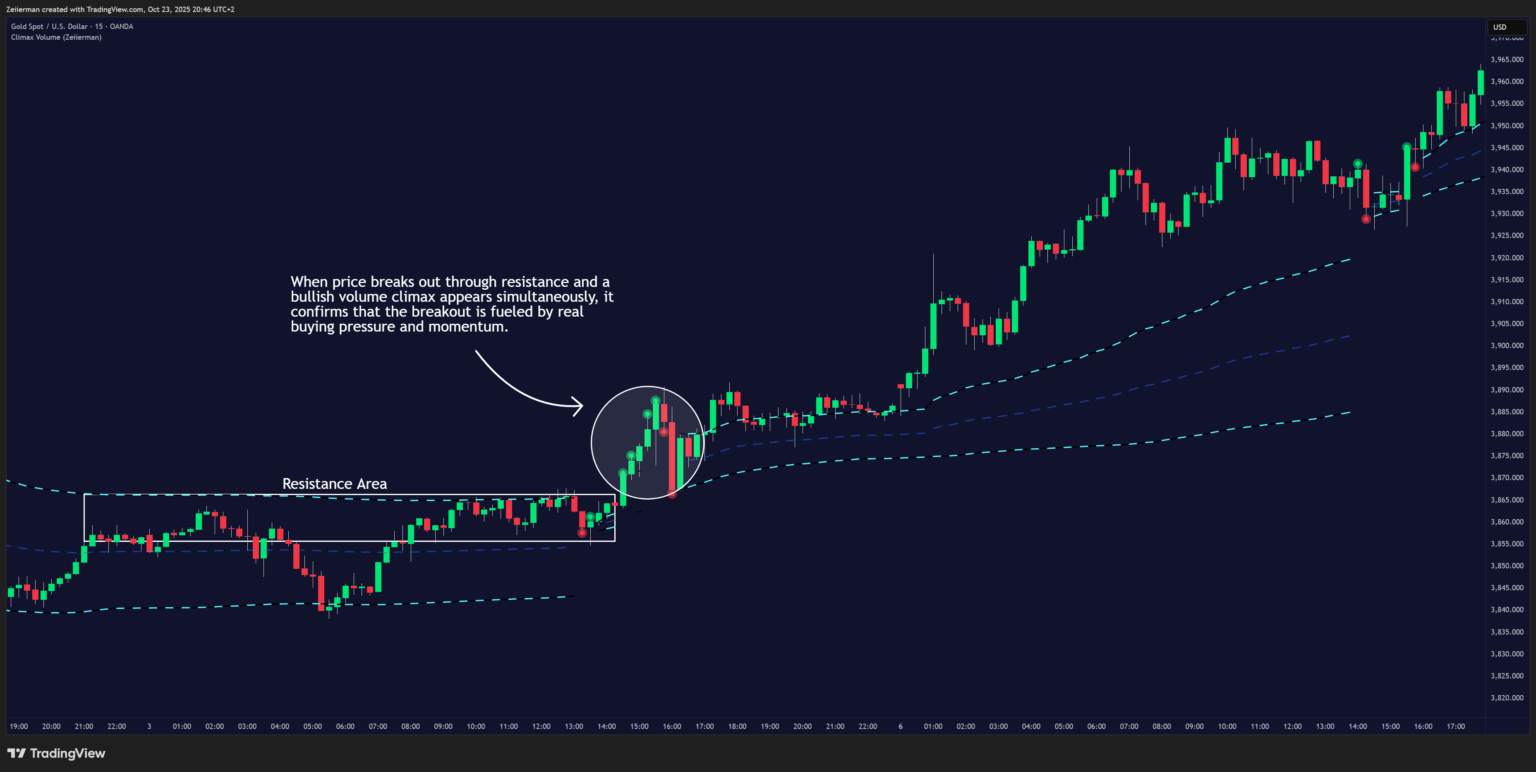
Map a strong support or resistance level manually or by using any of our premium tools.
- For a bullish breakout, if price breaks above the resistance zone and at the same time a green bullish climax point appears, it’s a strong sign that the breakout is backed by real volume — confirming that buyers are stepping in with conviction.
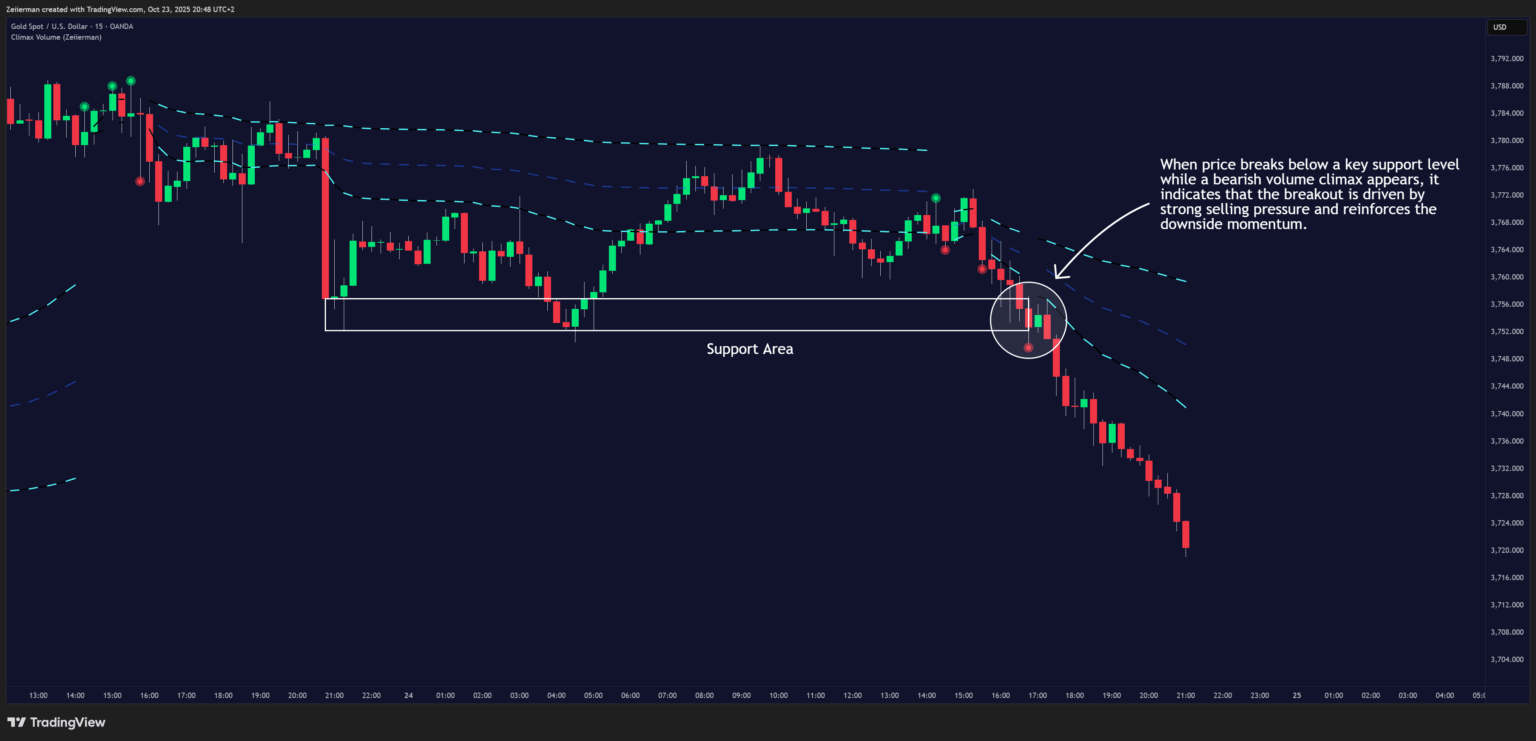
- For a bearish breakout, if price breaks below a key support zone and a red bearish climax point appears, it signals that the breakout is driven by strong selling pressure, increasing the likelihood of continuation to the downside.
These conditions show that the breakout is backed by real participation, increasing the likelihood of follow-through.
3. Simple Strategy: Climax Volume (Zeiierman)
Goal: This is a scalping strategy designed to take advantage of the sustained momentum that often occurs after Climax Volume points. It helps traders enter in the direction of an existing momentum move — trading with the market, not against it.
Settings: Increase the VolumeX Length to 500.
This setting helps capture broader, longer-lasting moves.
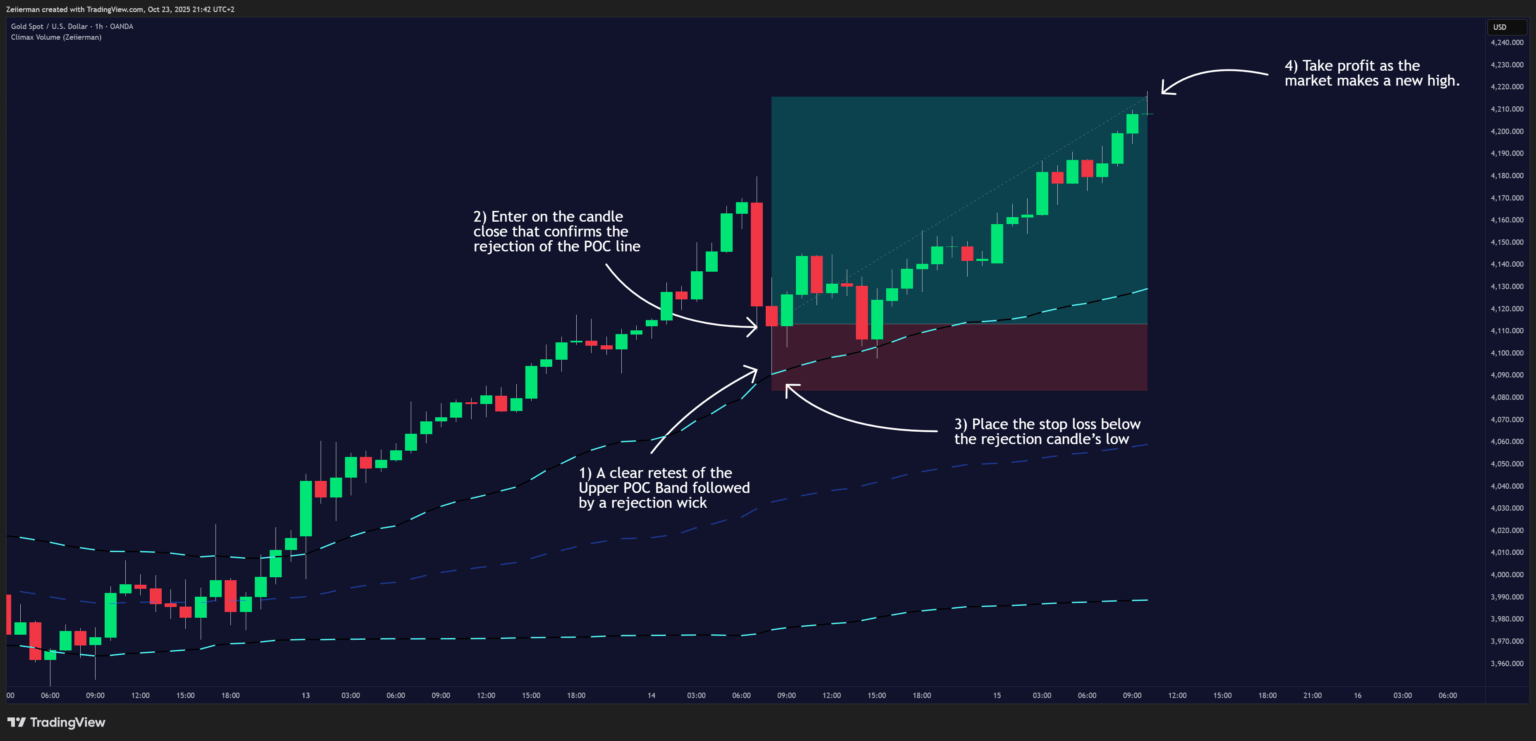
A. Long Setup (Step-by-Step)
Trigger: Wait for the market to make a clear retest of the Upper POC Band. Look for wick rejections or small fakeouts where price quickly recovers and holds above the Upper POC line.
These setups work best during active sessions such as London or New York for stronger volume follow-through.
Enter: Enter on the candle close that confirms the rejection of the POC line — for example, a bullish candle that forms after a rejection wick.
Stop Loss: Place the stop loss below the rejection candle’s low.
Take Profit: Aim for a new high above the most recent swing high.
Exit (Full): Fully exit the position once a new high is established or momentum begins to fade.
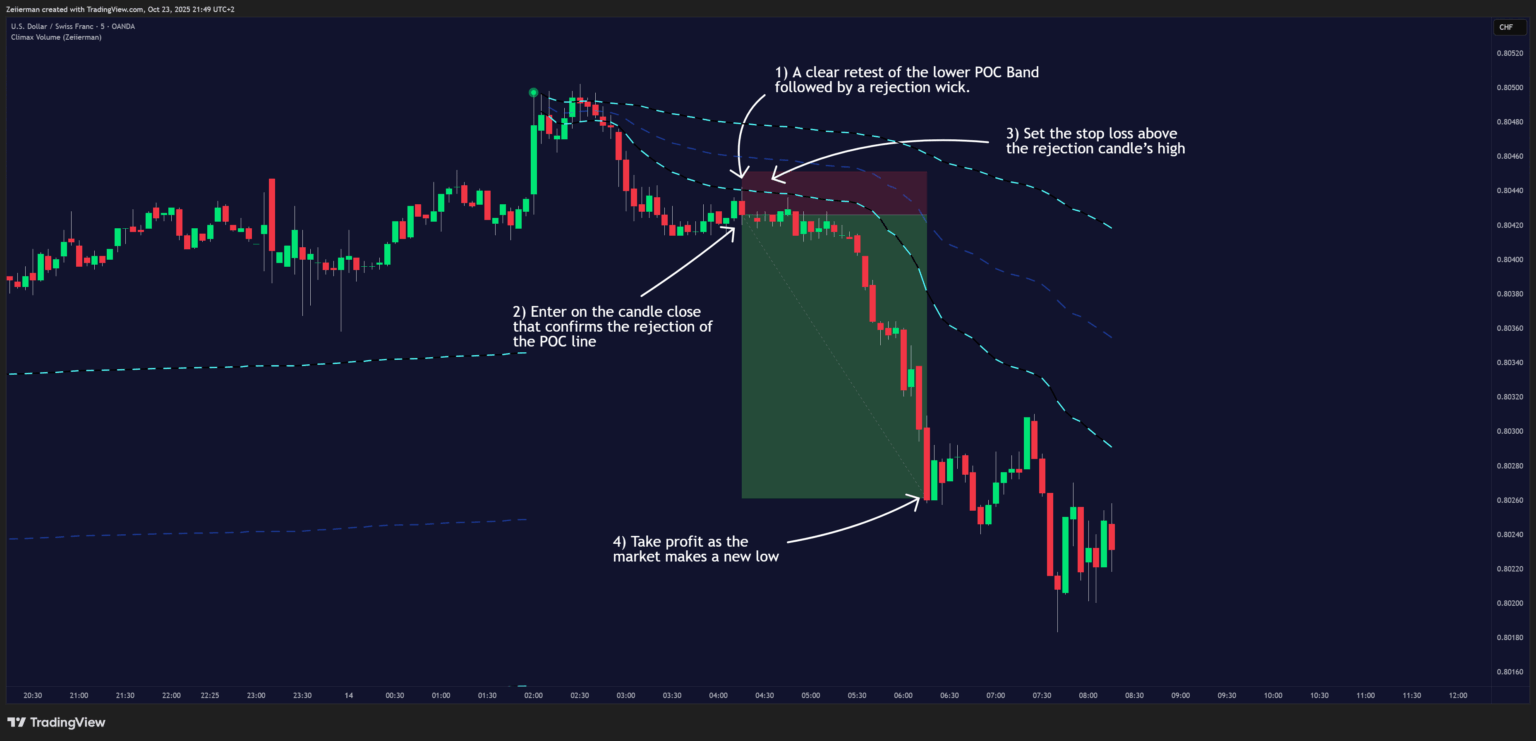
B. Short Setup (Step-by-Step)
Trigger: Wait for the market to make a clear retest of the Lower POC Band. Look for wick rejections or small fakeouts where price quickly turns down and holds below the Lower POC line.
These setups also perform best during high-volume sessions such as London or New York when volatility confirms direction.
Enter: Enter on the candle close that confirms the rejection of the POC line — for example, a bearish candle forming after a rejection wick.
Stop Loss: Set the stop loss above the rejection candle’s high.
Take Profit: Aim for a new low below the most recent swing low.
Exit (Full): Fully exit the trade once a new low is made or selling momentum begins to weaken.
4. Settings Explained
VolumeX Length: Sets the number of bars used to analyze and detect volume climax points. A longer period offers a smoother, broader view of activity, while a shorter period responds faster to recent spikes.
Volume Climax Points: Toggles the visual display of color-coded circles marking high-volume climax points. These help you instantly spot volume-driven turning points in price.
Volume Climax Point of Control (POC): Enables plotting of the Point of Control, showing the price level where volume concentrated after a climax event. This acts as dynamic support/resistance and helps define fair value zones.
Width (Standard Deviation Multiplier): Adjusts the distance of the POC Bands around the main POC line. Higher values create wider tolerance zones, useful in volatile markets; lower values narrow the range for more precise readings.
Colors and Line Thickness: Customize the POC line color, band color, and thickness for better visibility. The default scheme uses blue for the main POC line, and cyan tones for upper and lower control bands.
Quick Tuning Tips
These guidelines help you optimize Climax Volume (Zeiierman) for different trading styles and market conditions. Adjusting the inputs allows you to fine-tune responsiveness, smoothness, and signal precision.
1. Scalping / Fast Markets
If you trade short timeframes or highly volatile sessions:
- Use a shorter VolumeX Length to detect volume spikes faster.
- Reduce the Width (Standard Deviation Multiplier) for tighter POC bands and quicker reaction zones.
- Enable Climax Circles for immediate visual alerts on short-term spikes.
- Lower the POC Line Thickness if you prefer a cleaner, lightweight display during high-speed trading.
Result: A more responsive setup that highlights quick surges and micro-reversals. Ideal for scalpers and active day traders, though it may produce more frequent signals and require disciplined filtering.
2. Swing / Trend Following
If your goal is to capture larger, sustained market moves:
- Increase VolumeX Length to smooth the detection of major climax events.
- Keep the POC Bands slightly wider (raise the Standard Deviation Multiplier) to define broader fair value zones.
- Focus on the slope of the POC line to stay aligned with the dominant trend direction.
- Use Climax Points as confirmation, not standalone entry triggers.
Result: A steadier, more trend-focused configuration that filters short-term noise and helps you stay aligned with long-term volume-driven direction. Best suited for swing or position traders.
3. Reducing Noise / Choppy Markets
When the market is sideways or inconsistent:
- Increase VolumeX Length to filter out minor fluctuations.
- Use wider POC Bands to avoid reacting to every small move.
- Consider disabling Climax Circles to keep the chart clean during low-volume periods.
- Watch how price interacts with the main POC line — genuine breakouts from a flat POC often indicate the next directional shift.
Result: A calmer, more selective setup that avoids false spikes and focuses on meaningful shifts in volume and structure. Excellent for range trading and consolidation analysis
5. FAQ: Climax Volume (Zeiierman)
Q1: What does a Climax Point mean?
A Climax Point represents an extreme in volume activity — a moment when buying or selling becomes unsustainable. It often signals potential trend exhaustion or a short-term reversal.
Q2: Can I use Climax Volume for all timeframes?
Yes. It adapts well to intraday, swing, and even position trading since it measures relative volume intensity within each timeframe.
Q3: How reliable are Climax Points for reversals?
They are signals of excess, not guaranteed reversals. Always combine them with structure, trend context, or other confirmation tools like trendlines, VWAP, or RSI.
Q4: What is the Point of Control used for?
The POC highlights where the market’s post-climax trading effort concentrated. It often acts as magnetic support/resistance and helps identify fair value zones or key reaction levels.
Q5: Can I hide the visual markers or bands?
Yes. You can disable Climax Circles or POC Bands in the settings menu to simplify your chart view.
Q6: Who should use this indicator?
- Traders looking to spot exhaustion or aggressive volume surges
- Intraday and swing traders analyzing volume imbalances
- Anyone who uses volume and structure as part of their trading edge
- Traders seeking fair value zones after volatile moves
Q7: How can I trade trend continuations with Climax Volume?
When the POC line has a clear slope, it reflects strong market momentum.
- In an uptrend, look for price to retest the upper or mid POC line after a pullback — a sign that buyers are defending control.
- In a downtrend, wait for price to retest the lower or mid POC line from below — a strong continuation setup for sellers.
Avoid flat POC lines, as they indicate low momentum or ranging conditions.
Q8: How do I confirm a breakout using Climax Volume?
Map a strong support or resistance zone manually or with any of our premium tools.
- For a bullish breakout, if price breaks above resistance and a green bullish climax appears, it confirms strong buying volume backing the move.
- For a bearish breakout, if price breaks below support and a red bearish climax appears, it confirms heavy selling volume and likely continuation.
Q9: What does the slope of the POC line indicate?
The slope of the POC line shows market momentum.
- A rising POC indicates strengthening bullish control.
- A falling POC shows sustained bearish pressure.
The steeper the slope, the stronger the trend; a flat slope signals consolidation or indecision.
Q10: How should I use the Upper and Lower POC Bands?
These bands define a tolerance zone around the main POC line.
- Use the upper band to identify potential overbought or breakout zones.
- Use the lower band to spot oversold or exhaustion zones. They also help visualize range pressure and breakout potential.
Q11: What happens after a Climax event?
After a volume climax, the market often seeks balance. The indicator recalculates the volume-weighted POC, showing where volume consolidates next — this becomes a new area of fair value or potential reaction.
Q12: Can I use Climax Volume for entries and exits?
Yes.
- Entries: Look for Climax Points followed by price reaction near the POC.
- Exits: Watch for opposite climax signals or price reaching the upper/lower POC Bands, which often mark exhaustion zones.
Q13: How do I know if a Climax Point is meaningful?
A valid climax usually aligns with strong price movement and a visible spike in volume compared to recent bars.
Combine it with context — for example, a climax at key structure or POC retests has higher reliability than one in the middle of a range
Q14: Does Climax Volume repaint?
No. Once a climax event is confirmed, it remains fixed on the chart. The POC line, however, updates dynamically as new volume data accumulates.
Q15: Can Climax Volume be used with other indicators?
Absolutely. It works best when paired with trend structure tools (like moving averages, VWAP, or market profile) and momentum indicators to build high-confluence setups.
Zeiierman
With over 16 years in the market, Zeiierman has extensive experience as a full-time trader and risk advisory consultant for hedge funds. He has developed many profitable trading strategies, drawing on his background in risk management and strategy execution.
More from Zeiierman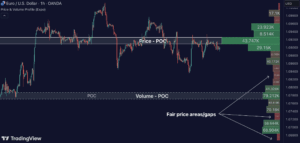
![Trend Analysis [Ultimate]](https://www.zeiierman.com/wp-content/uploads/2025/03/Trend-Analysis-Ultimate-Update-300x151.png)