Works on the Following Platforms
TradingView
For use on the TradingView platform
Exhaustion volume is a trading concept used to identify market tops and bottoms. It is based on the idea that a market trend will continue until it runs out of momentum. This momentum is expressed through the volume of trades being done at any given point in time. When the volume of trades starts to drop off, this indicates that the trend is reaching its end, or is “exhausted.” Traders can then use this information to enter or exit a position in the market.
Exhaustion volume is a measure of trading volume in a particular security that is greater than any previous volume seen in the past few days or weeks. Typically, exhaustion volume is an indicator of a sharp price move in either direction. It is most commonly used as a technical indicator to identify potential reversals in a stock’s trend. By observing exhaustion volume, traders can determine when a stock has reached a point of being overbought or oversold. When exhaustion volume is seen at these levels, traders may then enter a trade in anticipation of the price of the security reversing.
Exhaustion volume is a trading strategy that involves looking for large increases in volume at the end of a trend. This is often seen as a sign that the trend is coming to an end and traders may use this as a cue to enter a trade in the opposite direction. Exhaustion volume can also be used to confirm the trend and as an indication for when to exit a trade. Traders should be aware that large volume does not always indicate an exhaustion of the trend and other indicators should be used in conjunction with volume analysis to make a trading decision.
Exhausted volume indicator
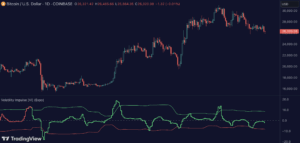
The exhausted Volume indicator visualizes exhausted volume. Exhaustion often signals the reversal of a current trend because it illustrates excess supply or demand levels, indicating a market is either overbought or oversold.
The indicator can also be used to detect volume pressure in either direction, which can occur in breakouts or reversal points.
- Volume pressure is seen in reversal points.
- Volume pressure can be seen in breakouts.
HOW TO USE
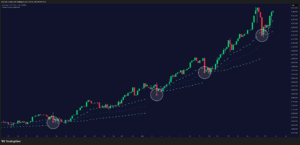
It is used to identify potential trend reversals, as well as potential price breakouts. To use the exhaustion volume indicator, traders will first need to identify a security that is exhibiting a strong trend in either direction. Once this has been identified, traders can then look for periods of high volume in the security. If the volume is unusually high, and is followed by a decrease in volume, this can indicate that the current trend is nearing its end and may be ready to reverse. Traders can then use this information to consider entering a trade in the opposite direction of the current trend.
1. Use the indicator to identify trend reversals
2. Use the indicator to identify price breakouts.
3. Use the indicator to identify reversal points.
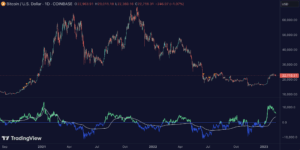
Combine it with our Climax Volume Indicator
Combine the indicator with Climax Volume (Zeiierman)
Zeiierman
With over 16 years in the market, Zeiierman has extensive experience as a full-time trader and risk advisory consultant for hedge funds. He has developed many profitable trading strategies, drawing on his background in risk management and strategy execution.
More from Zeiierman