In lay terms, volatility is how much and how quickly the price of a stock, crypto, or other asset moves over a given period. It shapes both risk and opportunity: high volatility brings larger price swings, with higher profit potential and greater risk. On the other hand, low volatility means calmer markets with smaller and stable moves.
Most retail traders brush volatility off as a simple fundamental metric, and they try to chase a complex strategy to book their next profits. But that’s not how smart money works. @SM_Trader and I often use volatility to guide our strategies at Zeiierman Trading.
Today, I’ll talk about what volatility is, how traders measure it, what causes it, and how it impacts different trading styles. I’ll also walk you through a practical volatility-based strategy and proven rules for position sizing and stop placement so you can approach volatile markets with confidence.
1. Basics of Volatility
In mathematical terms, volatility is the statistical measure of how much the returns of a financial asset or market index fluctuate over a specific period. It shows the magnitude (extent) of price changes, not the direction.
The most common way it’s calculated is through standard deviation: a higher standard deviation means a wider price swing, therefore higher volatility, and vice versa. We measure these in one of two ways:
- Historical Volatility
This is calculated from an asset’s past price data. Historical volatility provides an objective measure of how volatile an asset has been over a specific period, such as 30, 60, or 90 days. It’s calculated from actual price movements and gives you a baseline for the stock’s or market’s normal volatility.
- Implied Volatility
Implied volatility is obtained from the current market prices of options contracts and reflects the market’s overall expectation of future volatility for the particular asset. Implied volatility is a bit risky as it is highly affected by the sentiments of the traders like for example, when everyone’s nervous about earnings or economic announcements, implied volatility shoots up.
Why does this theory matter, you ask? The interesting thing here is that the gap between historical and implied volatility may create trading opportunities. When implied volatility is much higher than historical volatility, it’s a sign telling you that options could be overpriced. When it’s lower, they might be cheap.
Read: How to Trade in Volatile Markets? 4 Crucial Investment Strategies by Pros2. Tools and Indicators for Volatility Trading
It’s time! Let’s get to the fun part.
I. Average True Range (ATR)
The Average True Range is one of the simplest yet most effective ways to measure volatility. ATR doesn’t indicate direction, but it does give you the average amount an asset moves over a given timeframe. A higher ATR reading means bigger daily swings, while a lower ATR shows a calmer market.
Zeiierman’s ATR Trend & ATR Top/Bottom indicator blends trend elements with ATR to help in recognising the directional movement, which can help you make a decision-making process for better entry and exit points.
II. Bollinger Bands
Bollinger Bands are one of the classic tools most often used for volatility trading. They consist of a middle band, which is a simple moving average, and the two outer bands are typically set two standard deviations above and below the moving average.
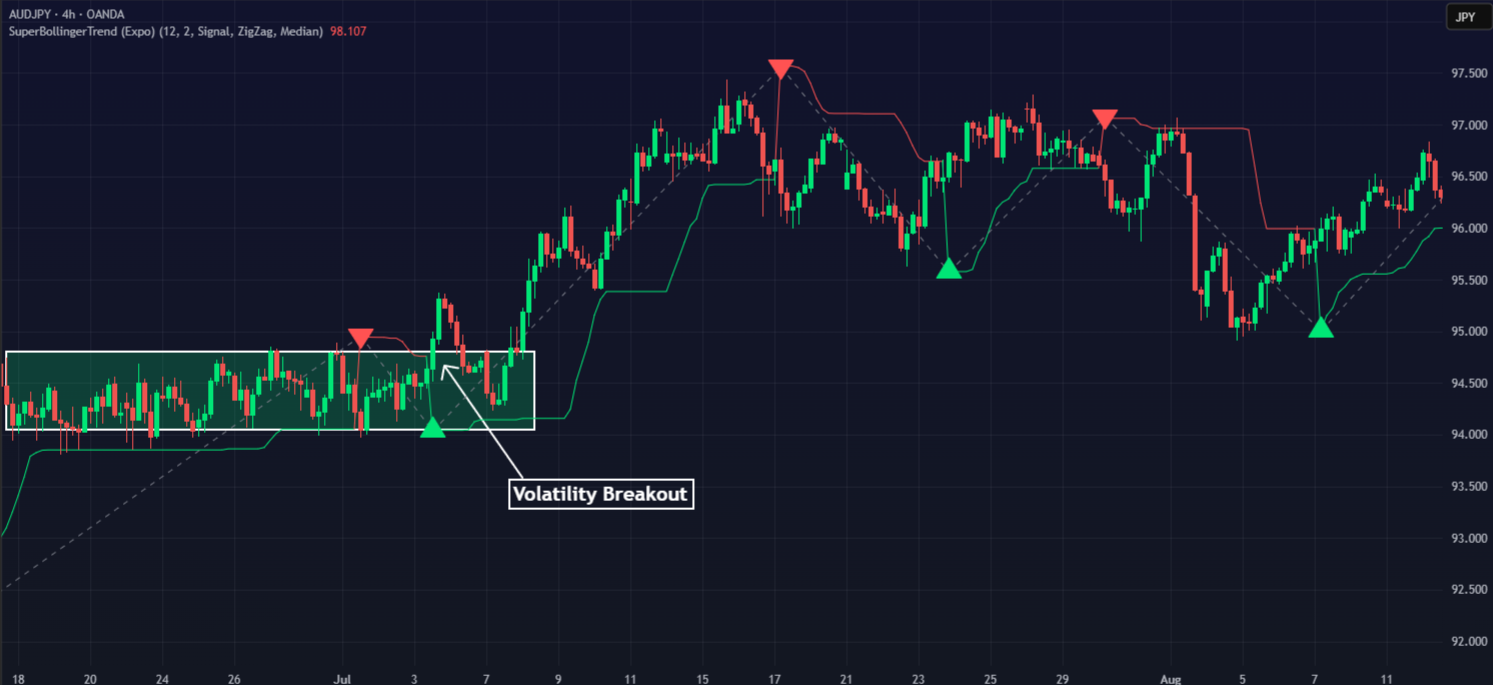
When the bands are wide, it signals high volatility, and when they are tight, it suggests low volatility. A “squeeze,” or tightening of the bands, often indicates a potential breakout is coming.
To get a better trend idea with volatility, I recommend using the SuperBollingerTrend indicator, which recognises that high volatility levels often come with stronger price momentum, which can result in the formation of new trends or the continuation of existing ones.
III. Volatility Index (VIX)
The Volatility Index (VIX) is a measure based on the stock market’s expectation of volatility (implied volatility) based on options pricing of the S&P 500 index. It is often referred to as the “fear index,” as it reflects investor sentiment and uncertainty about future market movements.
When the VIX is low, the market is considered calm, and confidence is high. When the VIX spikes, it shows fear, uncertainty, and wide price swings. For example, during the 2020 market crash, the VIX soared above 80, which was one of the highest levels in history.
For traders such as you and me, the VIX serves as an extent of overall risk. If you’re trading equities and the VIX is elevated, you ought to reduce exposure or tighten your risk management. Trust me when I say this, volatile conditions are always brutal.
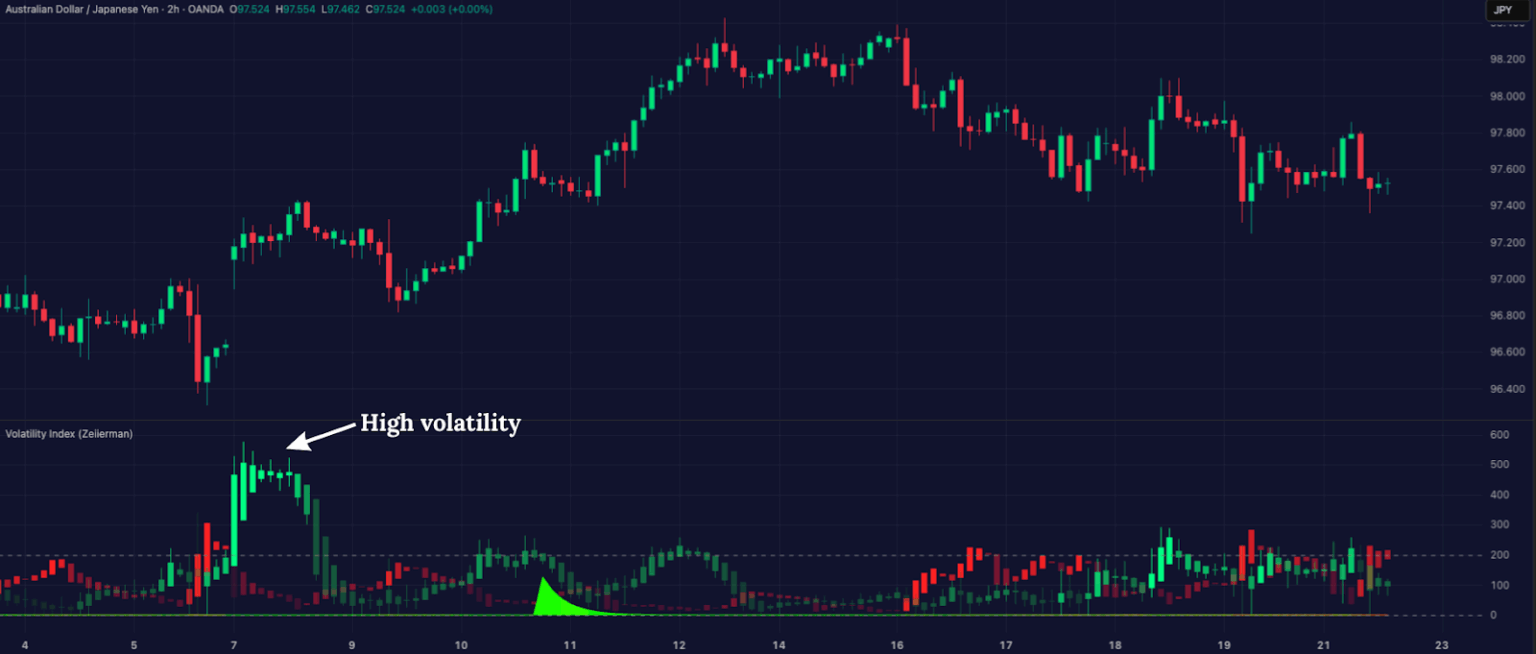
IV. Zeiierman Volatility Index Indicator
The Volatility Index indicator is designed for traders who think slightly differently from other players in the market. In volatile markets, most people panic when prices crash or chase big rallies.
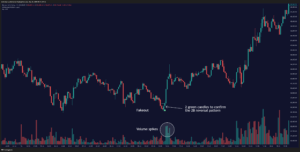
With this indicator, we do the opposite by highlighting extremes in volatility. When markets experience abnormal activity, like a sudden 15% drop in Bitcoin within an hour, the tool flags this as a potential reversal zone.
Read: The Most Accurate Trading Indicators in 2026The simple logic here is that the markets rarely stay at peak fear or high for long. Once the storm settles, the price often goes back toward balance. For traders who like to go against the current, that’s often the best time to enter. Basically, instead of reacting emotionally (panic), you’re making moves when volatility itself signals exhaustion.
3. Pro Trader’s Volatility Trading Strategy
Alright, enough with the theories and trading scripts. Let’s get to using them. With volatility, you can do a thousand different things, and there will still be room for more.
After trying out many combinations and trading fundamentals, I ended up making a tailored volatility trading strategy. And today, you’re getting that strategy straight from my notes.
Note: I’ll be using the four indicators that I discussed above. If you want to know about the chart settings and ideal timeframes for each indicator, I recommend visiting our documentation or the individual indicator pages.
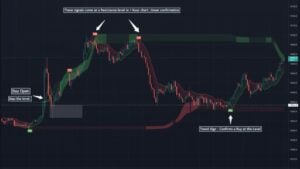
Step 1: Identify Compression Phase
Firstly, look for the SuperBollingerTrend bands tightening, which signals a period of low volatility. Then look to confirm with the Zeiierman Volatility Index below a defined point (indicating volatility compression). This compression often indicates a potential breakout in the market, and that’s important to make the next move.
Step 2: Wait for Volatility Expansion
Keep your attention on the SuperBollingerTrend breakout, which occurs when the price closes outside the band, with the band starting to expand. Now here, the Zeiierman Volatility Index must rise at the same time, showing that volatility is expanding.
At this point, you can expect a directional move.
Step 3: Confirm Direction with ATR Trend
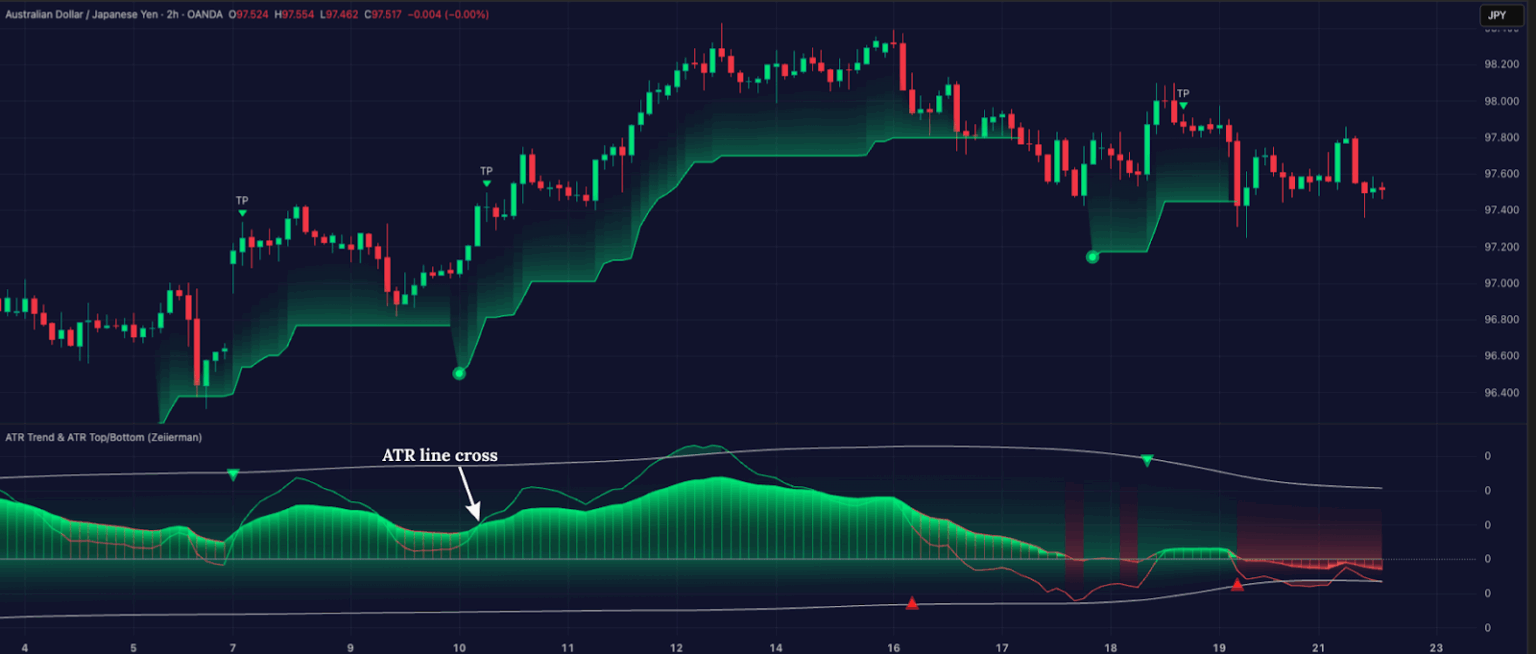
This is where the ATR Trend & ATR Top/Bottom indicator will help you build your bias on the market movement.
- If the ATR Trend line is sloping upward and aligns with the breakout direction, you can look for a trade with the trend.
- If the ATR Trend is flat or diverging, you can skip the trade or wait for a better reason to confirm direction.
Step 4: Entry Rules
You can go for a long position when the price closes above the upper SuperBollingerTrend band, the volatility index is rising, and the ATR Trend confirms an uptrend.
Go Short when the price closes below the lower SuperBollingerTrend band, the volatility index is rising, and the ATR Trend confirms a downtrend. You can get refined entry points with the marking of the ATR Trend & ATR Top/Bottom indicator.
Always make sure that a wider context is making sense in these movements, and you should keep your eye on any other major news or event that can flip the volatility.
Step 5: Stop-Loss Placement and Take Profits
You can place a stop-loss major larger frame high/lows, or you can use the ATR Bottom for long trades or the ATR Top for short trades. This will ensure that the stops are volatility-adjusted and not just random.
- If volatility continues to expand, trail stops using ATR Trend or SuperBollingerTrend midline.
- If the volatility index flattens or declines sharply, tighten stops as the move may be losing steam.
Take some profit early to secure gains and take the final exit when the price closes back inside the SuperBollingerTrend band or when ZVI peaks and starts to drop.
During volatile times, you should monitor your trade more because the uncertainty increases and moves become quicker during these times, and orders may jump because of the movements.
4. How to manage risk in volatile markets?
Trading in volatile conditions can feel exciting, but it can also be dangerous if you don’t manage risk properly. Even strong indicators like SuperBollingerTrend and ATR Trend aren’t a replacement for some good ol’ fashioned risk management.
Let’s talk specifics.
I. Position Sizing
Position sizing is about managing your exposure to risk. The goal is to ensure that no single trade, no matter how good it looks, can blow up your entire account. Here are ways to size your positions :
- Use ATR-based position sizing: Divide your risk-per-trade (like 1–2% of your capital) by the current ATR value. This gives you a position size that adapts to market conditions.
- A smart approach is to scale down position size as volatility rises. A highly volatile asset (like a new crypto) needs a smaller position size than a less volatile one (like EUR/USD).
II. Stop-Loss Placement
In choppy markets, tight stops can get hit easily, while stops set too wide expose you to unnecessary drawdowns. The balance comes from volatility-adjusted stops. I would recommend placing your stop at a multiple of the ATR (e.g., 1.5x ATR below entry for longs). This would make sure your stop isn’t too close to the noise.
Alternatively, you can look at indicator-based stops: Use the ATR Top/Bottom lines or the opposite approach for the SuperBollingerTrend band as natural stop levels. These already work with volatility, so your stops move with the market.
If your stop feels “comfortable”, it’s probably too tight for a volatile market. Stop loss should be wide enough to survive noise, yet precise enough to cut a failed trade.
Pro Advice: Volatility creates the illusion of endless opportunity. Every candle looks like a setup, and that temptation often leads to overtrading, which drains both your capital and mental focus. Stay focused. Make a plan and stick to it.
Read: How to Trade Head & Shoulders Pattern in 2025 – Beginner to Advance5. How does volatility affect different trading styles?
There are dozens of different trading styles. Three of those are highly dependent on the market volatility on a daily basis.
I. Day Traders
Volatility really matters in intraday trading because it brings both opportunities and risks. When prices change quickly, there’s a chance to make money, but it also creates some noise that might lead to sudden losses. For new traders, to do well, they need to stay disciplined and concentrate on how fast they execute trades, how big their positions are, and manage their risks.
II. Swing Traders
Swing traders do best when there’s more than just the usual little movements happening in the day. Volatility gives them those strong swings that they can hold onto for days or even weeks, which makes figuring out risk and reward a lot easier. After a calm period, when volatility picks up, it is usually simpler to spot breakouts and continuations of trends.
But with this volatility comes some risks too, like quick reversals that can throw traders off just before a meaningful move happens. That’s why swing traders typically use wider stop-losses compared to day traders.
More importantly, these stop-losses are often based on a multiple of the Average True Range (ATR). They want to be able to ride out the bigger movements without getting disturbed by all the short-term noise.
III. Investors and Position Traders
Long-term investors look at volatility differently than traders do because for them, it’s not about trying to ride the ups and downs but more about surviving those storms. A sudden price drop can feel pretty scary in the moment, but a seasoned investor might see that as a chance to buy at a discount.
The real danger for investors can be psychological. Volatility can lead even the most disciplined investors to rethink their strategies. A stock that goes down 20% in a week might trigger panic-selling, even if the company’s fundamentals are the same. The key is figuring out how to differentiate short-term volatility from long-term value.
Pro Advice: A useful tactic is to view dips in volatility as chances to buy more. If an investor believes in a company’s or sector’s long-term potential, then those temporary downturns can become a friend rather than a danger.
At the end of the day, volatility cuts both ways. It can be the source of your biggest gains and the biggest losses, but the difference lies in how you handle it. Traders who rely only on gut feeling often get trapped by emotional swings, while those who prepare with indicators, position sizing, and patience can survive volatility or even get better results.
6. What causes market volatility, and how can you read it?
Prices move because traders and investors react to new information, unexpected events, or changes in how markets function. Sometimes those moves are calm, like ripples on a pond, and other times they’re waves that crash fast and hard.
Here are the main factors that usually drive volatility in the market:
I. Geopolitical Events
Markets really don’t like it when there’s uncertainty. Things like elections, trade issues, shifts in policies, or even government shutdowns can all create a pretty unpredictable environment, which often makes things more volatile.
On a larger scale, global events like wars, pandemics, or natural disasters can mess with supply chains, hit global trade hard, and ultimately affect economies everywhere and the forex market – thus creating volatility.
II. Economic Data Releases
When key economic reports are released, like inflation rates (CPI), GDP growth, or employment numbers, they can cause powerful price actions. If these numbers turn out different from what economists and investors were expecting, it often leads to a rapid rethinking of future economic possibilities, and this causes prices to move sharply.
III. Corporate Earnings and News
On a micro level, a single company’s performance can cause its stock to become volatile. A surprisingly strong or weak earnings report, a product recall, a scandal, or a major merger and acquisition announcement can lead to rapid shifts in investor sentiment and cause the stock price to swing wildly.
IV. Market and Psychological Factors
We all know that the players in the market are not always rational. Emotions like fear and greed, along with the trend to follow the crowd, can really shoot up volatility. For example, during times of fear-driven sell-off, the panic can lead investors to dump assets even though the fundamentals haven’t changed. This pushes prices well below their true worth.
Frequently Asked Questions (FAQs)
1. What is volatility in simple terms?
Volatility basically refers to how much the price of an asset bounces around. When a stock or cryptocurrency has significant price changes in a short time, we call it highly volatile. On the other hand, if the price stays more stable without many ups and downs, that’s low volatility.
2. Is high volatility good or bad?
High volatility isn’t exactly good or bad, actually. It really comes down to how you trade and how you handle risk. If you’re a day trader or someone who trades over a short period, high volatility can actually work in your favor, leading to bigger price swings and more chances to make a profit.
For long-term investors, high volatility might be a bit worrying when it causes their portfolios to fluctuate drastically, but it can also provide chances to catch good assets at lower prices.
3. How to measure volatility in crypto/forex?
Volatility in crypto and forex is usually measured using technical indicators. The most popular one is the ATR Trend & ATR Top/Bottom, which shows how much an asset moves in a given timeframe. A rising ATR means the market is becoming more volatile, while a falling ATR suggests calmer conditions.
Another battle-tested tool is SuperBollingerTrend, which expands when volatility increases and contracts when it decreases. In crypto, traders also look at percentage moves. For example, if Bitcoin swings 10% in a day, that’s considered very high volatility compared to traditional markets.
Zeiierman
With over 16 years in the market, Zeiierman has extensive experience as a full-time trader and risk advisory consultant for hedge funds. He has developed many profitable trading strategies, drawing on his background in risk management and strategy execution.
More from Zeiierman