Over the past few years, the trading landscape has shifted rapidly, largely due to the increasing importance of Artificial Intelligence (AI) in data analysis. AI trading analysis is no longer just a futuristic concept; it is here, it’s working, and smart traders are already using it to gain an edge.
After using various AI tools for the past few years, I ultimately developed my own algorithms to suit my trading style. In this guide, I will break down what AI trading analysis really is, why traditional tools alone fall short, how AI changes your workflow, and where this all leads.
How does AI chart analysis work?
Let me preface the rest of the article by saying that any AI tool that analyzes your chart is just that, a tool to give you and help you understand the market context with advanced pattern recognition techniques. It’s not the decision maker of your trading book.
Under the hood, these models are trained on large datasets of historical price movements, which enable them to process raw candles into features that highlight structure, momentum, volatility, and liquidity. Take our AI Chart Analyzer, for example. Instead of reacting to a few predetermined conditions, it actually brings together multiple layers of market behavior simultaneously to provide a reliable result.
1. Price Action and Volume
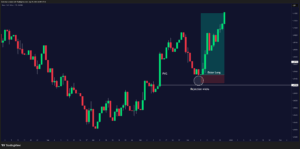
Price action is the backbone of every chart. We examine swing highs and lows, candle formations, momentum shifts, and a few indicators to determine whether the market is trending or ranging. The AI analyzers work with the same logic, but they do it faster and more efficiently than traders.
Let me explain, the AI analysis tools don’t just mark a swing high; they evaluate how steep the leg before the high was, how many times the level was tested, and whether volatility was expanding or contracting.
They don’t just identify a breakout; if fed with the right market data, they can indicate whether similar breakouts in this market and timeframe typically continue or fail within the next few sessions. These tools could very well be the difference between you recognizing a failed breakout quickly v/s sinking into a trap.
Volume tells the story behind price movement, but traditional volume analysis can be pretty basic. When you look at a chart, a green candle might scream “momentum” to you. However, the AI analyzer with accurate volume data can determine whether the momentum is reliable or not.
Here’s how it breaks it down: Expanding volume often indicates conviction in moments. A breakout backed by rising volume indicates that more traders are entering the market, confirming the strength. AI analyzers paired with our indicators on TradingView (both free and premium) can analyze relative volume, order book imbalances, and hidden liquidity pools that most traders overlook.
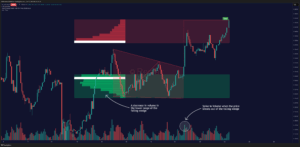
Volume clusters act as the strongholds in the market. Just as battles leave scars on a battlefield, price zones with high traded volume act as magnets for prices to return. An AI analyzer can precisely map these price zones and indicate where the price might stall or reverse.
2. Smart Money Concepts
Smart Money Concepts (SMC) is where AI steps into the domain that many retail traders struggle with: tracking the actions of the big players. SMC revolves around understanding liquidity, including where stops are placed, where large orders are located, and where the market is most likely to move before making its real move.
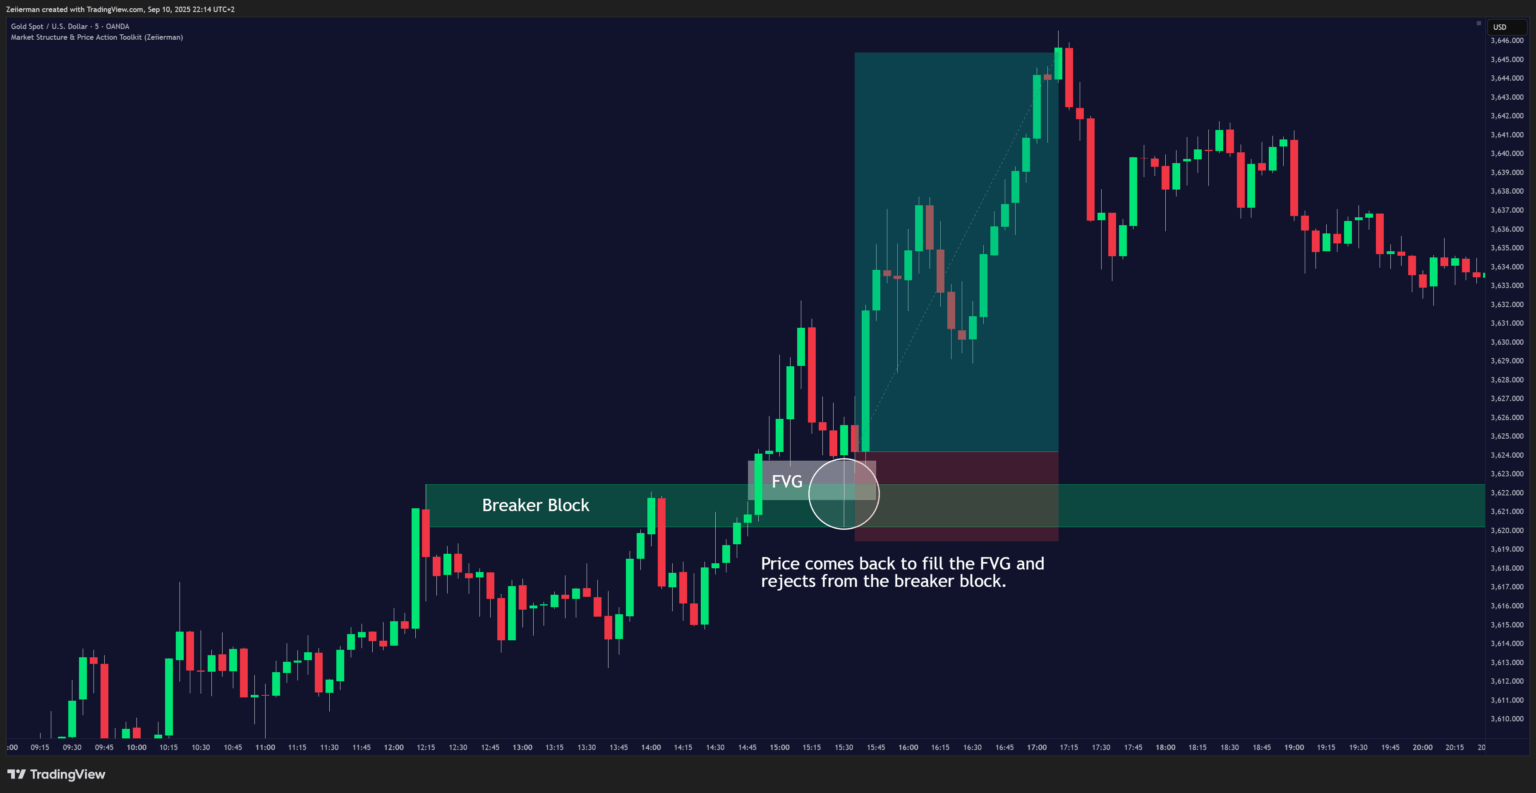
- Liquidity pools: Retail traders often leave predictable stop-loss clusters above swing highs or below swing lows. This causes liquidity sweeps that retail traders hate, cause their stops get hunted left and right. You can avoid this by pairing the Liquidity Levels/Zones indicator on your chart with the AI analyzer.
- Order blocks: Buying or selling orders from big players don’t always get filled in one shot. They leave behind footprints in the form of ranges of consolidation where large buy or sell orders get stacked up. AI can identify these blocks faster and more consistently than a human can, and it can also determine the strength of the blocks, which helps in making healthy trading decisions.
Markets are often described as zero-sum, meaning that for one trader to win, another must lose. Retail traders, without realising it, often provide the liquidity that big players exploit. AI analysis results can level the playing field by showing you where you’re likely to be the bait.
Traders have continued to focus on price action, volume, derivatives metrics, and sentiment for decades. The edge comes when the AI analyzer combines these factors at scale and provides insights we might otherwise miss.
Read: How to Maximize Profits with Zeiierman’s AI Chart AnalyzerWhy are traditional tools alone not enough anymore?
Don’t get me wrong – I never shy away from some good ol’ elbow grease. For years, we have relied on classic indicators such as RSI, MACD, Fibonacci retracements, and moving averages. These tools are fantastic and revolutionary in their time, and they remain a great foundation for any trader.
The problem is the regime change; I mean, markets aren’t sitting still. They have evolved to a much more advanced state than they were. In today’s lightning-fast, high-frequency world, relying solely on traditional analysis tools can feel akin to trying to take a bicycle to an F1 race.
Furthermore, these traditional tools are subjective. One trader might see a head and shoulders pattern, while another might see nothing. This subjectivity can lead to mistakes caused by emotion or confirmation bias.
Traditional tools, when used in isolation, sometimes lack a mechanism to filter out personal feelings. They also require you to spend hours in front of a screen, manually scanning charts for signals with dry eyes, which just isn’t efficient in a 24/7 global market. In short, they simply lack the speed and raw processing power necessary to keep pace with modern market dynamics.
Advantages of AI-driven analysis for traders
So, what is the real payoff for bringing an AI-driven analysis into your trading strategy?
1. Objectivity: No more emotional bias.
As we discussed earlier, every trader is familiar with the pain of emotional bias. If you trade long enough, you’ll have at one point,
- Held onto a losing position because you wanted the market to bounce.
- Ignored a warning sign because your bias leaned bullish.
- Chased a breakout just because Twitter was hyped about it.
I absolutely love the thought that AI doesn’t care that I have been waiting all week for BTC to break resistance. It simply scans the data and provides outputs based on what it sees. That objectivity forces you to face the market as it is, not as you wish it to be.
2. Speed without sacrificing depth.
In fast-moving markets like cryptocurrency or forex, I can attest from experience that hesitation is costly. Traditional technical analysis requires you:
- Drawing support and resistance levels manually
- Checking volume patterns
- Switching across multiple timeframes
- Constantly cross-checking with indicators and a hundred other things
A good AI analysis tool compresses all of that into a few seconds. Upload a chart, and it immediately gives you:
- A full overview of the trend direction
- Quantified parameters of trend strength, momentum, and volatility.
- Key support and resistance zones with stay out zone tips.
- Smart Money Concepts context (order blocks, liquidity levels, fair value gaps)
- Probabilities for continuation or a reversal
3. Multi-Timeframe Clarity
One of the most challenging aspects for most beginner traders in technical analysis is accurately checking confluences across multiple timeframes. Although the 15-minute chart appears bullish, the daily chart reveals strong resistance. This struggle to decide is quite common among traders.
An AI-driven analysis can get you above those struggles in no time. It can evaluate each uploaded timeframe, assign a weight, and you can easily combine the findings into a single structured idea. For example, you might get a readout like:
- Short-term (15m or 1h): Bullish momentum, supported by rising volume
- Mid-term (4h): Neutral, consolidating near resistance
- Long-term (Daily): Bearish bias, strong supply zone overhead
With that breakdown of separate time frames, you can instantly see the full picture. You’re no longer guessing whether your intraday setup gets in the way of the bigger trend, because the AI gives you a clear picture to make decisions.
Common Misconceptions (AI isn’t a crystal ball)
1. AI Predicts with 100% Accuracy
One of the biggest myths is that AI can “see into the future.” In reality, no system, human, algorithm, or AI, can predict markets with certainty. Markets are influenced by numerous factors, including unexpected news, geopolitical shocks, and sudden shifts in liquidity.
AI doesn’t really predict, but it analyzes. Like Zeiierman’s AI Analyzer, it evaluates price structure, momentum, volume flows, trend, and order imbalances to provide high-probability setups.
2. AI is Only for Tech Wizards or Big Institutions
Modern AI trading analysis tools are designed for everyday traders, not just coders or individuals with strong quantitative skills. Our chart analyzer, for example, is a user-friendly platform with a drag-and-drop interface.
3. More Data = Better Predictions
Stuffing AI with a lot of data can lead to noise overload, where the real important information gets drowned out between the extra data. Some traders fill their charts with numerous labels and indicators, expecting to gain accurate insights. It doesn’t work that way. You will want to stick to only those indicators and labels that are relevant to your trading setup.
4. AI Only Works in Trending Markets
Another myth is that AI fails when the price consolidates or gets stuck in a range. However, unlike static indicators that provide the same signal regardless of other factors, AI analysis adapts dynamically to real-time data in order to provide the much-needed context.
If the market is ranging, the Analyzer highlights key S/R boundaries and notes where liquidity pools may be targeted. In trending conditions, it highlights continuation and breakout setups. In choppy environments, it can identify imbalance zones and warn against false signals.
Future of AI in trading
If you think what’s happening now is impressive, just wait. The future of AI in trading isn’t about replacing traders, but about a powerful partnership between traders and AI that will fundamentally change how we interact with the market.
Read: Build an AI-Enhanced Trading Strategy (Step by Step)We can expect the powerful trading technology that was previously locked away in the high-rise offices of Wall Street to become more accessible to traders, and Zeiierman’s AI Analyzer is leading this democratization with its user-friendly AI tool. This will enable a whole new generation of retail traders to make more informed decisions, manage risk more effectively, and compete with the big players on more level ground. It’s a significant shift that empowers individual traders like never before.
Ultimately, this is the future of AI for technical analysis, where humans and AI will work together. AI will handle the heavy lifting, such as technical analysis and pattern recognition, while you, as a trader, can focus on strategy, discipline, and managing your capital.
It’s the best of both worlds, giving you an edge in a market where every little advantage can count.
SM_Trader
SM_Trader is a highly experienced coder and strategy developer who brings the most complex algorithms to life. As a member of MENSA, the prestigious organization for individuals with intelligence scores in the top 2% of the world, he combines exceptional analytical skills with a keen eye for numbers and statistics, empowering businesses to grow at the right pace and in the right direction.
More from SM_Trader