More often than not, I see new traders fall into a cliche trap. They try to move heaven and earth to find “the perfect setup.” However, that’s the wrong approach, your setups will rarely be textbook-perfect.
Instead, a smart money trader with market experience will read every chart and thoroughly validate every “setup opportunity” before putting their money where their mouth is.
Unfortunately, too many traders skip this step. They spot a clean pattern, get excited, and jump in without asking the most important question: “Does the market truly and holistically support this trade?”
For years, I’ve relied on checklists to decide whether a trade is worth taking or not. It includes the most fundamental rules about trend bias, market structure, liquidity sweeps, and volume behavior that @SM_Trader and I have acquired over the years. That’s how we built Zeiierman’s AI Chart Analyzer: it acts as a second set of eyes to quickly and objectively validate setups through a structured approach and data-backed logic.
So, what can it actually do? Let me give you a quick brief before we dive into using the tool. Or, you can skip ahead to the guide through here.
1. What does Zeiierman’s AI Chart Analyzer do?
The AI Chart Analyzer is our very own AI-powered market analysis tool, designed to provide actionable insights on any uploaded chart. Unlike generic screeners or random “AI trade signal” tools, it analyzes your chart as an expert would by assessing trend strength, momentum, volatility, support/resistance, and possible trade setups.
That’s how we deliver clear, structured reports that help you make smarter trading decisions. Whether you’re a beginner learning market structure or a pro double-checking your bias, the AI Chart Analyser adapts to your level. It provides clear explanations for newcomers and concise second opinions for experienced traders, all without requiring the need to sift through numerous indicators.
The best part? You get five FREE spins each month.
Read: 11 Essential Chart Patterns Every Trader Should Master in 20252. Step-by-Step Guide to Using the AI Chart Analyzer
Now, let’s get to how you could access and use the AI Chart Analyzer.
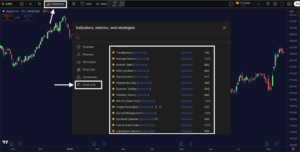
Step 1: Access the tool from your dashboard.
Log in to your Zeiierman Trading Dashboard and look for AI Analyser in the left-hand navigation menu. If you don’t have an account with us, you can create a free one to access the analysis tool.
Click to open and you’ll easily find your available credits and renewal (refill) date at the top.
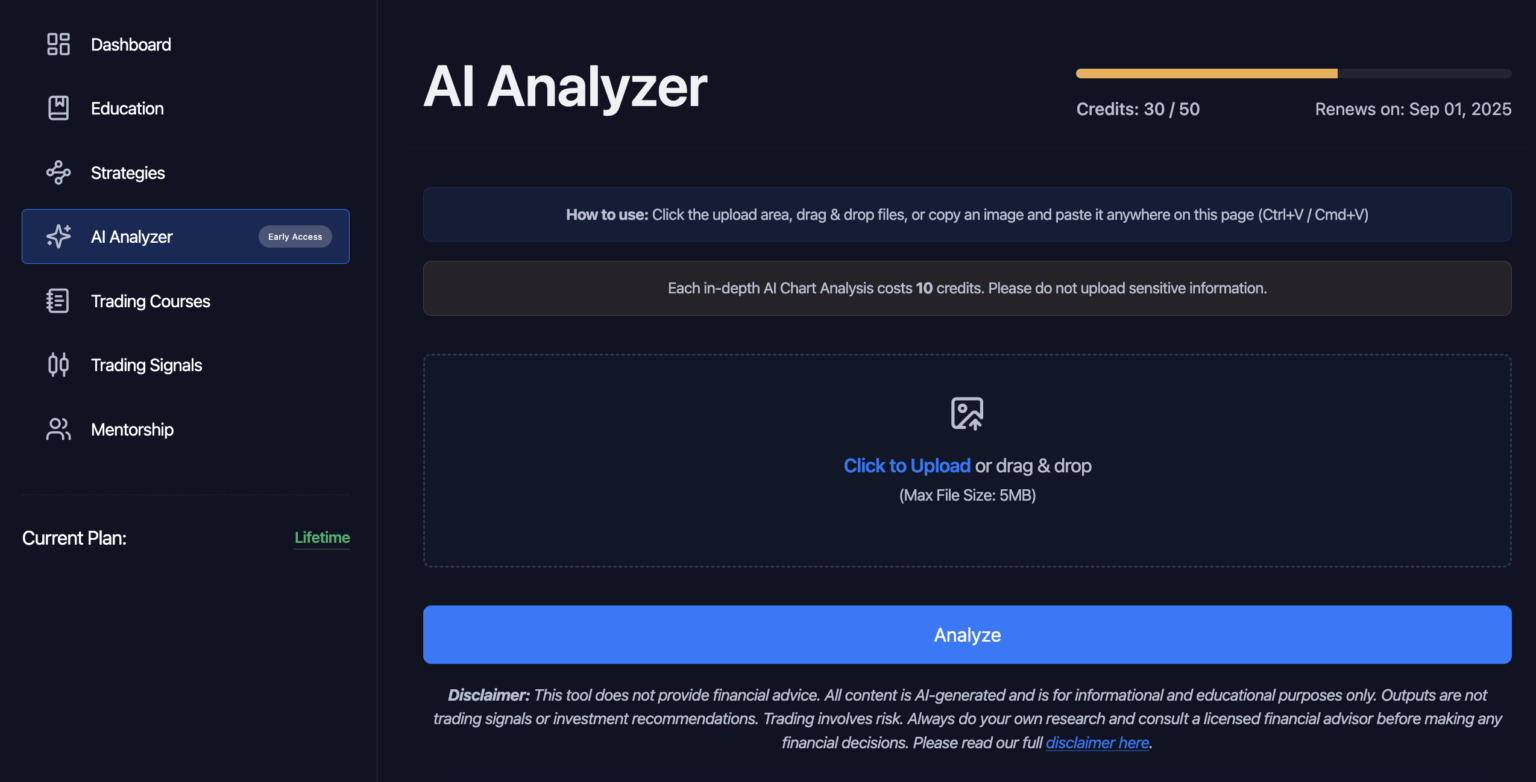
📌 Note: Each analysis consumes 10 credits. The credits reset automatically on your renewal date.
Step 2: Upload your chart & start analysis.
To get started, select ‘Click to Upload’ or simply drag and drop your chart image (max file size: 5MB).
Once your chart is loaded, click “Analyze” to begin processing. The tool will automatically detect the following details to make sure your analysis matches your exact setup:
- Ticker: The trading symbol or instrument analyzed.
- Timeframe: The timeframe of the uploaded chart (e.g., 5m, 4h, Daily).
- Platform: The charting platform recognized (e.g., TradingView, MT4).
📌 Note: Only upload chart images you’re comfortable sharing. The results that you’ll see from the next step are for educational purposes only and do not constitute financial advice.
Step 3: Read Market Assessment scores.
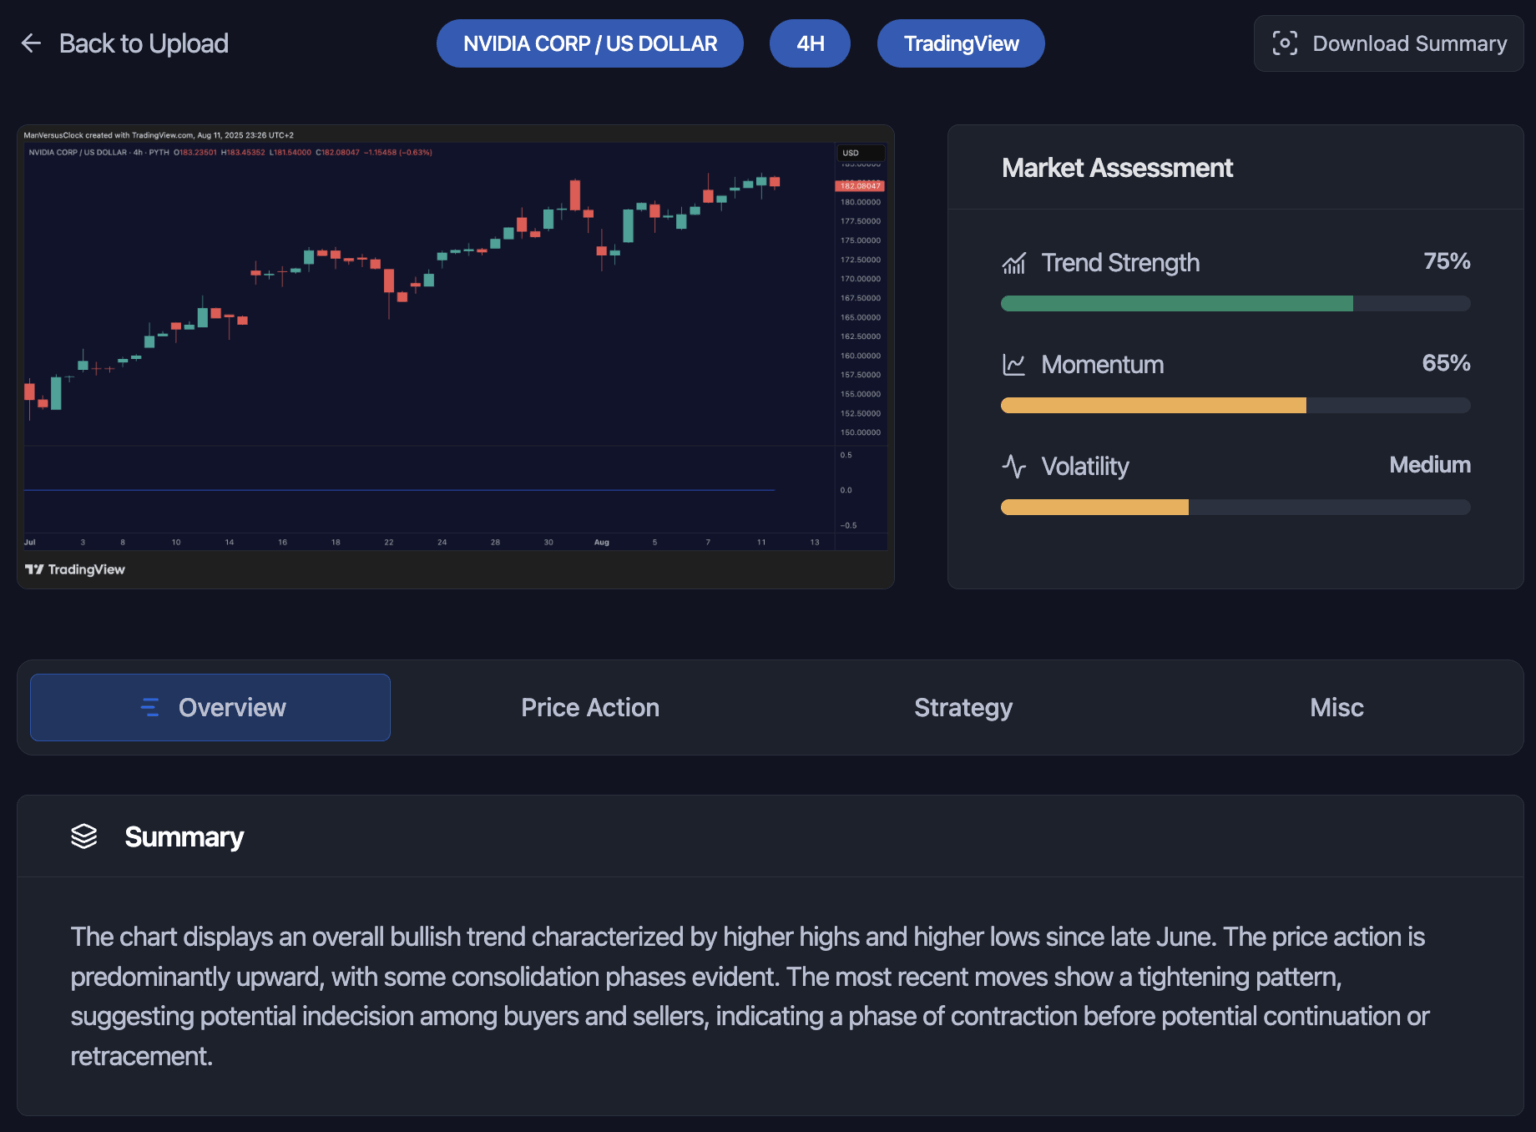
Once your chart has been processed, the AI Analyzer kicks things off with a Market Assessment. This feature displays three quick but powerful metrics that set the tone for the rest of your analysis:
- Trend Strength (1–100): It calculates the clarity and dominance of the market’s momentum. A higher score means that the market is respecting its bias with consistency. Conversely, a lower score signals choppy trading, indecision, or a sideways grind.
- Momentum (1–100): Measures the force behind recent price moves. High momentum often follows breakouts or strong pushes, while low momentum can indicate fading conviction or consolidation phases.
- Volatility (1–100): It tells you how stable or erratic the price action is. Higher scores equal wider swings and faster moves. Similarly, lower scores correspond to steadier, slower-paced markets.
📌 Note: Think of this section as your market “vitals.” If trend and momentum are aligned and volatility is moderate, you’re looking at conditions that often reward well-planned setups. If the scores are misaligned (e.g., strong trend but low momentum), it’s a sign to dig deeper before pulling the trigger.
Step 4: Interpret the Overview, Price Action, Strategy, Risk, Miscellaneous sections.
Now that you’ve sized up the market, it’s time to talk about the core analysis. Our AI algorithm breaks this into multiple tabs, each focusing on a specific part of the technical picture.
4.1 Overview
- Summary: Condensed market structure and trend notes: Are we in a clear uptrend, downtrend, or range? Are higher highs holding? Are we in breakout territory?
- Key Strengths: Technical positives like strong support zones, clean trend alignment, or confirmed breakouts.
- Key Risks: The “watch your back” section that shows nearby resistance, fading momentum, false breakout potential, or other structural weaknesses.
4.2 Price Action
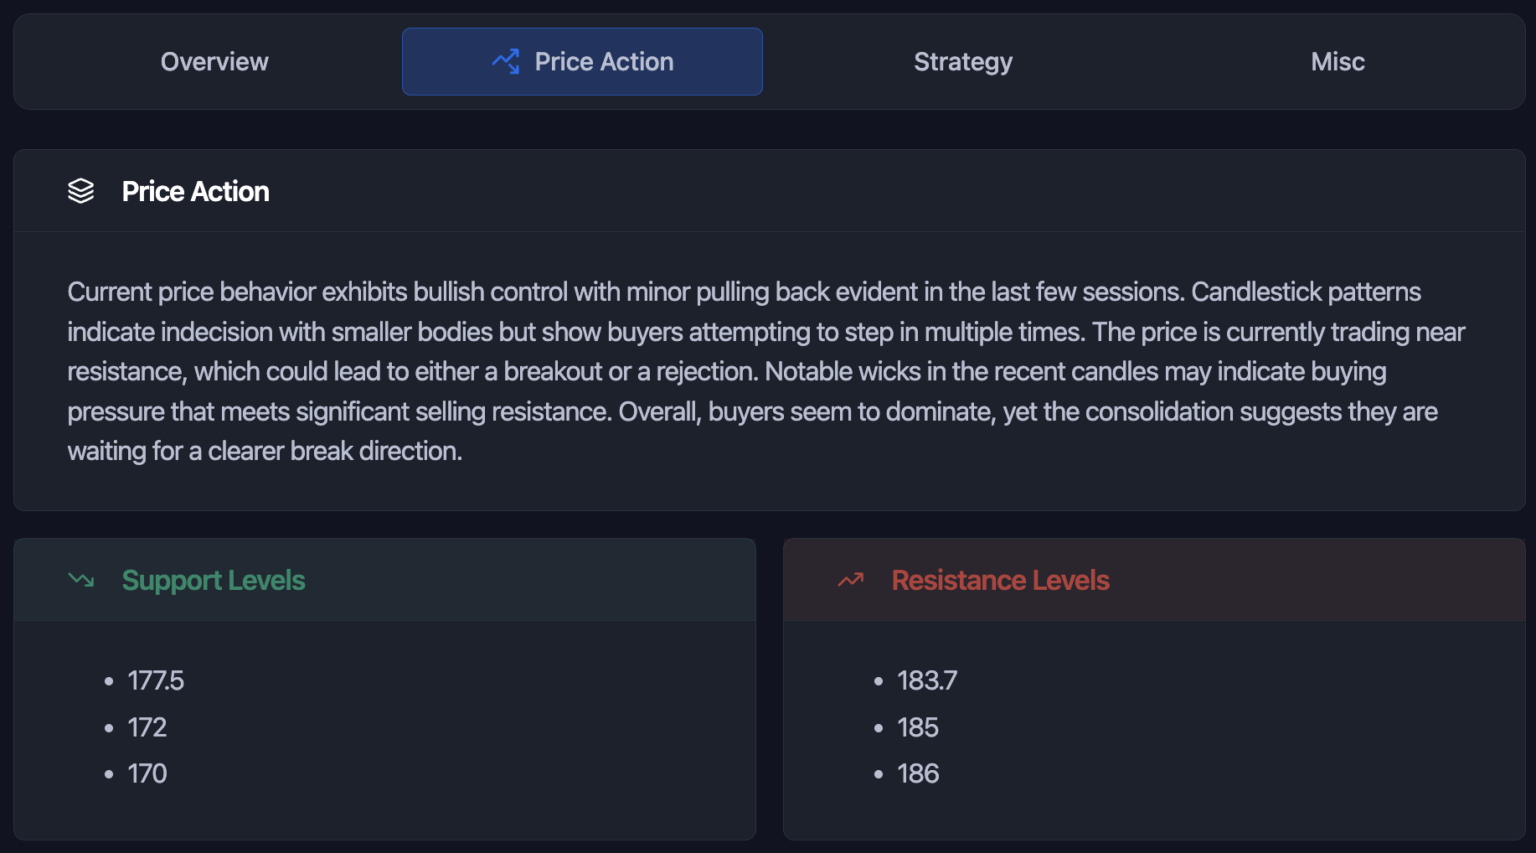
- Summary: Provides a price action summary with surges, pullbacks, consolidations, and shifts in control.
- Support Levels: Demand-heavy price zones where buyers have historically stepped in.
- Resistance Levels: Supply-heavy areas likely to cause pauses, rejections, or reversals.
📌 Pro Tip: These levels aren’t just academic. They can be used to refine entry/exit planning and to position stops just beyond obvious zones.
4.3 Strategy
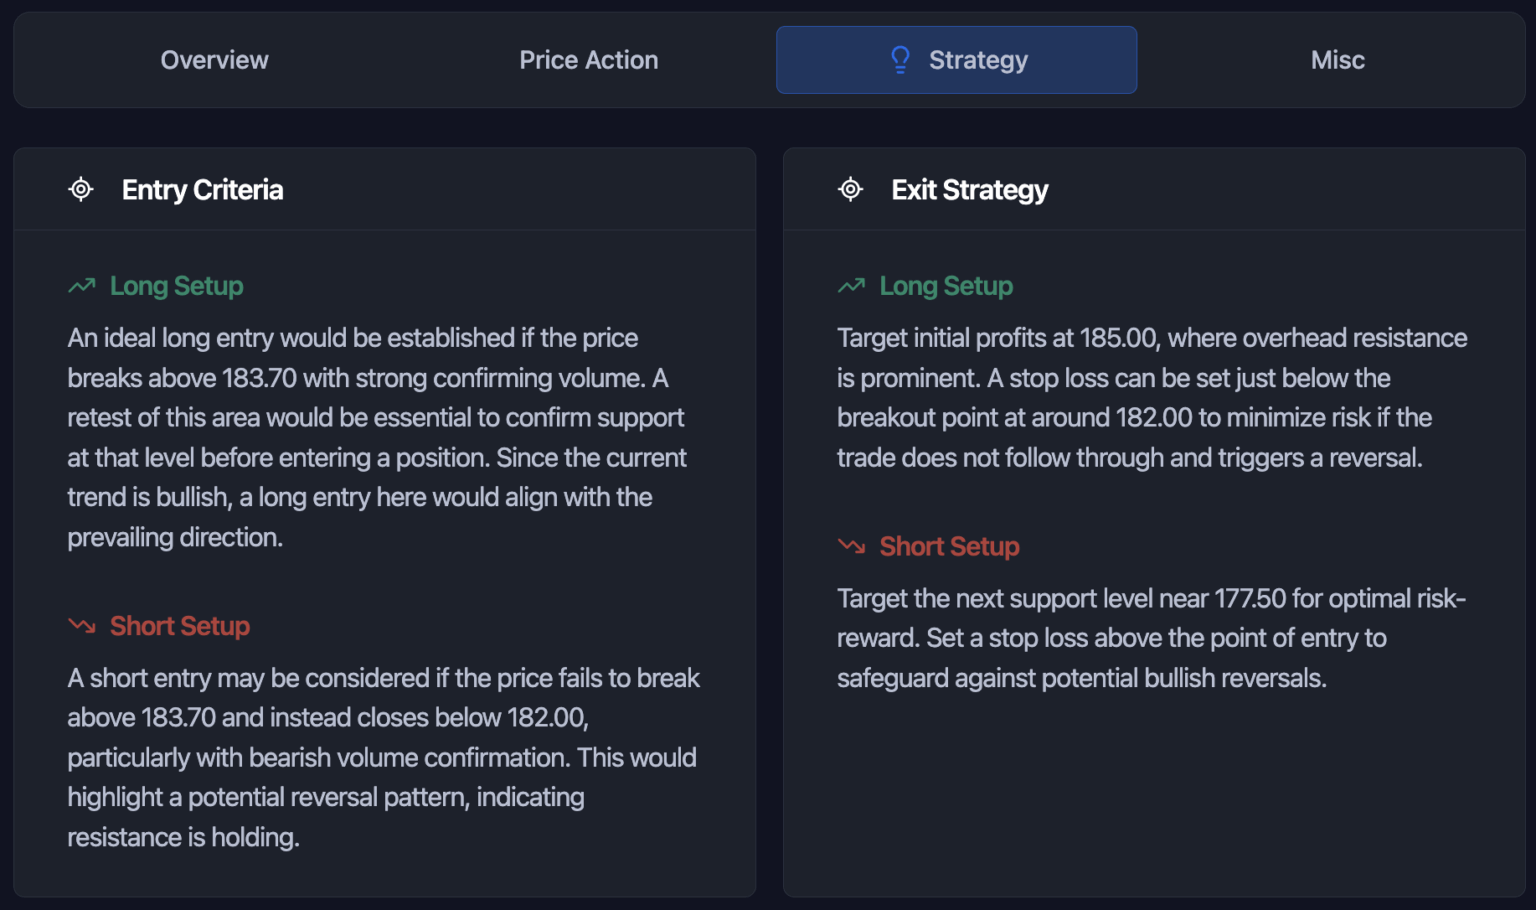
- Long Entry Conditions: Triggers like breakout confirmations, liquidity sweeps into support, or bullish candle structures.
- Short Entry Conditions: Breakdown confirmations, structural weakness, or supply rejections.
- Exit Strategy: Profit-taking points and protective stop-loss zones for both long and short trades.
4.4 Risk Assessment
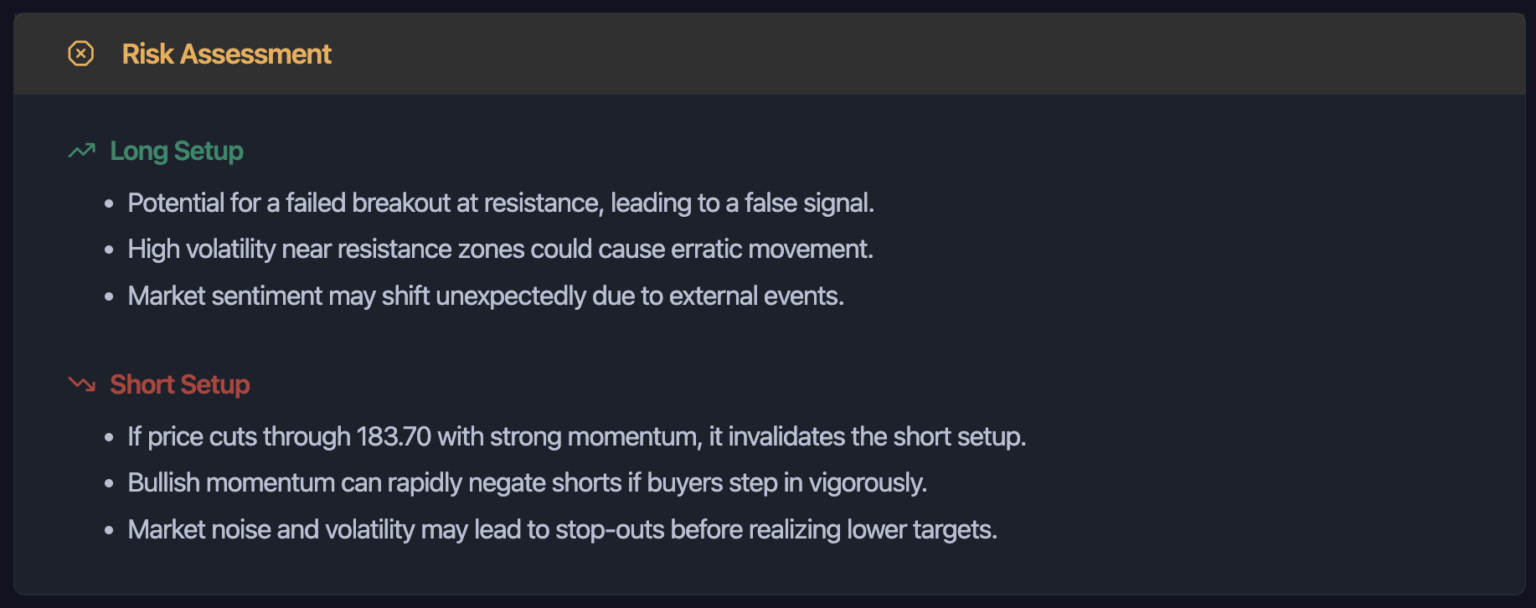
Because @SM_Trader believes no plan is complete without knowing what could kill it:
For long risks, we talk about early reversals, failed breakouts, and liquidity grabs against your position.
For short risks, look for bullish continuations, aggressive buy-side liquidity events, or reclaim of broken support.
Step 5: Save, share, and integrate into your workflow.
When the analysis is complete, you’ll see a visual snapshot of your uploaded chart alongside the AI’s findings. From here you can:
- Download the report for future reference (helpful for post-trade reviews).
- Copy the temporary share link (active for a limited time) to send the analysis to a trading partner or mentor.
- Log the output in your trading journal so you can track how often the AI’s read aligned with your own and the eventual outcome.
My advice? Don’t just store the analysis, act on it. Pair the Market Assessment with the Overview and Strategy tabs to create a quick checklist for validation before entering any position.
3. Example Scenarios with AI Chart Analyzer
Gold Spot / US Dollar
So, we are going to be using two examples and the first one is Gold Spot. This is the chart that I uploaded into the AI Chart Analyzer:
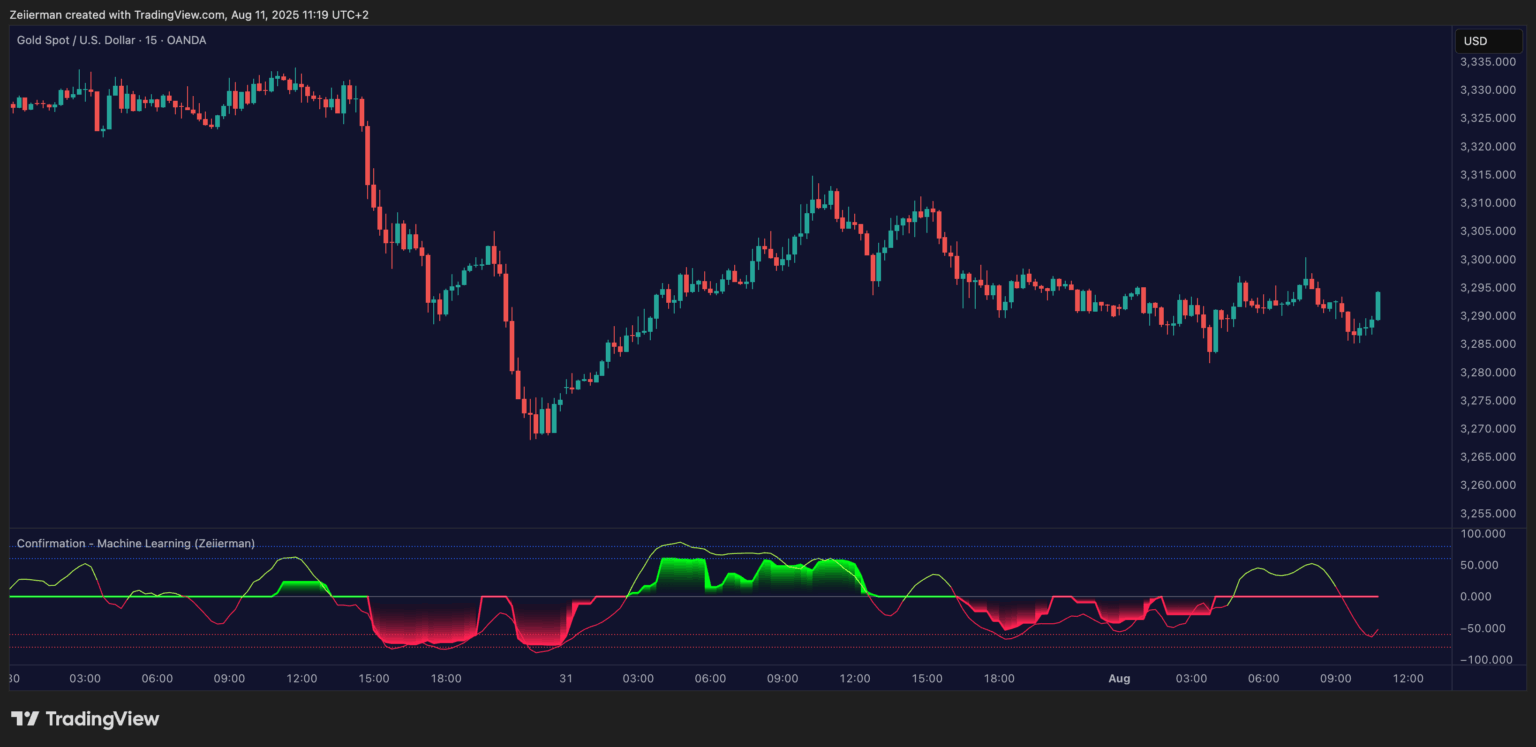
Let’s take a look at what the Chart Analyzer sent back and I’ll give you my final chart in the end.
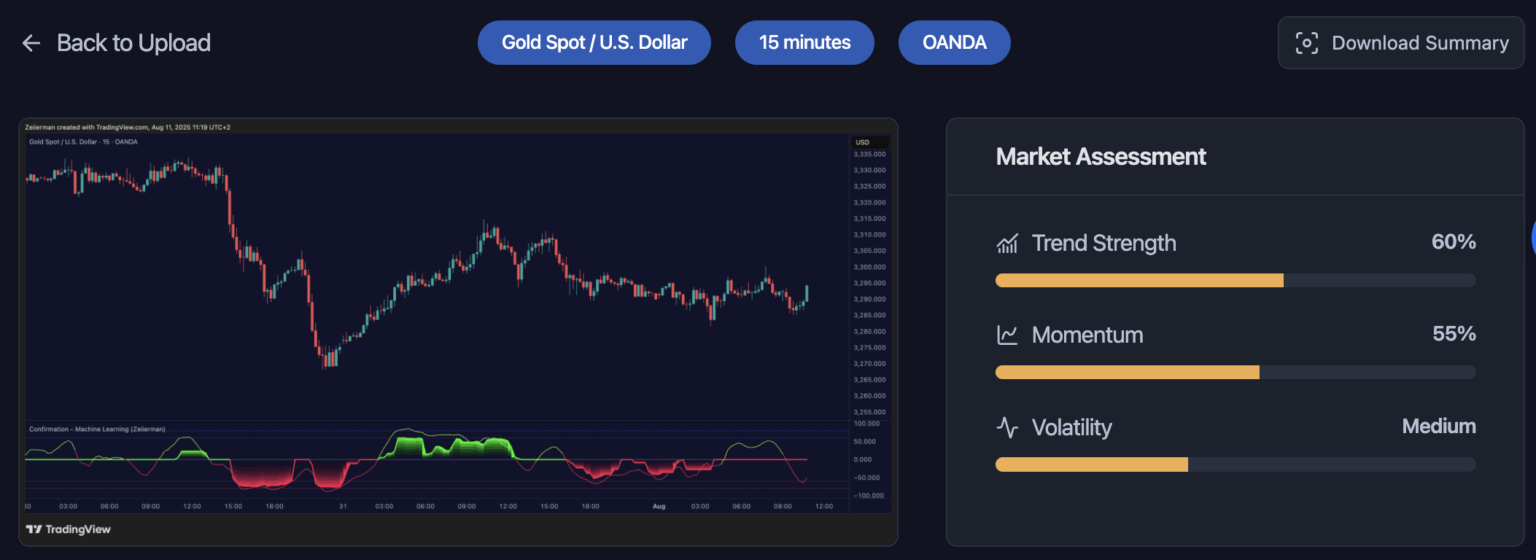
The assessment tells me that the market is leaning toward a directional bias, but it’s not in an explosive trending phase. There’s some push in one direction, but the moderate readings suggest we’re in a stage where price could either continue the trend or shift into consolidation if momentum fades.
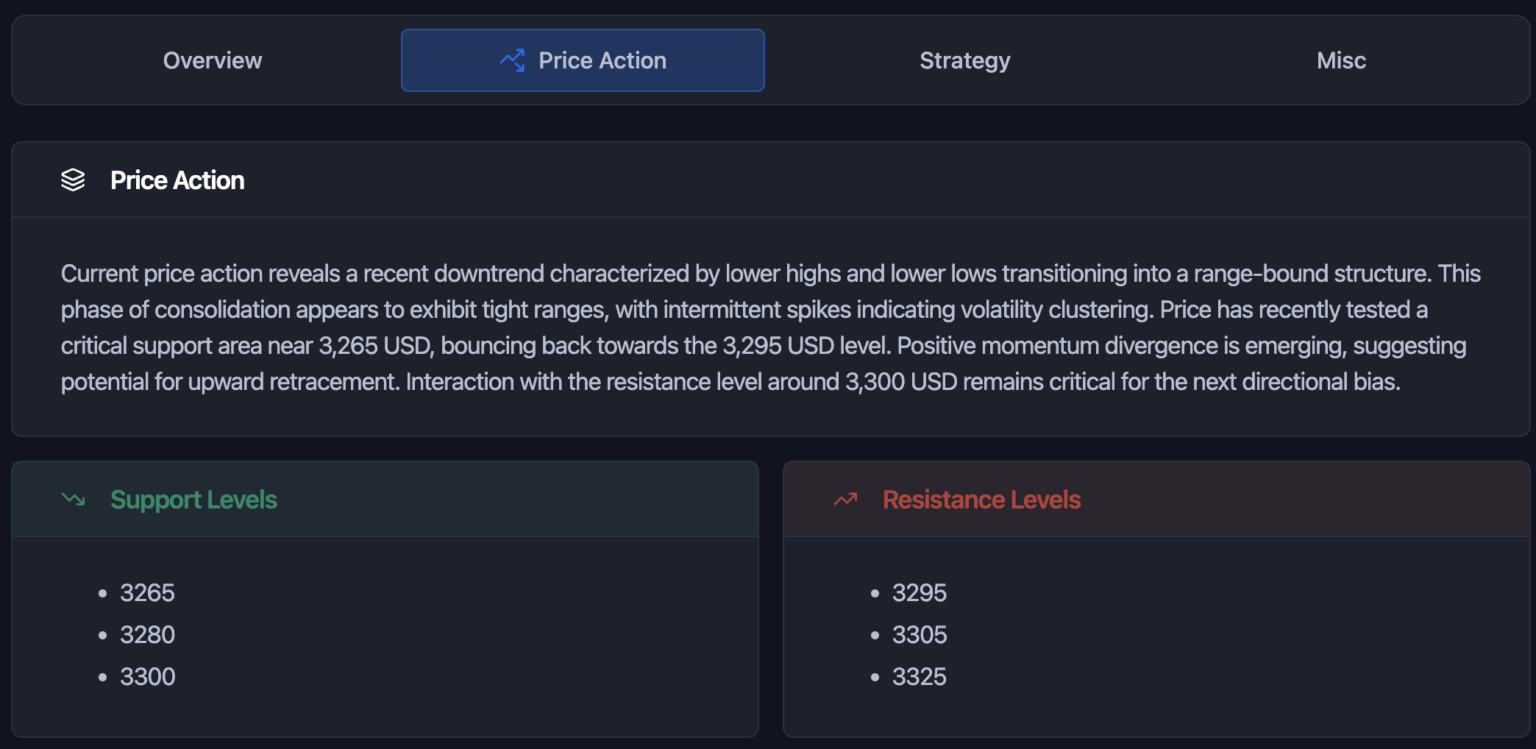
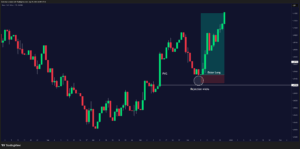
Moving into Price Action, it seems the Gold has recently been in a downtrend, producing lower highs and lower lows, but is now transitioning into a range-bound structure. Price has tested a critical support zone near 3,265 USD and bounced toward 3,295 USD.
Support is clustered between 3,265, 3,280, and 3,300 USD, while resistance sits at 3,295, 3,305, and 3,325 USD. These levels are key for planning entries and exits.
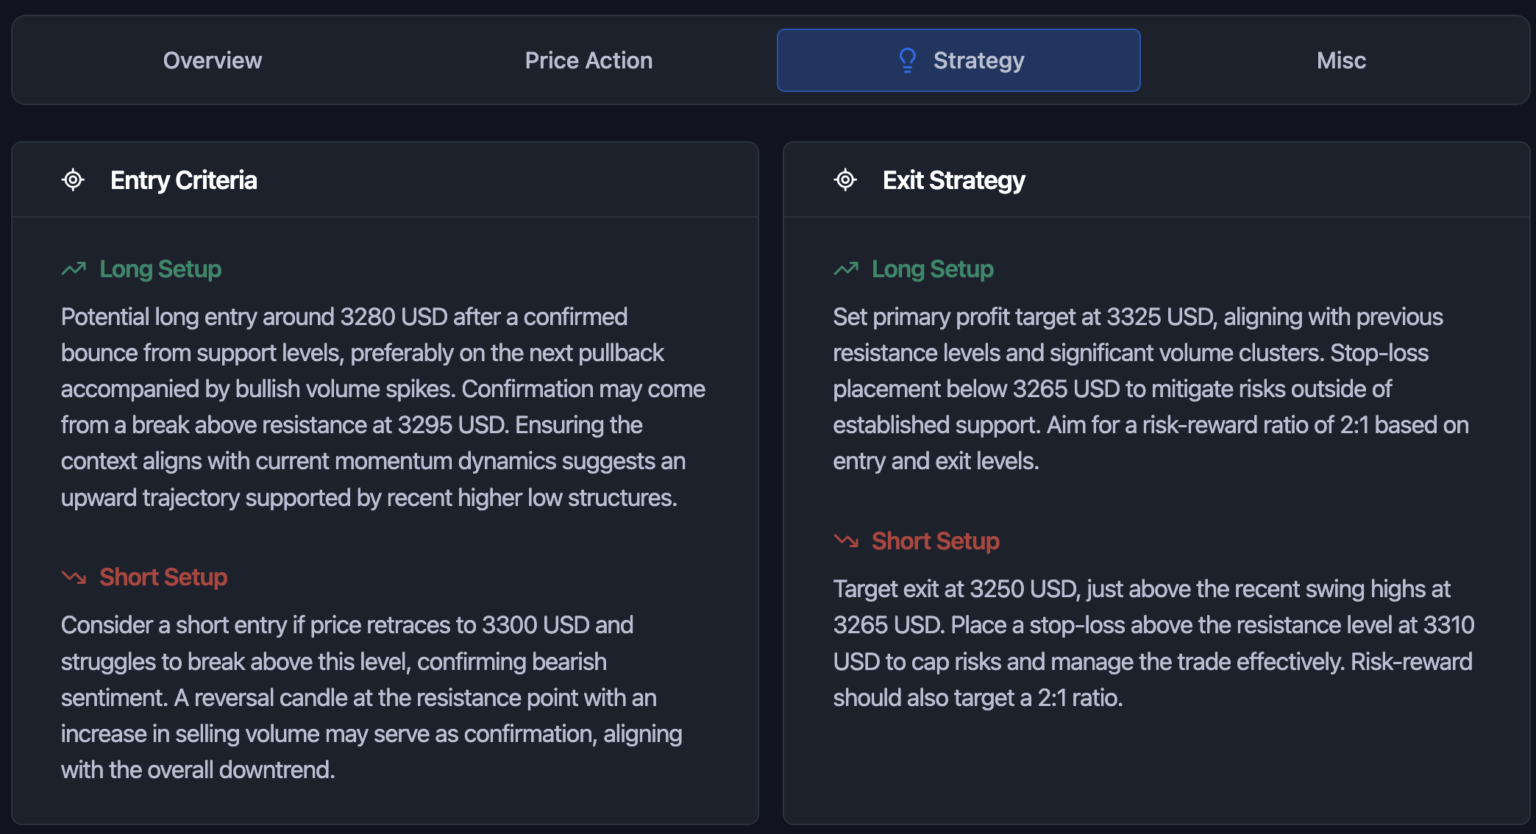
Speaking of entry and exit strategy,
- Long Setup: A potential buy could be considered near 3,280 USD after a confirmed bounce from support, ideally during a pullback with bullish volume spikes. Confirmation might come from a break above the 3,295 USD resistance.
- Short Setup: A sell bias could develop if price retests 3,300 USD but fails to break higher, especially if accompanied by bearish volume. A reversal candle at resistance would be a strong confirmation.
Exit strategies are equally defined:
- For longs, the primary profit target sits at 3,325 USD with a stop-loss below 3,265 USD, aiming for a 2:1 risk-reward.
- For shorts, the target is 3,250 USD with stops above 3,310 USD, also aiming for a 2:1 ratio.
On the basis of the chart and AI’s analysis, this was my takeaway:
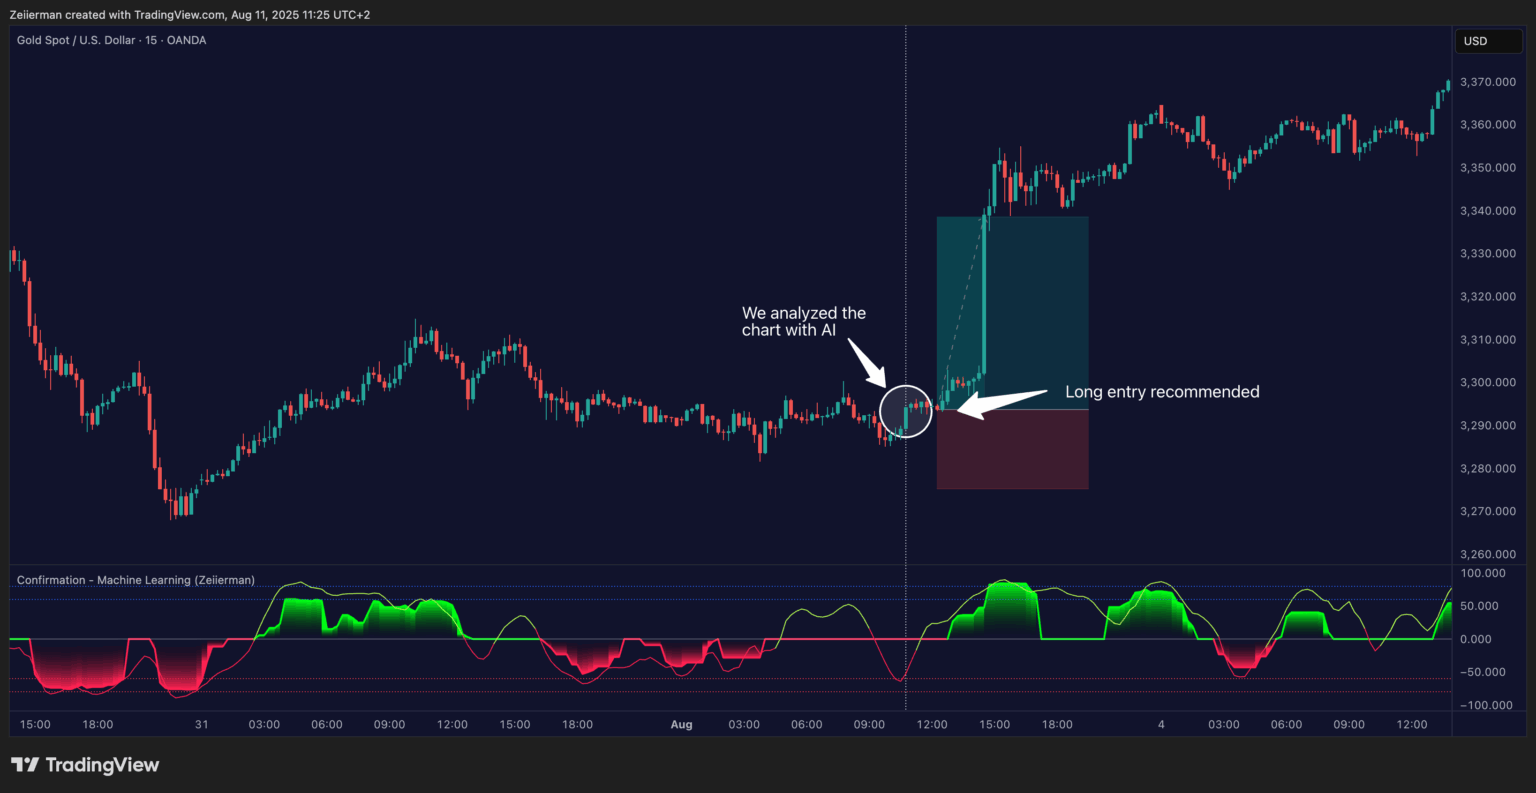
After reviewing the AI Chart Analyzer’s breakdown, the long setup around 3,280 USD lined up perfectly with our own confirmation tools (momentum divergence, supportive structure, and volume behavior).
Price respected the identified support zone, broke above 3,295 USD resistance, and followed through cleanly to the 3,325 USD target and beyond.
Bitcoin / US Dollar
And the next one is Bitcoin:
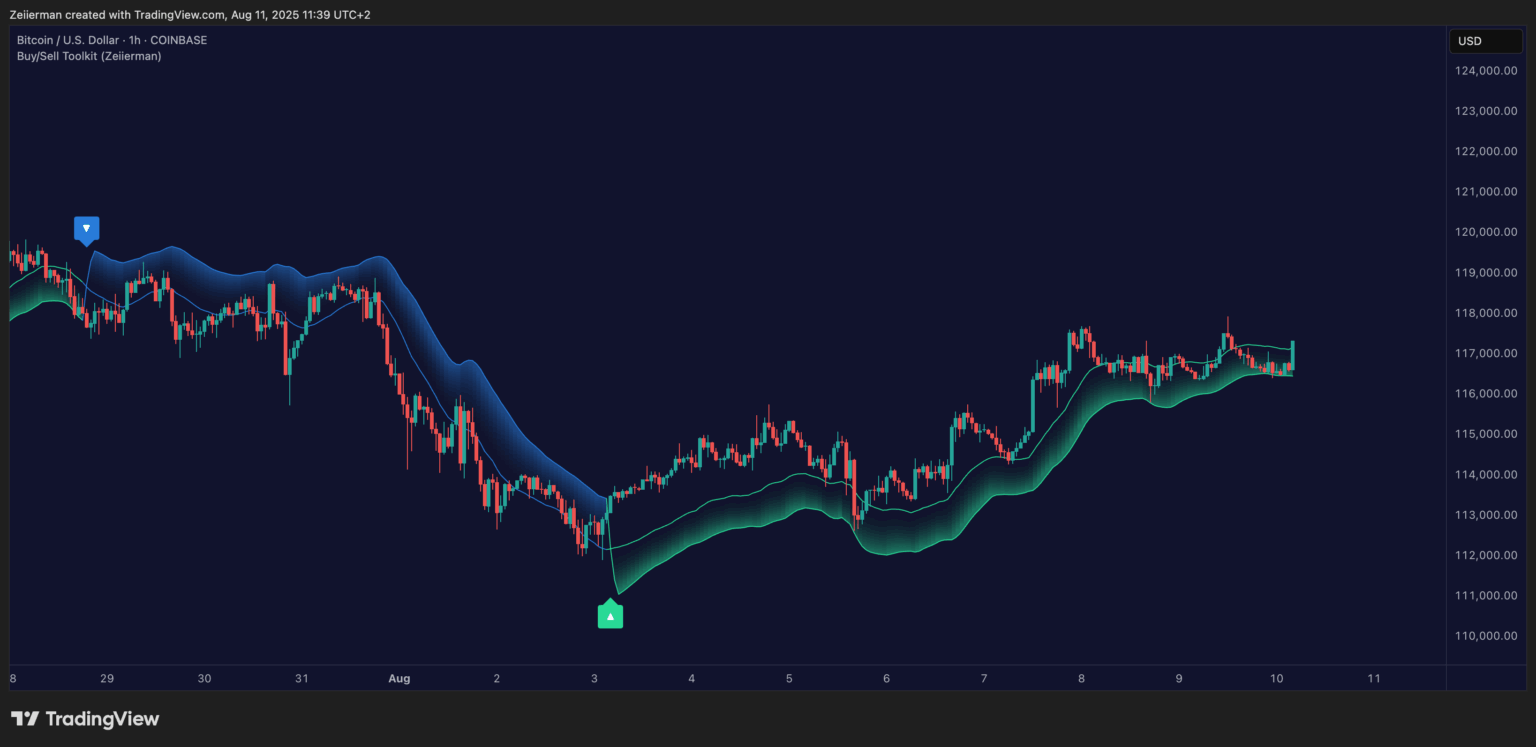
Let’s take a look at what the Chart Analyzer sent back and I’ll give you my final chart in the end.
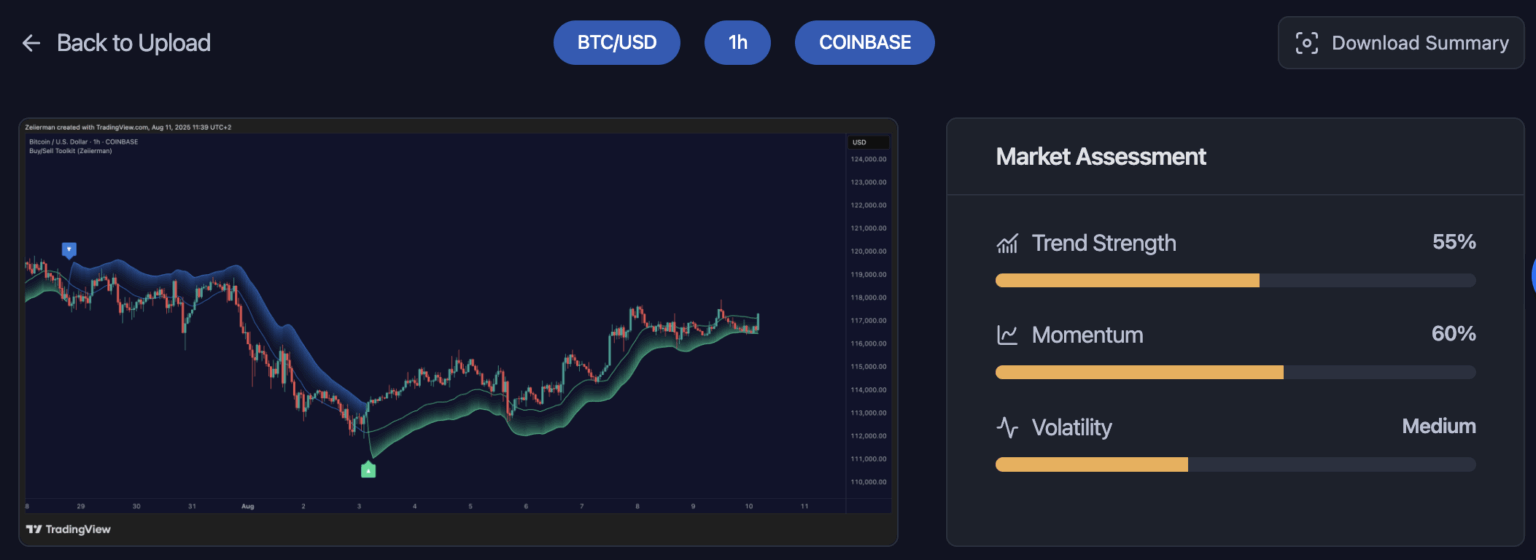
This paints a picture of a market with a slight bullish lean but still balanced between buyers and sellers. The moderate readings suggest price has enough energy for short-term moves, but you should be prepared for failed breakouts if volume doesn’t follow through.
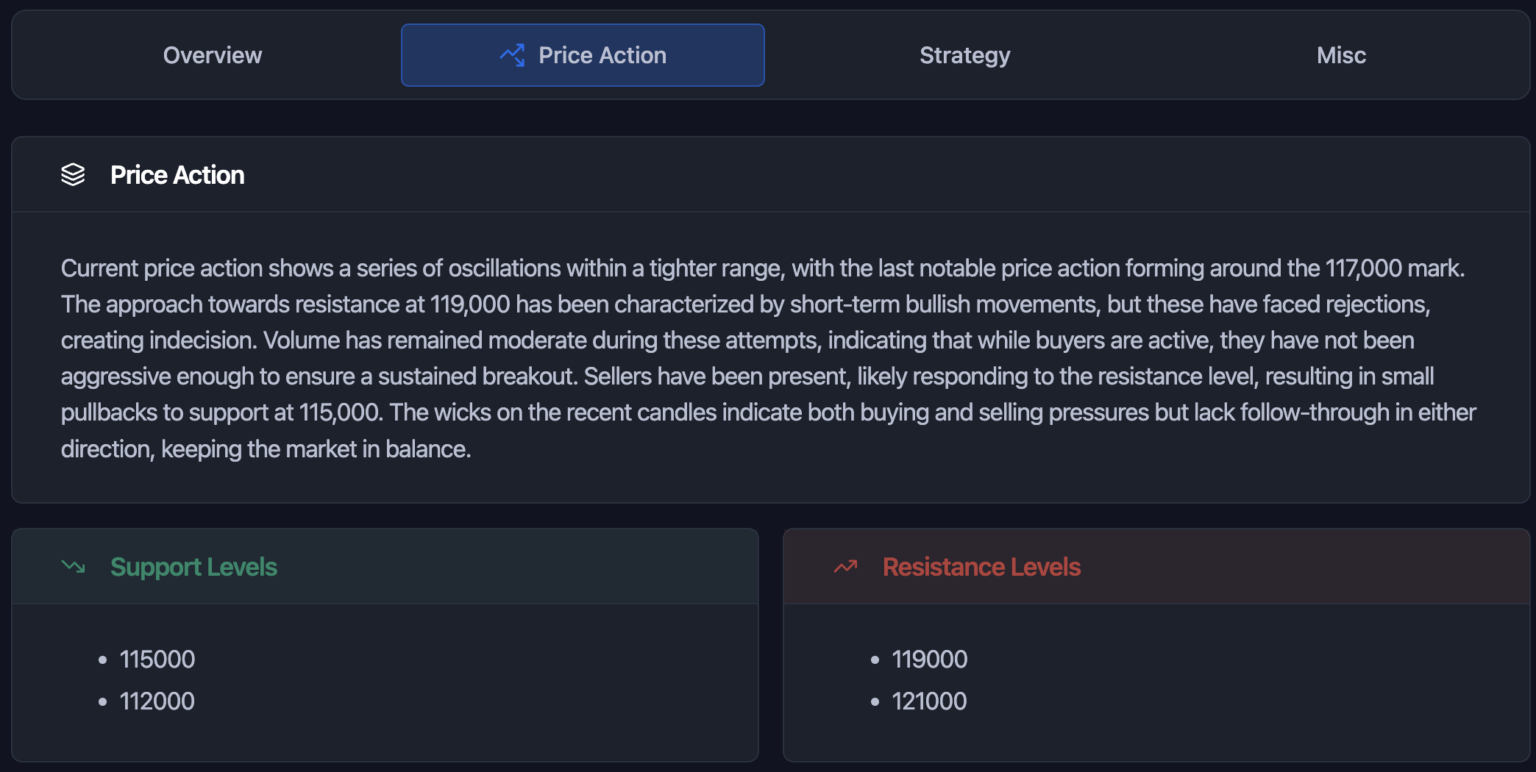
In the Price Action section, the AI identifies a tight range forming around the 117,000 USD zone. Buyers have been making short-term pushes toward resistance at 119,000 USD, but each attempt has been met with rejection.
Volume analysis shows that while buyers are active, they lack the aggression to force a sustained breakout, while sellers are quick to defend resistance levels. This has led to minor pullbacks toward support at 115,000 USD and 112,000 USD.
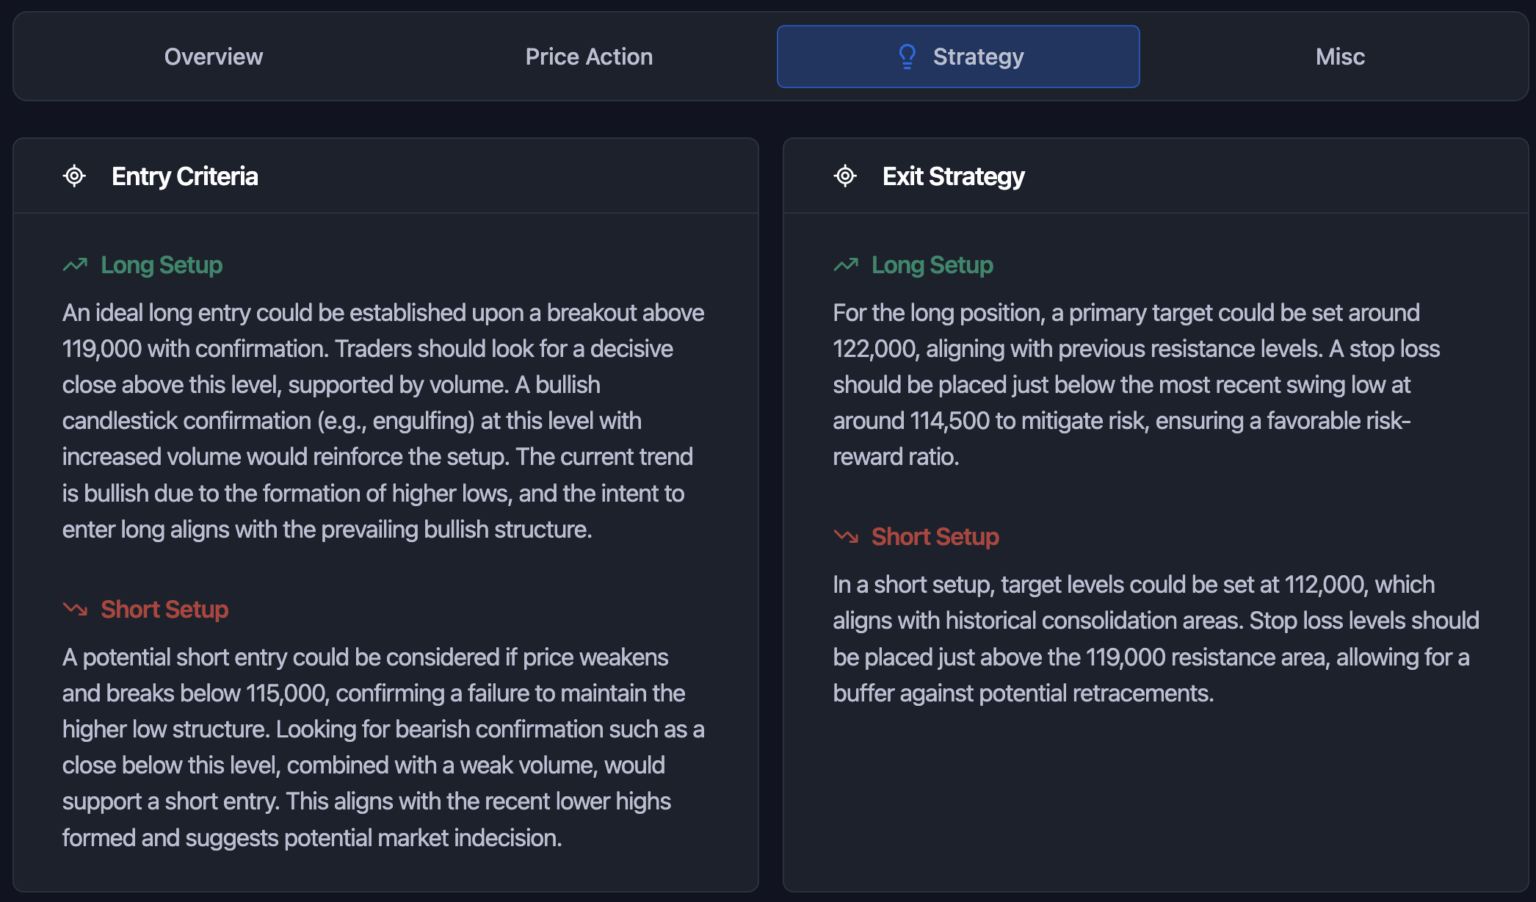
From a Strategy standpoint:
- Long Setup: A bullish trade could be considered if the price breaks and closes above 119,000 USD with volume confirmation. A bullish candlestick formation like an engulfing candle at that level would add conviction. Targeting 122,000 USD would align with historical resistance, with a protective stop just below the most recent swing low at 114,500 USD.
- Short Setup: A bearish bias may come into play if the price fails to hold 115,000 USD. This could target 112,000 USD, with stops just above 119,000 USD to account for potential false breaks.
On the basis of the chart and AI’s analysis, this was my takeaway:
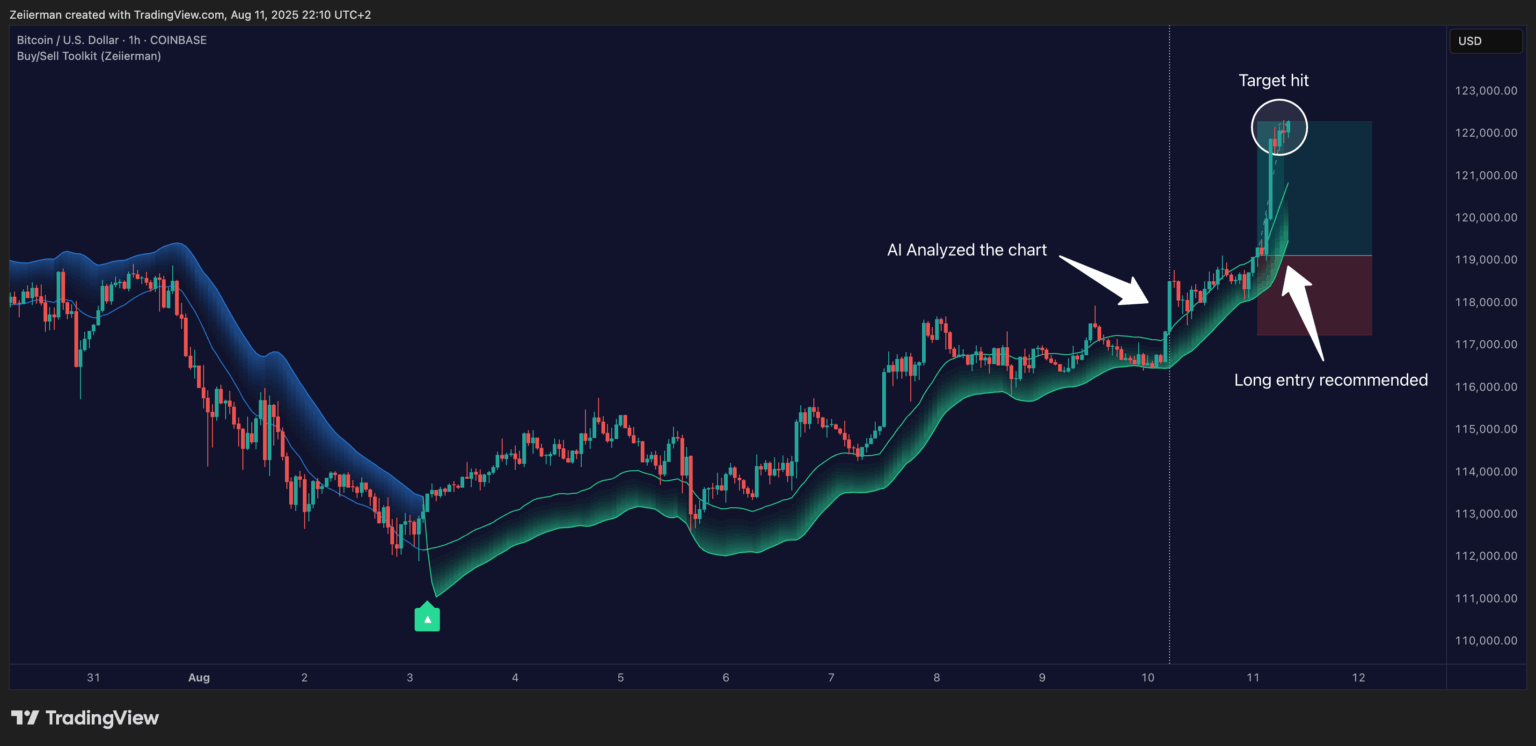
The AI Chart Analyzer’s call for a long entry above 119,000 USD played out with precision. Price broke through resistance with strong bullish volume, confirming the setup, and ran straight to the 122,000 USD target outlined in the AI’s exit strategy.
4. Combining AI Output With Your Own Analysis
The AI Chart Analyzer is built to act as your co-pilot, not your autopilot. It provides a structured, data-driven overview of the market. However, the ultimate decision to pull the trigger should always rest on your own strategy, rules, and market context.
The danger for many traders is over-reliance. They see an AI-suggested long setup and jump in without asking: Does this align with my system? Is the R:R profile acceptable? Am I trading into news or low-volume conditions?
📌 My Advice? If the AI output matches your bias and passes your checklist, that’s confluence. If it conflicts with your bias, don’t force the trade just yet. First, investigate why the AI sees it differently and decide if that perspective adds value.
One of the best ways to do this is to pair AI findings with our indicators (scripts) on TradingView. For example:
- Use Smart Money Concepts indicator to confirm market structure shifts, BOS/CHoCH, and institutional zones flagged by the AI.
- Layer in Liquidity Maps to verify if the AI’s suggested targets or stops are near key liquidity pools.
- Cross-check with Volume Profile & FVG tools to see if the AI’s trade idea sits in a premium/discount zone with supporting order flow.
When the AI’s structured breakdown, your own chart work, and our indicators all point in the same direction, you’ve stacked multiple edges into one trade idea. That’s when the odds shift in your favor.
Read: Why TradingView is Perfect for Beginners in 2025Frequently Asked Questions (FAQs)
How accurate is the AI Chart Analyzer?
The AI Chart Analyzer provides structured market insights grounded in technical principles. Its accuracy depends on market conditions and usage. Our AI analysis tool examines uploaded charts to assess trend strength, momentum, volatility, support/resistance levels, and trade setups. In trending markets, it often aligns with the analysis of experienced traders. However, in choppy and/or news-driven conditions, it still highlights risks and uncertainties.
Treat its output as an objective second opinion to add speed and perspective, not as an absolute prediction.
What markets does it support?
The AI Chart Analyzer works with any market where you can upload a readable chart image, including forex, stocks, crypto, indices, and commodities. The AI adapts insights to detect timeframes and instruments, making it useful for multi-market traders.
Can it be integrated with other tools?
The AI Chart Analyzer is a standalone feature within the Zeiierman Trading Dashboard and doesn’t connect directly to third-party platforms for automation. However, it pairs well with other tools and scripts on TradingView. You can upload charts, use their analysis alongside Zeiierman Trading indicators, or integrate reports into your trading or backtesting workflows.
How many credits does each analysis cost?
Each analysis report costs 10 credits, which are charged to your balance.
Will it replace manual technical analysis?
The Zeiierman AI Chart Analyzer can’t replace manual technical analysis. And it shouldn’t. The AI Chart Analyzer is for decision support, not to replace a trader’s judgment or risk management. It does not account for personal strategy, news, or risk. Use the AI as a co-pilot, combining its analysis with your own, Zeiierman indicators, and situational awareness for better trading decisions.
Zeiierman
With over 16 years in the market, Zeiierman has extensive experience as a full-time trader and risk advisory consultant for hedge funds. He has developed many profitable trading strategies, drawing on his background in risk management and strategy execution.
More from Zeiierman