Trading is all about recognizing opportunity before it leaves you behind. One of the cleanest ways to spot a major opportunity is through reversal patterns — and the 2B Reversal Pattern is one of the most effective tools we have in our arsenal.
Unlike basic trendline breaks or textbook chart patterns, the 2B reversal digs into market behavior. This pattern reduces the chances of leading you into a trap. It exposes failed attempts to make new highs or lows — a major clue that momentum is shifting beneath the surface. In this guide, I’ll walk you through exactly what the 2B Reversal Pattern is, why it works, and most importantly, how to trade it with a clear, structured approach.
My guarantee? No complicated theories. No false promises. Just a straightforward blueprint for spotting and trading one of the rather reliable and easy-to-spot reversal patterns.
And once you’re done with this one, move forward to my Mastering 2B Reversal Pattern guide.
Try Our 2B Reversal Pattern Indicator on TradingView
1. What is the 2B Reversal Pattern?
Introduced by Vic Sperandeo, aka Trader Vic, and now made into a free-to-use indicator on TradingView by yours truly (Zeiierman), 2B Reversal Pattern signals a potential end to an existing trend.
It’s built around a simple but critical concept: the failure of price to continue making new highs (for peaks) or new lows (for valleys). At its core, the 2B pattern is not about predicting tops and bottoms — it’s about recognizing when momentum breaks down, and the market runs out of fuel.
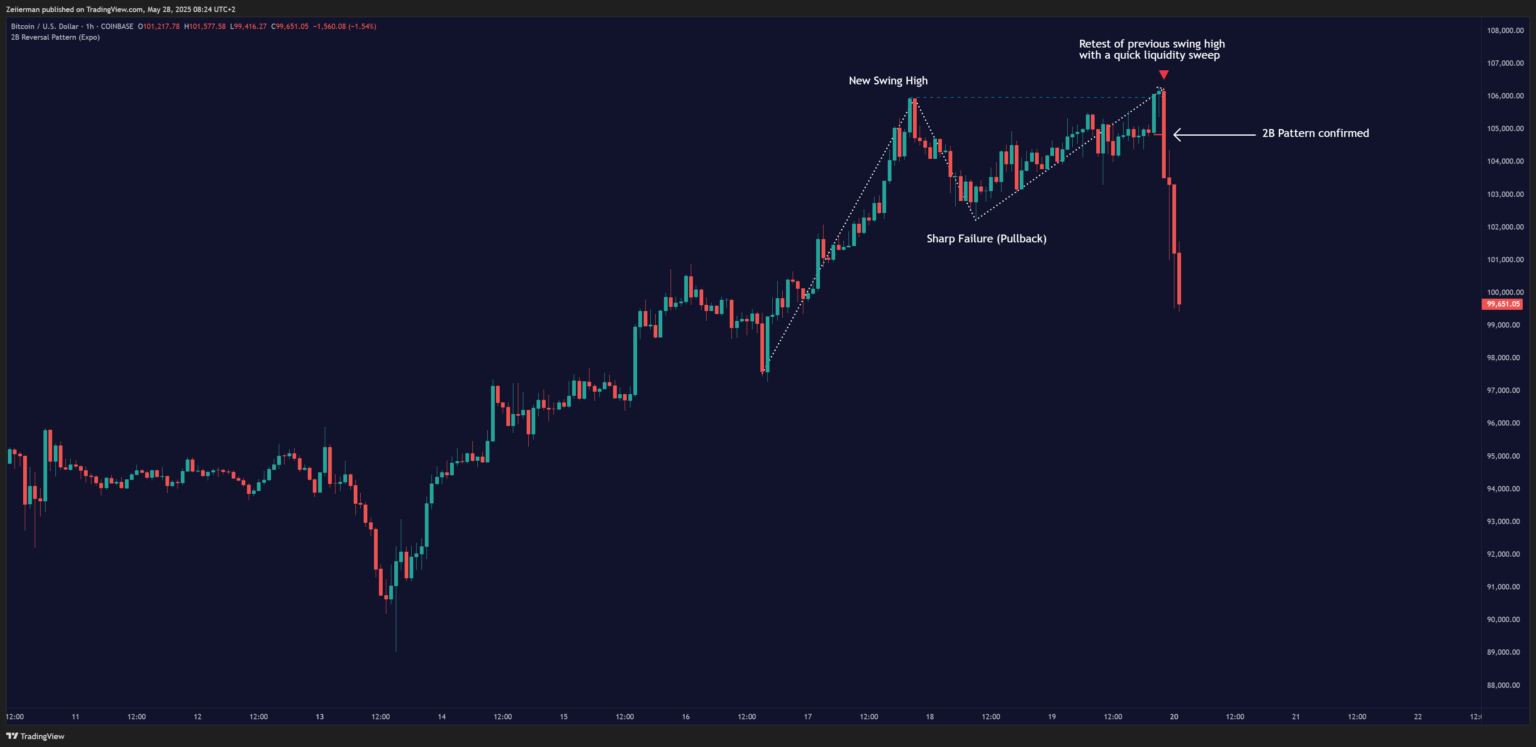
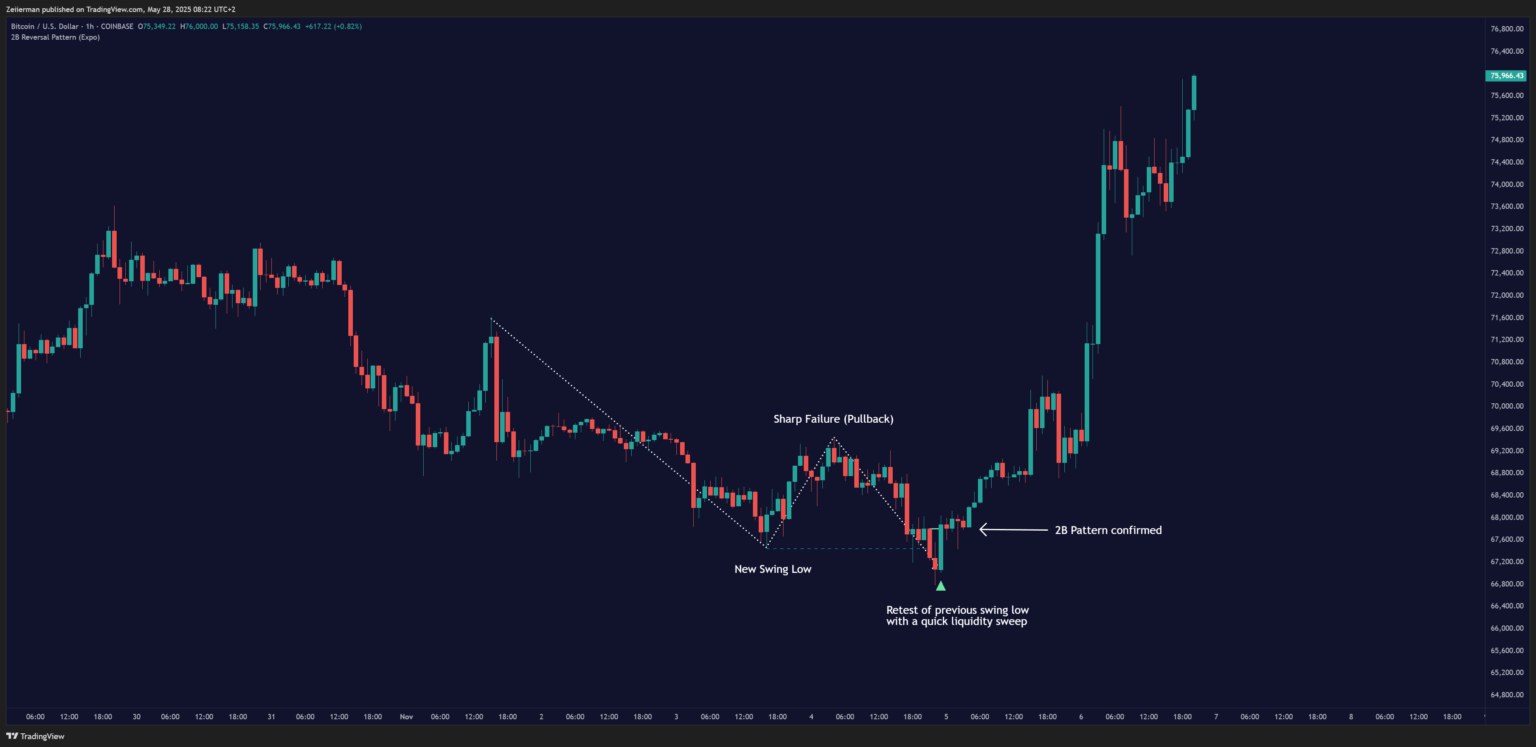
Uptrend → New Swing High → Sharp Failure → Retest → Reversal
Note: While that is the general theory for 2B reversal pattern, our concept (and indicators) work a bit differently. We want to see a QUICK liquidity sweep above/below the previous swing high/low or an equal high, and sharp rejections immediately. Here’s how 2B Reversal Pattern forms on a chart:
Step 1: Price Breaks a Key Swing High or Low
- In an uptrend, the price pierces a previous high.
- In a downtrend, the price dips below a previous low.
But this initial breakout wouldn’t be supported by true momentum. It is often driven by stop hunts or retail traders chasing the move. Institutions know this and often use these zones to offload positions.
Tip: We want to see a quick, decisive break here. If the price tiptoes past the level slowly, it’s often a chop, in my experience, not a true trap setup.
Read: Mastering the 2B Reversal Pattern: Strategies for Forex and Crypto MarketsStep 2: Price Reverses Back into the Range
This is the red flag moment.
- Buyers who jumped in after the breakout now see the price collapsing back into the prior range.
- Sellers (or buyers, in the case of downtrends) recognize the trap and start stepping in.
This is a crucial point – the speed of the failure matters. The faster the re-entry into the old range, the better. I am ballparking the figure here but it is usually 3–5 candles or less on your chosen timeframe.
📌 If price lingers near the breakout level without conviction, you’re not looking at a real 2B — just indecision.
Step 3: Retest and Confirmation
Strong setups often give you a second chance. After the rejection, the price might attempt a weak retest of the failed breakout level. If that retest fails to reclaim the breakout zone, it confirms the momentum shift. If the retest prints a weak candle (small body, long wick) at the failed high/low, that’s a high probability confirmation signal. Let’s say BTC/USD breaks above $90,000 but fails and closes back below. It then retests $90,000 with a small-bodied candle and an upper wick. That’s a confirmed 2B.
Step 4: Reversal Unfolds
Once the market accepts the failed breakout, the 2B reversal ought to accelerate. Breakout traders who got trapped will now be stopped, thus fueling momentum in the opposite direction. From here, your job isn’t to predict — it’s to execute:
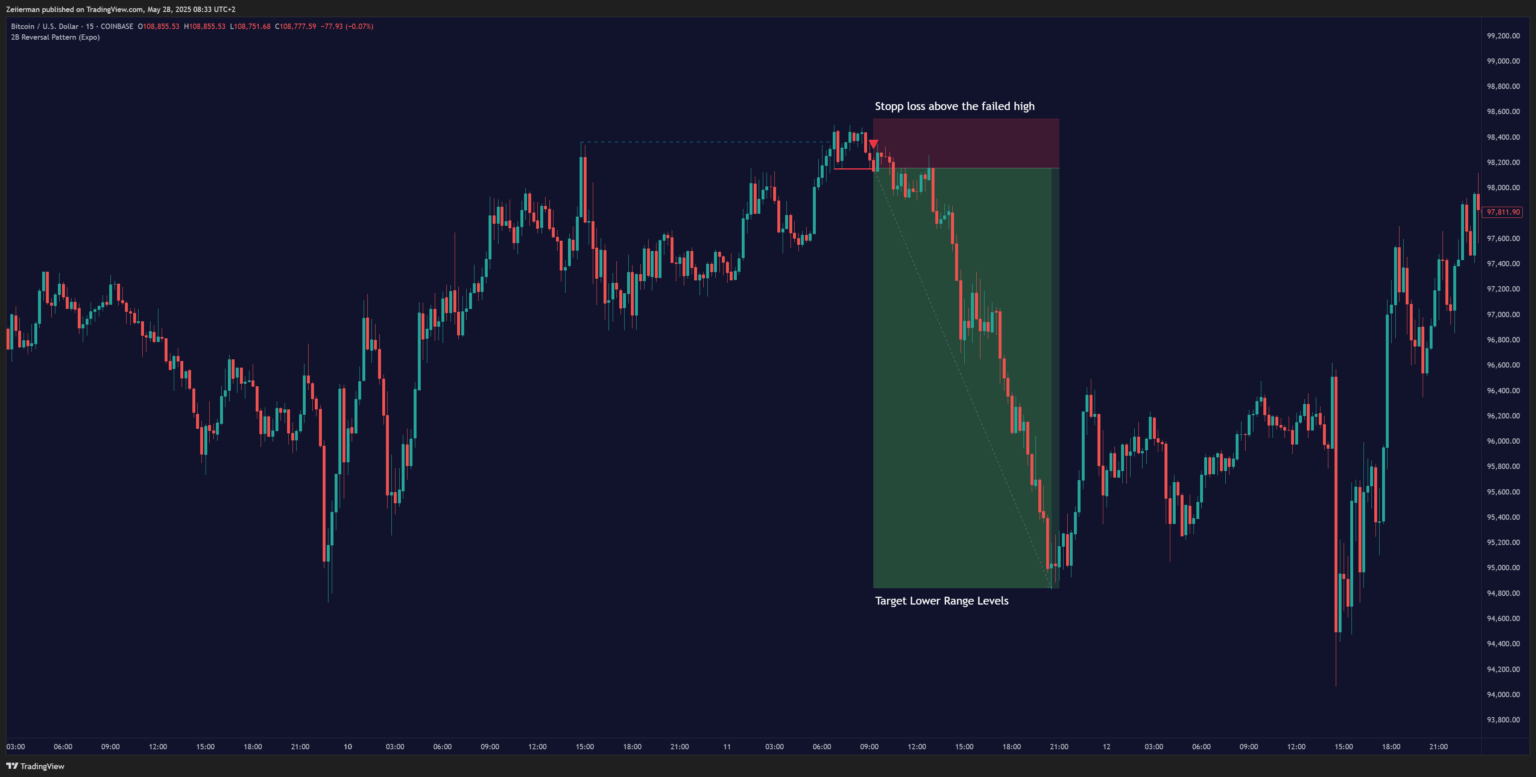
- Entry: Often below the retest candle or break of structure.
- Stop: Just above the failed high/low or above the retest wick.
- Target: The prior swing low/high, a key support/resistance level, or a 1:2+ RR zone.
Let me explain this in detail next.
2. How does the 2B Pattern signal a trend change?
The 2B isn’t magic. It works because it reflects a loss of conviction in the trend. When a trend makes a new high/low but fails to hold it (crucial), that’s your clue:
- Momentum has cracked.
- Fellow traders are now more willing to fade the move than follow it.
If price returns inside the prior range, the previous breakout loses even more credibility — and a reversal becomes more probable.
📌 A confirmed 2B is rarely a top or bottom on its own. The warning flare tells you the current trend is breaking down. Keep your eyes and ears open, and you’ll trade it right.
Read: How to Trade Head & Shoulders Pattern in 2025 – Beginner to Advance3. How to Identify a Valid 2B Reversal Setup?
Here’s what I personally look for when hunting real 2B setups — especially the kind that our Zeiierman Premium indicator is built around:
1. Context is Everything
The pattern should form after a clear directional move — not inside a sideways chop. If you’re spotting a 2B inside a tight consolidation range, it’s likely noise, not structure. Look for strong trend legs that get suddenly interrupted.
2. Quick Liquidity Sweep, Instant Rejection
This is what separates textbook 2Bs from the real, tradeable ones. You want to see a price spike above a previous high or equal high (or below in downtrends) — grab liquidity — and then reject immediately. I’m talking one or two aggressive candles — not ten indecisive ones crawling back into the range. If it takes too long, it’s not a trap — it’s confusion.
3. Obvious Highs/Lows Get Tagged
The level being broken should be clean and visible to retail traders. That’s the bait. The best 2Bs take out obvious highs/lows that everyone sees — swing points, equal highs, session tops/bottoms.
4. Failed Retest After Rejection
After the rejection, the market may attempt to retest the broken level. This retest often prints a weak, indecisive candle — a small-bodied doji or a long-wick rejection. That’s your confirmation that the breakout has failed and the reversal is likely real.
5. Volume & Price Action Clues
Look for a volume spike on the liquidity grab, followed by fading volume as price starts reversing. This is a tell-tale sign of stop hunts getting absorbed by smart money.
4. How to trade the 2B Pattern? (Entry, Exit & More)
Here’s how you trade / execute the 2B Reversal Pattern correctly:
A. Entry Strategy
There are two primary ways to enter a 2B setup:
Conservative Entry
- Wait for the retest of the breakout zone to fail.
- Enter after a rejection candle closes (e.g., pin bar, engulfing pattern).
For this entry, the confirmation will likely come from a break of a minor support/resistance level inside the structure.
Aggressive Entry
- Enter on the candle that invalidates the breakout (price closes back below/above the breakout level).
- Requires confidence and a tighter stop.
- Higher reward potential but also a higher risk of chop.
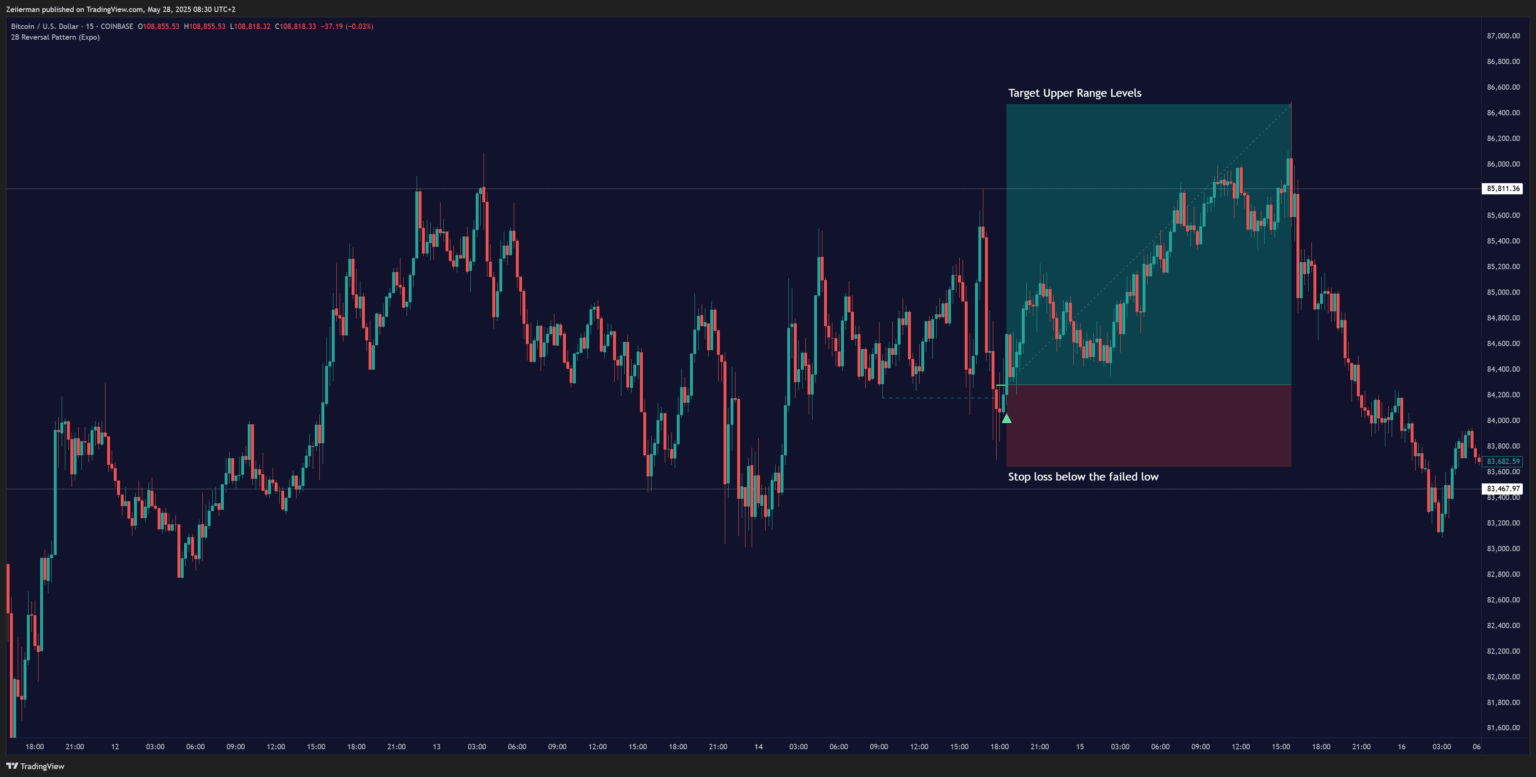
B. Exit Strategy
Stop-Loss Placement: Where you place your stop when executing 2B Reversal Pattern strategy determines how long you survive. For 2B highs, place the stop above the failed high. For 2B lows, place the stop below the failed low. Alternatively, you can place your stop above/below the wick of the retest candle (for tighter risk). Avoid placing stops too close to the level. You’ll get wicked out by noise.
Profit Targeting: It’s important to use structure and context to define your exit. Here’s how I usually set my profit targets for the 2B Reversal Pattern strategy, depending on my mood of course…
- Conservative target: Return to previous range (swing high/low).
- Standard target: 1.5–2x risk for minimum RR.
- Aggressive target: Next major support/resistance level or trend reversal zone.
If the price moves cleanly in your direction and prints a strong momentum candle, scale-out partial profits and trail your stop behind key swing points.
Ideal Timeframe: The 15-minute or 1-hour timeframe is often the best place to start for 2B Reversal Pattern strategy. These timeframes offer enough context to spot the pattern clearly without overwhelming noise or overly large stop losses. They also help beginners learn structure recognition, entry planning, and trade management without the extended waiting periods of higher timeframes.
Read: Why TradingView is Perfect for Beginners in 2025C. Risk Management
- Risk 0.5–1% per trade, depending on confidence and volatility.
- Don’t increase size just because a setup “looks clean.”
- Avoid overlapping setups—2B should not conflict with other major levels or patterns.
D. Common Mistakes to Avoid
Entering Too Early: A 2B pattern isn’t confirmed because the price made a new high or low. Wait for the failure and (I highly recommend) a weak retest before committing. Entering too soon could trap you in the crowd, and we don’t want that.
Trading in Consolidation: 2B patterns are most effective at the ends of trends—not in the middle of a sideways market. If there’s no clear structure or prior trend, skip it.
Misreading the Retest: Not all retests are created equal. A retest that reclaims the breakout level invalidates the pattern. On the contrary, a weak retest will confirm the setup. If the retest closes strongly in the direction of the original breakout, step aside. In my experience, you’re no longer trading a trap but into continuation.
Ignoring Market Context: Even a perfect 2B setup can fail if the overall market is trending hard against it. Use a higher timeframe structure to check bias. Don’t short a 2B high if the daily chart is mid-breakout on strong volume.
Poor Stop Placement: Tight stops right on the level get taken out often. Stops should be placed above the wick, not the body. Give the setup enough room to breathe while maintaining a rational risk profile.
📌 A clean setup doesn’t guarantee a profitable trade—but sloppy execution guarantees bad outcomes. Let the pattern complete, evaluate it in context, and trade with rules—not emotion.
5. How Premium Traders Use the 2B Pattern with Bellcurves
Inside our Zeiierman Premium membership, the 2B Reversal Pattern is often used in conjunction with the Bellcurve Strategy — especially for detecting major liquidity shifts or reversal zones before they develop.
When combined, the result lets you
- Spot reversal setups earlier by reading where volume and value are concentrated.
- Avoid weak 2B signals that form in illiquid or structurally weak areas.
- Confirm retests using dynamic Bellcurve zones, which often align with failed breakout points.
It’s a refined version of the same logic: read the structure, assess risk, and execute when both tools align. Many of our members and @SM_Trader rely on this pairing to filter out false breakouts and enter high-conviction trades only when momentum and structure agree.
6. Is the 2B Reversal Pattern still effective in 2025?
The 2B reversal pattern is still effective and quite profitable in modern trading. In 2025, with faster execution and more algorithmic volatility, many breakout traps have only become more common.
The 2B strategy works well because it focuses on identifying failed breakouts, which are typically fueled by emotional entries or automated stop runs. When confirmed with structure and executed with discipline, the 2B pattern remains one of the most practical tools for reversal traders today.
7. How reliable is the 2B Reversal Pattern?
When traded with proper confirmation and in the right context, the 2B reversal pattern is considered one of the more reliable reversal signals. In our internal backtests and community-shared setups, clean 2B patterns that align with the structure, volume exhaustion, and weak retests have shown incredible success rates. However, the pattern isn’t foolproof. A clean 2B setup can fail if traded in isolation, against the higher timeframe trend, or during highly volatile events.
Read: Unlock Success in Prop Firm Challenges with the SMC Orderblock Trend StrategyReversal trading, in general, can be highly profitable. But to achieve that level, you need timing, confirmation, and risk control skills – all honed through market experience. While trend-following strategies aim to ride large moves, reversal strategies like the 2B reversal are designed to catch key turning points—often with tighter entries and better risk-to-reward ratios. The challenge lies in avoiding premature entries and recognizing when a trend has been exhausted.
Research Insight: Thomas Bulkowski’s 10-Year Study
Chart pattern researcher Thomas Bulkowski analyzed over 41,000 potential 2B tops and nearly 15,000 2B bottoms across 468 stocks from 2010–2020. His goal? To test if the 2B pattern holds up in real market conditions.
Bulkowski’s key findings from the 2B Top analysis:
- Median drop after a confirmed 2B top: 7%
- Best performance came when the second peak was 4% or more above the first, leading to average declines of 16%
- Closer peaks (10 days apart) showed sharper reversals (median drop 7%) than wider ones (6%)
- On average, 2B tops beat the “normal” post-peak benchmark decline in only 34% of cases
Bulkowski’s key findings from the 2B Bottom analysis:
- Average gain from 2B bottoms: 33%
- Best gain occurred when the second valley was slightly below the first
- Shorter-duration bottoms (<21 days) produced better outcomes than longer setups
- 2B bottoms beat the benchmark rise only 33% of the time, with average gains in the other 67%
Bulkowski’s research reinforces a few things we’ve already seen:
The closer the peaks or valleys, the sharper the reversal. 2B tops/bottoms aren’t guaranteed to outperform, but the right structure (second high/low slightly beyond the first) increases probability. The pattern is useful, but must be confirmed with volume, structure, or SMC-based context—not traded blindly.
📌 The 2B pattern isn’t a cheat code. When used in isolation, it beat the benchmark only a third of the time. But when filtered properly—as we show throughout this guide—it remains one of the few consistent reversal setups.
8. Frequently Asked Questions (FAQs):
Can you use the 2B pattern for swing trading?
The 2B reversal pattern is well-suited for swing trading. It often appears at the end of extended moves, making it ideal for capturing multi-day reversals. Typically, you must use the 4-hour or daily charts for swing setups and aim for 1:2 or better risk-to-reward ratios. If the pattern is confirmed with a clean structure and a strong failure, it can be as effective on higher timeframes as intraday.
Does it work in all markets?
The 2B pattern works across most liquid markets—including forex, crypto, commodities, and indices. The underlying principle is universally true: a failed breakout traps participants and fuels a reversal. However, execution may vary based on volatility, session behavior, and liquidity depth. The structure and momentum behind the move matter more than the market.
Does the 2B reversal pattern work in volatile markets like cryptocurrency?
Yes, the 2B reversal pattern can be very effective in crypto, which is known for frequent stop hunts and fake breakouts. Crypto markets often exaggerate the behavior the 2B is designed to exploit—overextension and quick rejections.
Is the 2B reversal pattern effective in forex trading?
The 2B pattern is highly effective in forex, especially during session opens and news-driven volatility. Forex markets frequently create false breaks at key highs and lows to sweep liquidity. A confirmed 2B setup with volume divergence or weak retests can lead to strong directional moves. Major pairs like EUR/USD and GBP/JPY frequently display this behavior.
Zeiierman
With over 16 years in the market, Zeiierman has extensive experience as a full-time trader and risk advisory consultant for hedge funds. He has developed many profitable trading strategies, drawing on his background in risk management and strategy execution.
More from Zeiierman