A breaker block is a failed order block, which is a zone where price breaks through support/resistance and then flips its role (from resistance to support or vice-versa). We then use the retest of that flipped zone for high-probability entries because it signals a market-structure shift and institutional liquidity interest.
I probably said quite a few “technical terms” there. Don’t worry, it was just a summary – like an abstract section from research papers. I will go into detail and explain breaker blocks to you in lay terms.
We’ll also be talking about my trading plan with breaker blocks and how you can adapt them into your trading strategy with appropriate risk management.
Let’s retake it from the very top.
A. What is a Breaker Block?
Based on Smart Money Concepts (SMC), breaker blocks are a key concept in modern price-action trading. They represent levels where institutional activity has shifted market direction. In practice, a breaker block forms when a previously important supply or demand zone (an order block) is broken by price and causes a flip in its role as support or resistance.
I am sure you’re already familiar with order blocks. My trading companion, @SM_Trader, has an amazing article on order blocks if you need to brush up.
An order block is a historical supply or demand zone where institutional orders get piled up. It typically acts as support or resistance during the initial move. By contrast, a breaker block is the same zone after it fails. When the price closes beyond an order block, that level is flipped and becomes a breaker block acting on the opposite side.
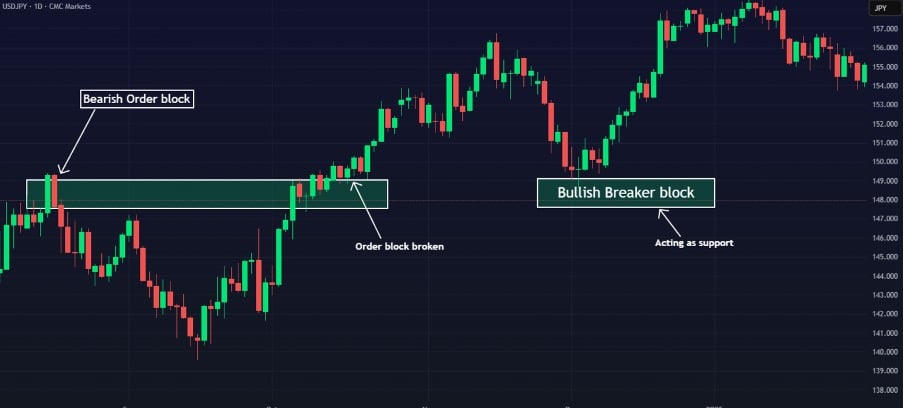
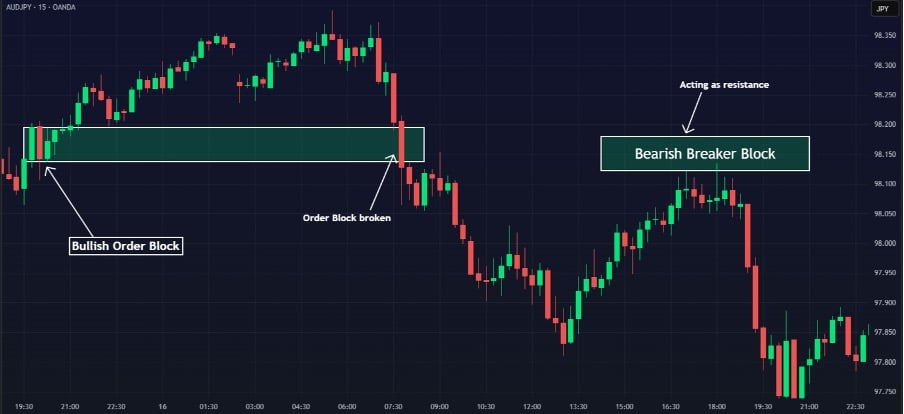
For example, a bullish order block (support) that is shattered by a bearish breakdown becomes a bearish breaker block, now serving as resistance. Conversely, a bearish order block (resistance) broken by a bullish rally becomes a bullish breaker block, turning into support.
Read: Order Blocks Explained: The Institutional Strategy Traders Need to KnowAnd…you guessed it. There are two main types of breaker blocks, depending on the current trend:
1. Bullish Breaker Block
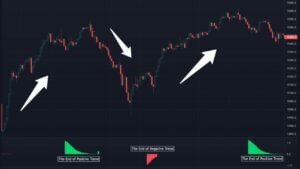
This one begins with a bearish order block. The price is on a downward trend before making a sudden rally that completely wipes out the bearish setup. When the price does come back down, it finds stability and bounces back up. So, what was once a failed bearish zone turns into a strong support level.
2. Bearish Breaker Block
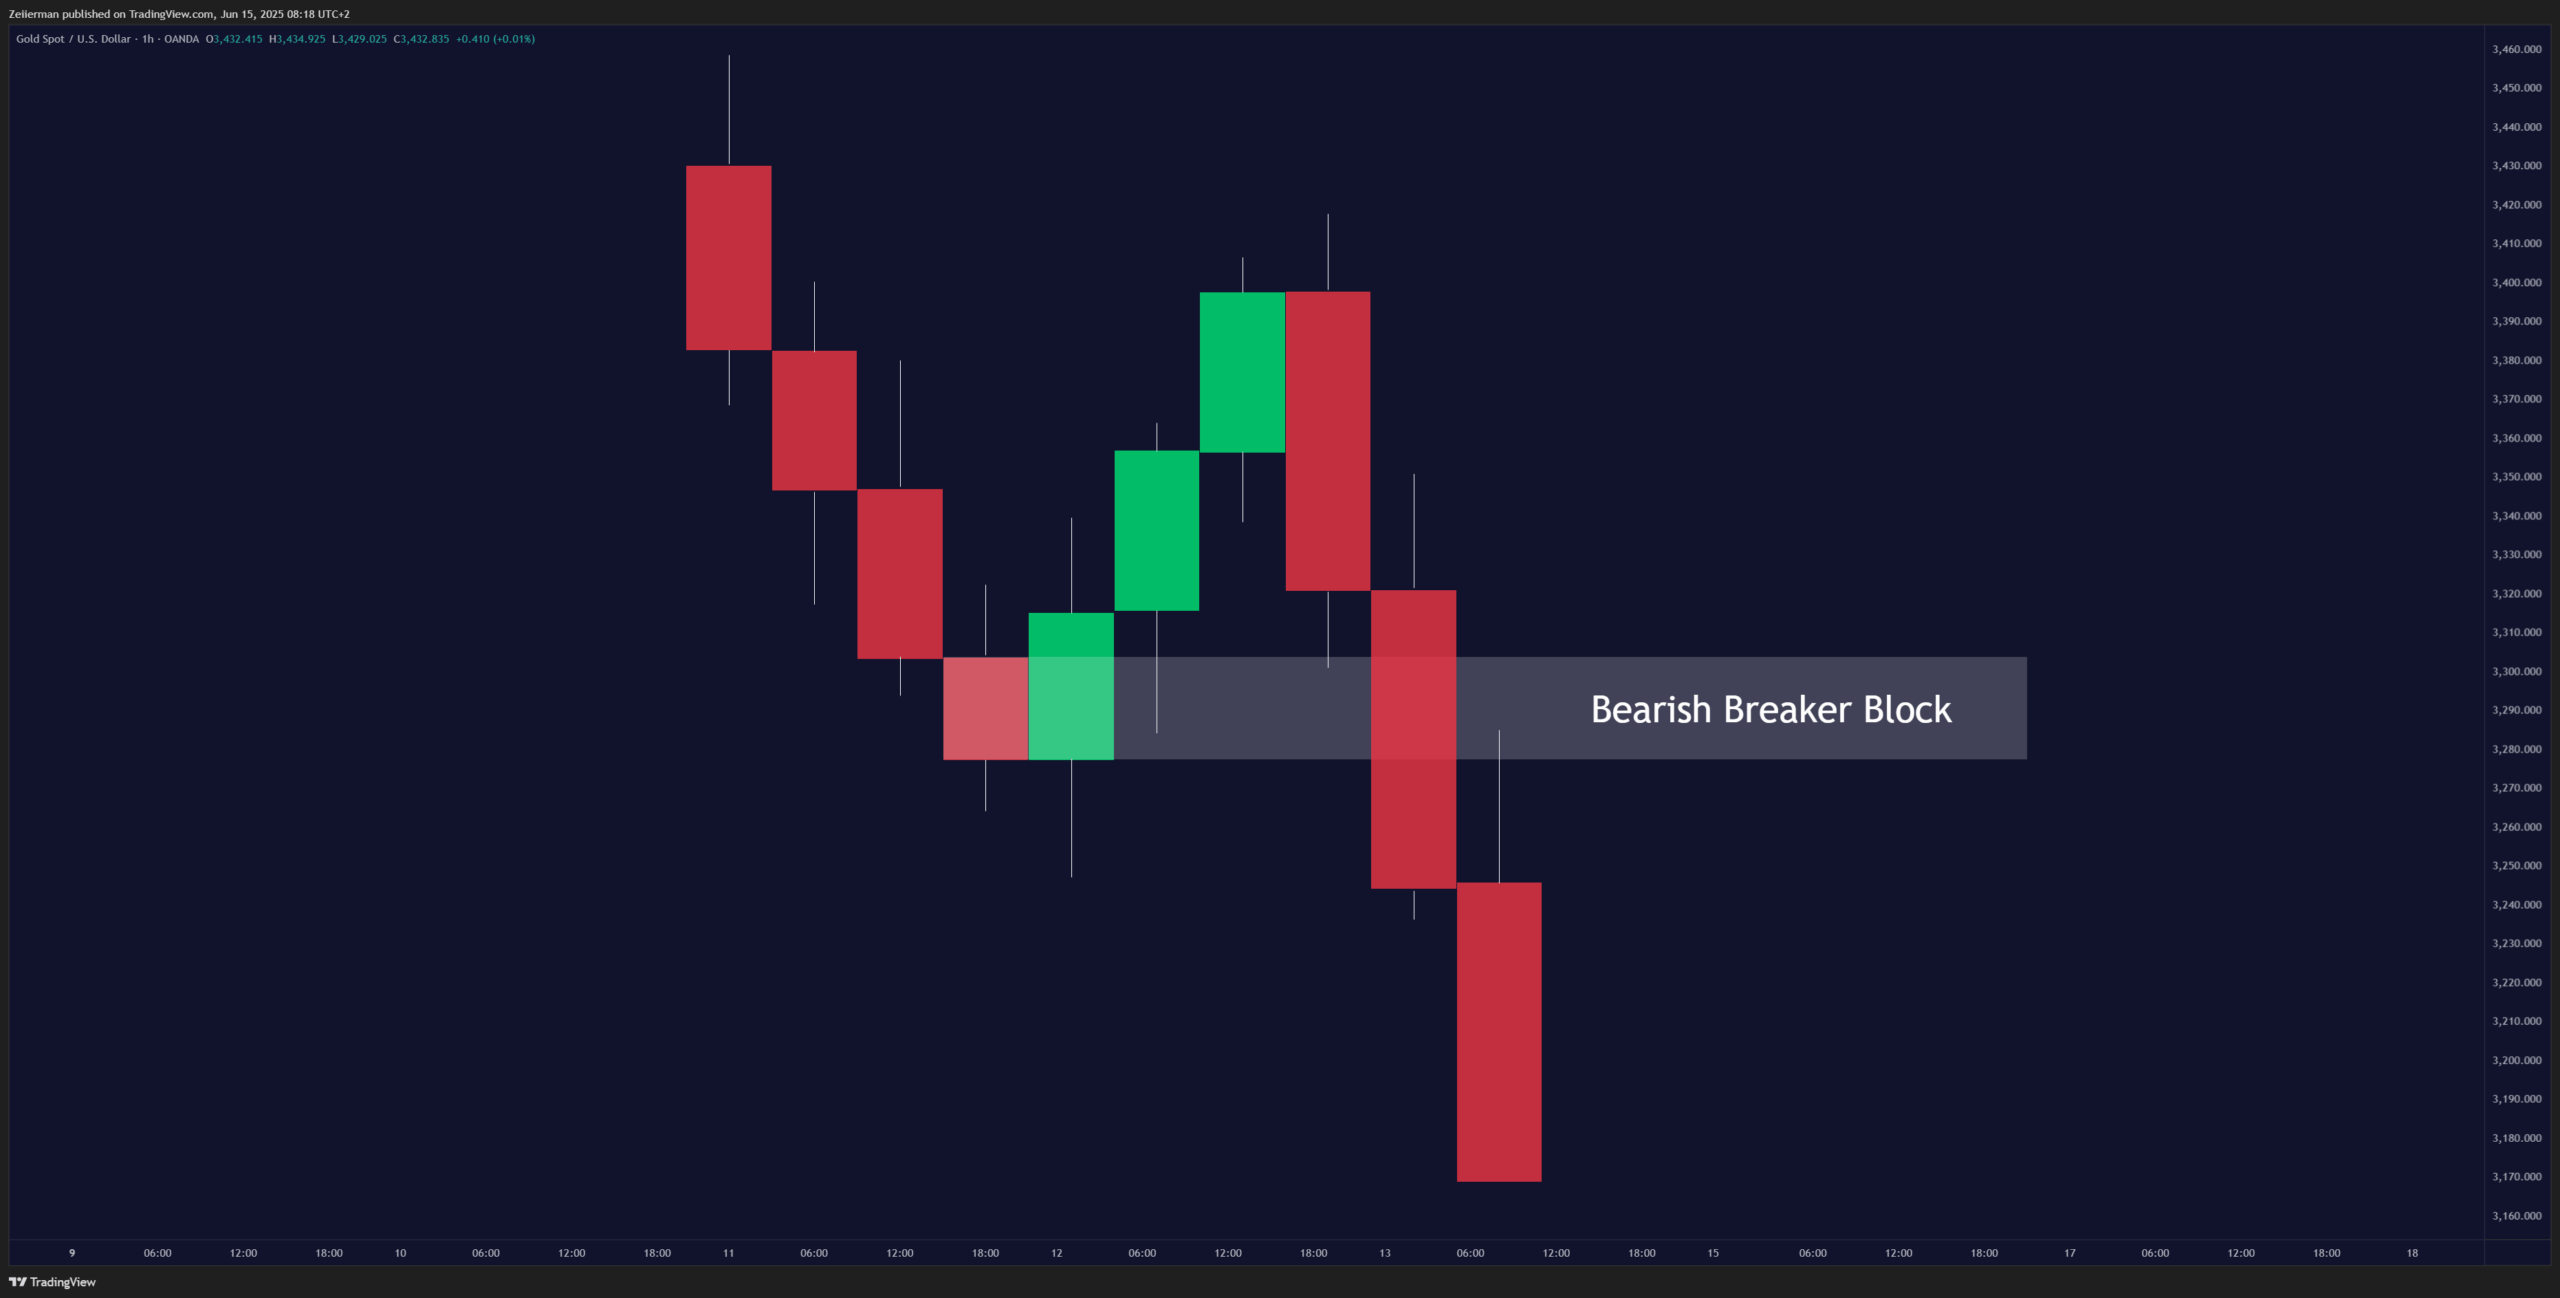
The price rises before crashing unexpectedly and breaking right through that bullish setup. When it finally makes its way back up to that zone, it hits a barrier and drops sharply. Now, that failed bullish area acts as a significant new resistance level.
B. How to Identify Breaker Blocks Step by Step
To identify breaker blocks, you must carefully analyze the market structure and price action. And most importantly, be patient. Most traders follow the basic checklist to spot the blocks:
Step 1: Analyze Market Structure
Look for a clear break of structure (BOS) first and foremost. It implies that the price has decisively broken a recent swing high (or swing low). The trend is now shifting. For example, in an uptrend, a bearish breaker needs a lower low (break of a swing low).
In simpler terms, look for a strong candlestick that closes above the previous key level. This break is often accompanied by a “liquidity sweep.” A liquidity sweep is a spike beyond prior highs or lows where stop orders of retail traders are hunted by big players.
Step 2: Locate the Pre-Break Order Block
Identify the order block that was just broken.
- If the price moved down, find the bullish order block (the last significant bullish candle or consolidation before the breakdown).
- If the price moved up, find the bearish order block (the last bearish candle before the breakout).
Mark the high and low of that candle or the zone of consolidation. This zone is a possible spot for the breaker block. It should stand out as a clear zone where the price previously reversed hard.
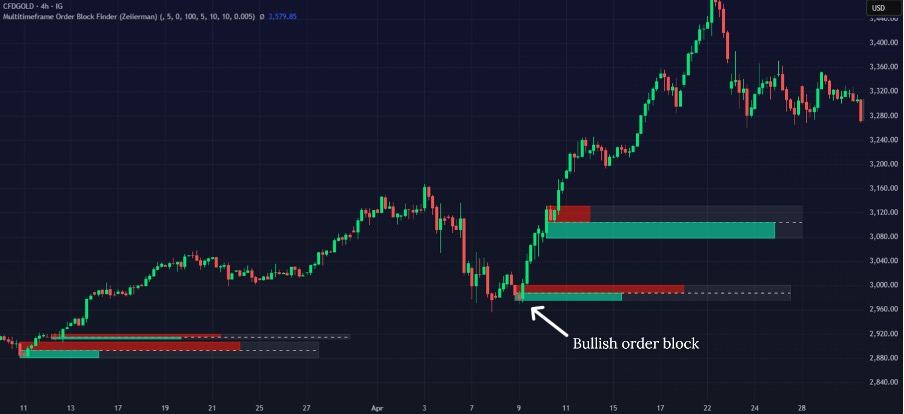
You can use the Implied Orderblock Breaker or the Multitimeframe Order Block Finder made by yours truly to identify enhanced order blocks within the market.
Step 3: Confirm the Break
This is where you must be patient!
Wait for a confirmed close beyond the order block before you tell the town about an incoming breaker block. For a bullish breaker, the price should close above the bearish order block’s high, and for a bearish breaker, the price should close below the bullish order block’s low.
This closing beyond the block invalidates the original order block, turning it into a potential breaker block. I would often look out to see an impulsive candle with good momentum to confirm the break.
Read: Fair Value Gaps (FVGs): The Hidden Zones Institutions Leave BehindStep 4: Mark the Breaker Block Zone
Once the break is confirmed, redraw the zone using the order block’s range. The breaker block zone usually covers the same area as the original order block candle(s). Plot this on your chart as the high-low range of that candle (or a supply/demand rectangle). This horizontal zone is what price will most likely retest.
Step 5: Wait for a Retest and Confirmation
The most reliable entry comes when the price returns to the breaker block zone. After the breakout, the price often retests the broken level. Watch for the price to pull back into the zone and then show rejection. Here, the common price-action confirmations include bearish engulfing candlesticks on a retest of a bearish breaker, or bullish pin bars on a retest of a bullish breaker.
I advise you to wait for candlestick confirmation (such as an engulfing pattern) or another minor shift in structure before entering to avoid fake-outs.
C. How to trade Breaker Brocks like a smart money trader?
1. Acquire Confirmation
Before we dive into the strategy, you must ensure these prerequisites are met before jumping into a trade:
- There must be a precise alignment with the overall trend and timeframes. Higher timeframes provide greater reliability – for example, identify breaker blocks on a daily or 4‑hour chart for context, then zoom into 5‑to-15-minute charts for entries.
- Look for confirmed Break of Structure (BoS). Price must close beyond the order block so that the old zone is invalidated and can become a breaker. Don’t trade on wicks alone.
- Confirm that the break of structure was sharp and accompanied by the expected liquidity grabs or stop-hunts by the big players.
- Let the Implied Orderblock Breaker highlight the broken order block rectangle.
- Avoid using breaker blocks in choppy, sideways markets, as they work best where a strong trend change has occurred.
Once all the prerequisites are met, we move to figuring out our entry.
2. Entry Setup
The classic entry is on the retest of the breaker block. After price breaks and closes beyond the order block, wait for it to return to that zone. Enter when the breaker block zone is touched, and the price shows a rejection candle (like an engulfing bar or a pin bar).
- For a bearish trade, this means entering short when the price rallies back up to the former order block (now resistance) and fails.
- For a bullish trade, enter long when the price drops to retest the prior block (now support) and holds.
Here, the basic move is entering when the price retraces to the breaker block zone with structural confirmation on higher frames.
3. Risk Management
Place your stop-loss just beyond the opposite side of the breaker zone. In practice, a bearish setup’s stop goes a little above the breaker block, and in a bullish setup, the stop goes a little below. This placement is logical because if the price breaks through the entire zone, the strategy is invalidated, and there’s no reason to stay in the trade.
For a smarter stop, you can use Curved Stop Loss, which calculates a volatility and momentum-aware stop distance and displays it on the chart. If you prefer manual stops, you simply match the Curved Stop Loss suggestion. It would look something like this:
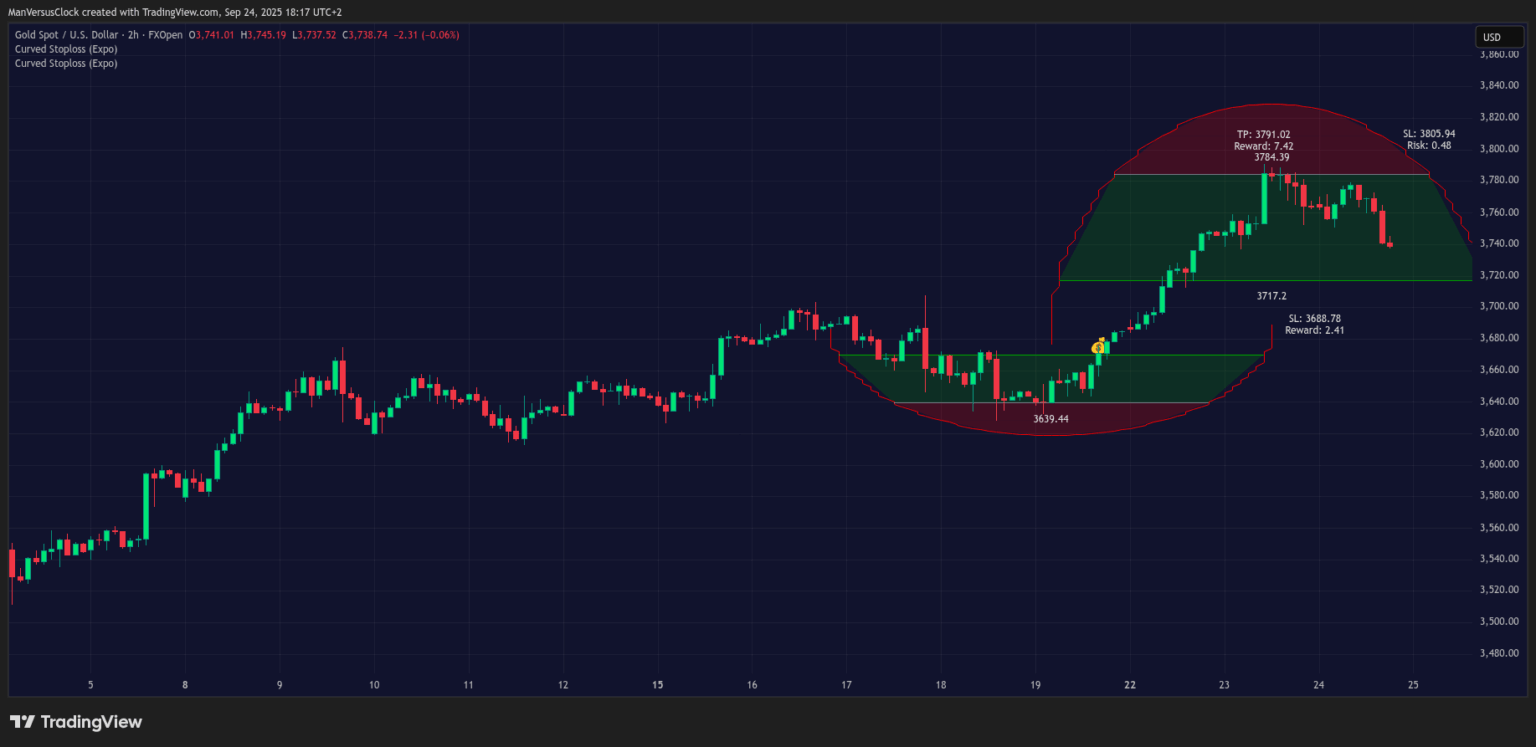
Zeiierman’s Curved Stop Loss tool calculates the best stop-loss distance based on real-time momentum and volatility, which will ultimately help you get an edge in the market. As for targets, you can aim for logical price levels, such as the next swing high/low, or known liquidity zones marked by the Liquidity Levels/Zones indicator. Always aim for a favorable risk-to-reward ratio, such as 1:2 or higher.
This means for every dollar you risk, you aim to make at least two dollars.
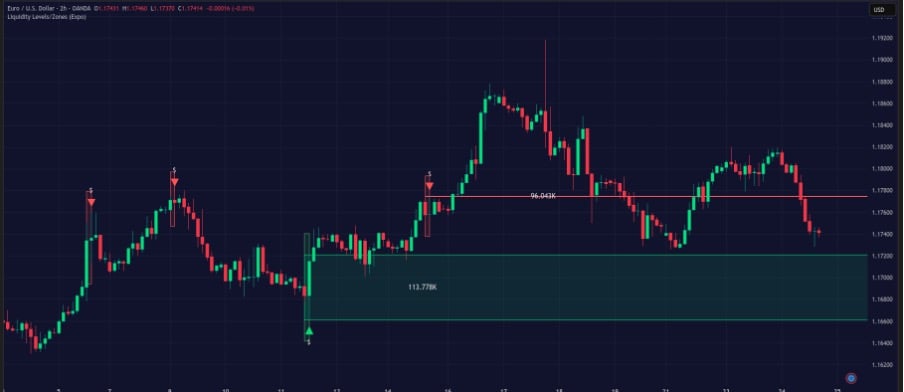
Significant liquidity zones are where the price may experience support or resistance. This tool will help identify potential entry and exit points based on historical liquidity and price-sensitivity analysis.
Try: Zeiierman’s Liquidity Levels/Zones Indicator on TradingView4. Exit and Take-Profit
A common strategy is to target a previous high or low on the chart, where you anticipate the price will encounter resistance or find liquidity. Also, because we are trading in a higher frame, another approach is to use Fibonacci extensions, with levels like the 1.618 or 2.0 extension often serving as good profit targets.
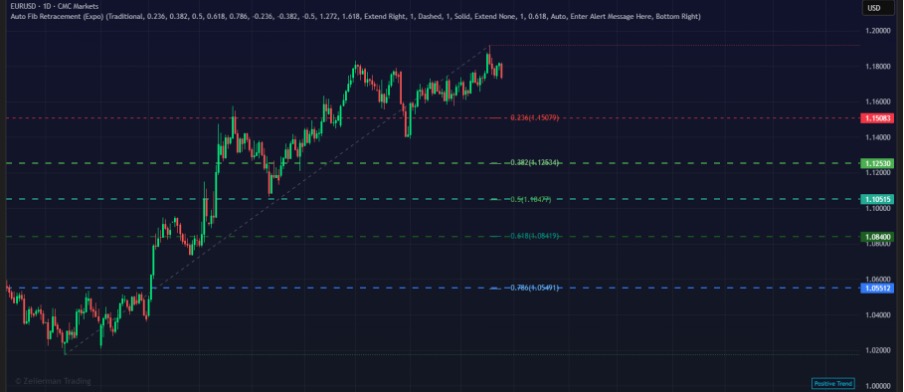
The real-time levels provided by our Auto Fibonacci Retracement give you a quick, easy way to understand current Fibonacci levels, helping you anticipate and react when price levels are tested.
Furthermore, you can consider taking partial profits at key levels. For example, you could close half your position at your first target to secure some gains, then let the rest of the position run with a trailing stop-loss to capitalize on a larger move.
For this, you can also use the Curved Stop Loss to dynamically trail winners based on ATR and momentum, so you don’t give back large chunks of your position.
Frequently Asked Questions (FAQs)
1. Can breaker blocks be used across all markets and timeframes?
Breaker blocks are a structural concept; as such, they can be used anywhere if the context fits. They are most often seen in forex, stocks, indices, and commodities, and the timeframe you choose depends on your trading style.
Day traders may look for breakers on 5-minute or 15-minute charts (with HTF confirmation), while swing traders prefer 4H or daily timeframes. In any market or timeframe, the basic definition remains the same: failed order blocks flip into breaker blocks that act as high-probability trading zones.
2. How do I know if a breaker block has failed?
A breaker block fails when the price doesn’t respect the retest and instead closes decisively through it. For example, if you’re trading a bullish breaker, but the price breaks back below and holds under the zone, that block is invalid. Wicks or quick spikes are normal, but a good, clear close against the block shows failure. When that happens, it’s important to exit quickly instead of hoping the market will come back.
3. How do breaker blocks help with liquidity understanding?
Breaker blocks highlight where liquidity has been taken from one side of the market. For example, when a bearish order block fails and becomes a bullish breaker, it shows that sellers were trapped and buyers are now in control. This reveals where stop orders were triggered and where new momentum emerged.
In this way, breaker blocks act as a visual map of institutional flows and retail liquidation. You can confirm these zones using the Buyside/Sellside Liquidity indicator, which provides liquidity data in real time.
4. How can you be sure you’ve identified a valid breaker block?
A valid breaker block isn’t just any old broken order block. It must meet a few key criteria to be considered a high-probability setup:
- Original Order Block: It must originate from a legit order block that started a strong price move.
- Liquidity Sweep: Before the break, there should be a clear liquidity sweep or fake-out that takes out a previous high or low. This traps retail traders and provides the fuel for the coming move.
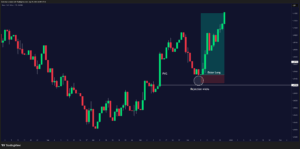
- Market Structure Shift (MSS): This is the most critical component. After the liquidity sweep, the price must make a strong, decisive move that breaks a key market structure high or low, signaling a clear shift in the trend. No MSS, no valid breaker block.
- Imbalance or Fair Value Gap (FVG): The move that creates the MSS should leave behind a price imbalance or FVG. This is a sign of a fast, efficient move by institutions and adds a layer of confirmation to the setup.
Zeiierman
With over 16 years in the market, Zeiierman has extensive experience as a full-time trader and risk advisory consultant for hedge funds. He has developed many profitable trading strategies, drawing on his background in risk management and strategy execution.
More from Zeiierman