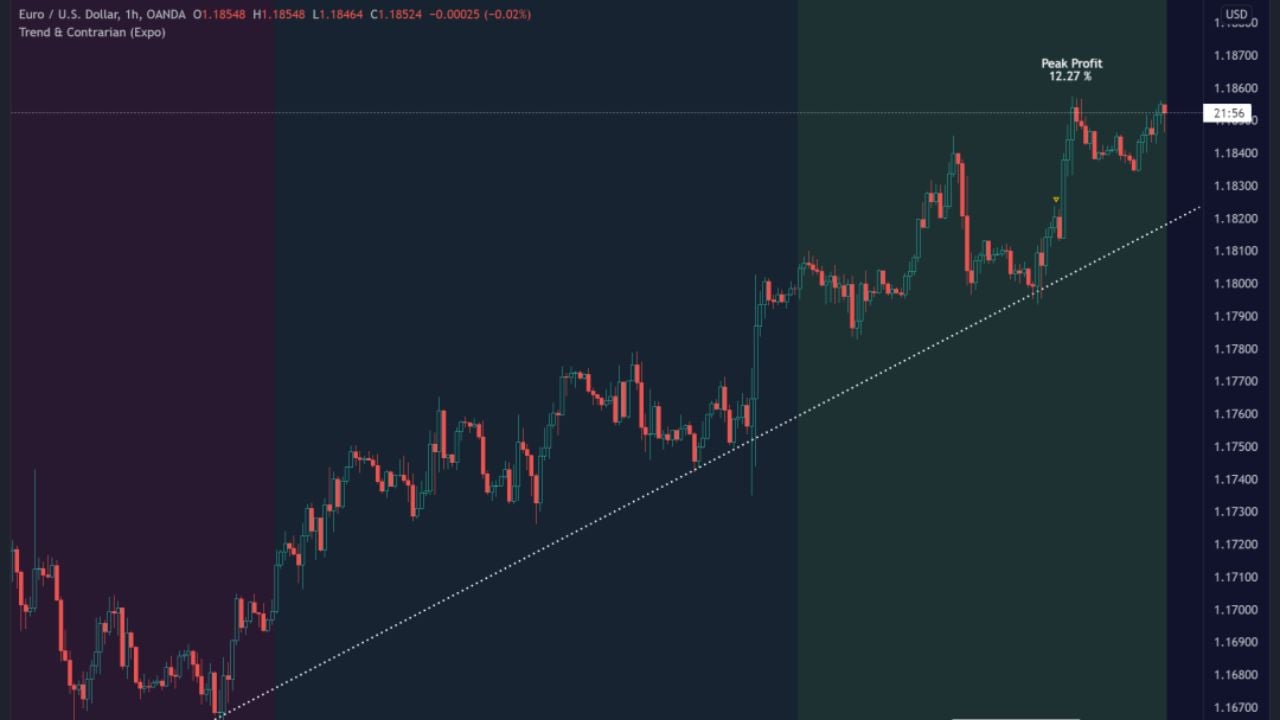
A strong trend is when the momentum and the price action correlates and creates a strong market force that breaks several support/resistance levels and makes higher highs (Bullish) or lower lows (Bearish).
To catch a strong trend can generate a few 100 pips or even a few 1000 pips. That is why Traders want to be able to trade in the same direction as a strong trend. Institutions are most likely active in pushing the price higher or lower in strong trends since they know how important it is to be on the right side of the trend. Read more about Institutional Trading.
How to Identify Strong Trends?
Strong trends can be identified in multiple ways, either with manual trend analysis or with the use of indicators. The use of indicators increases the likelihood that the strong trend is correct identified without any emotions involved. The trader is going to have a clear picture of when the market is in a strong trend and can easily apply trend strategies.
For traders that want to catch momentum breakouts within a strong trend are going to find the Momentum – Trend Strategy useful.
What about identifying the Start of a Trend?
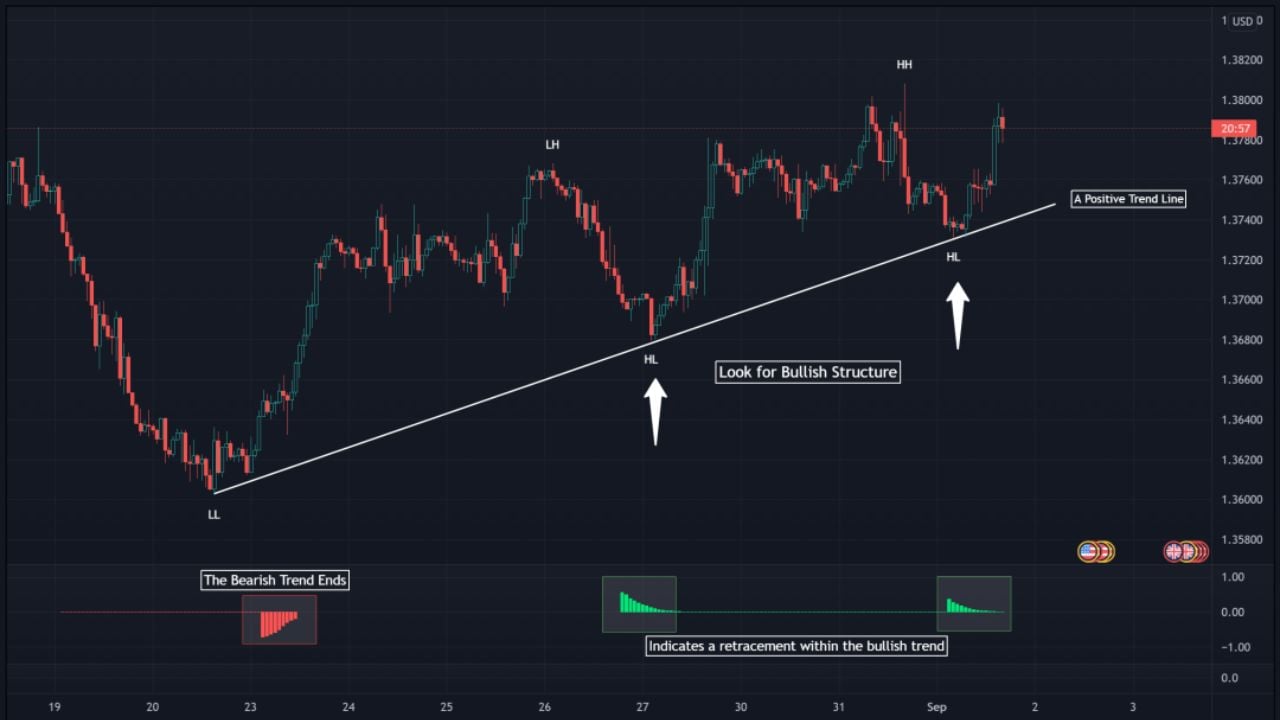
A strong trend occurs after a confirmed trend has been established. It can take some time before the strong trend establishes, therefore it’s good to be notified when the “normal” trend starts. We have developed an indicator that displays when a Trend- Start and Ends. Read more about the indicator here.
Top 5 Best Strong Trend Indicators
1. Trend & Contrarian
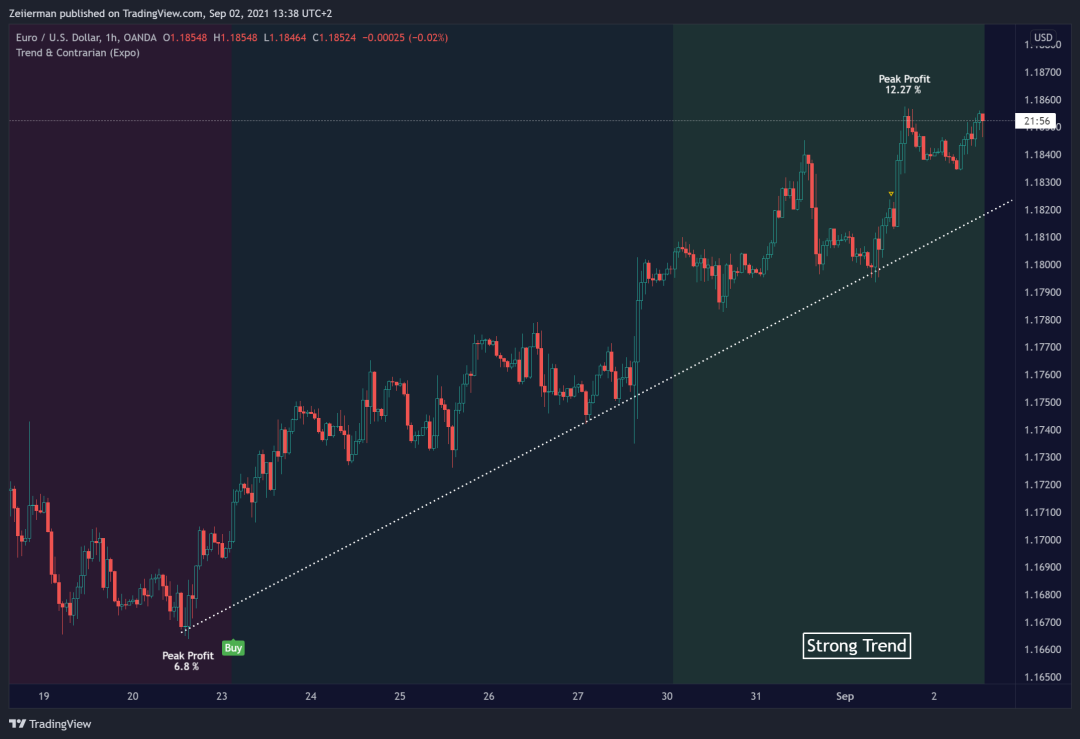
Trend & Contrarian displays both the short-term trend, long-term trend, and strong trends. This indicator is for everyone that wants to have a trend indicator with multiple features. The user can enable a Trend Projection Channel, Trend Tracker line, Buy/Sell signals, and Swing points.
2. Geometric Pattern
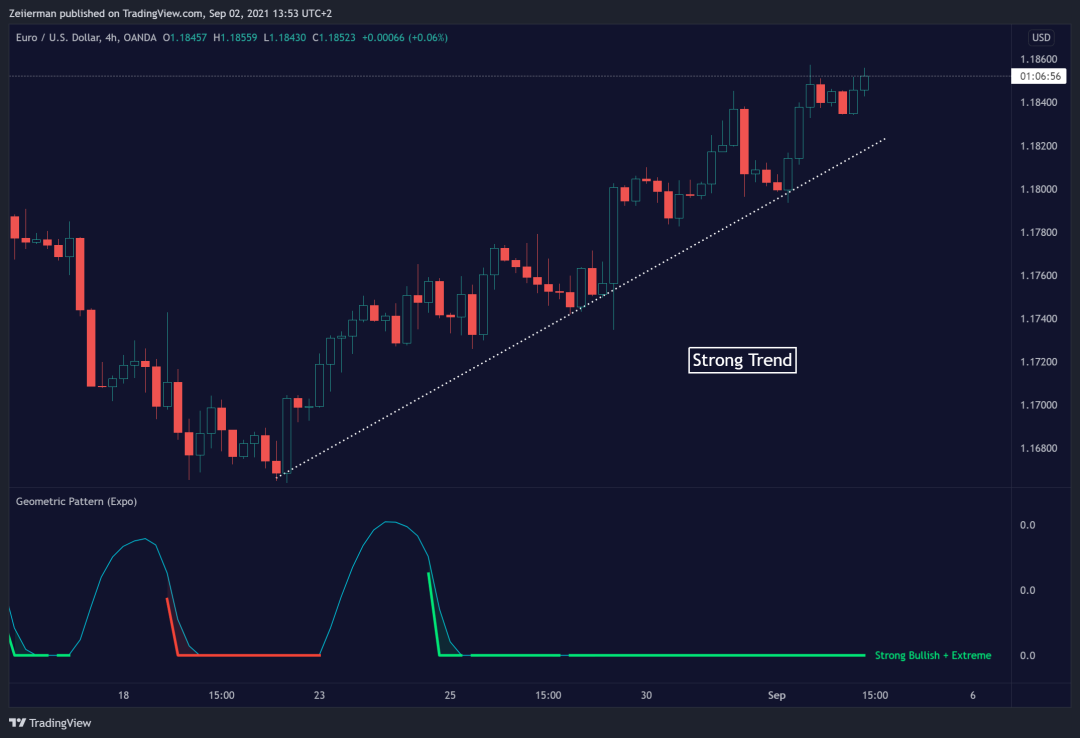
Geometric Pattern is a Strong Trend indicator that only shows extreme modes. This indicator is a masterpiece both for calling the End of a Strong trend and Continuation moves within Strong Trends.
3. Buy & Sell Order
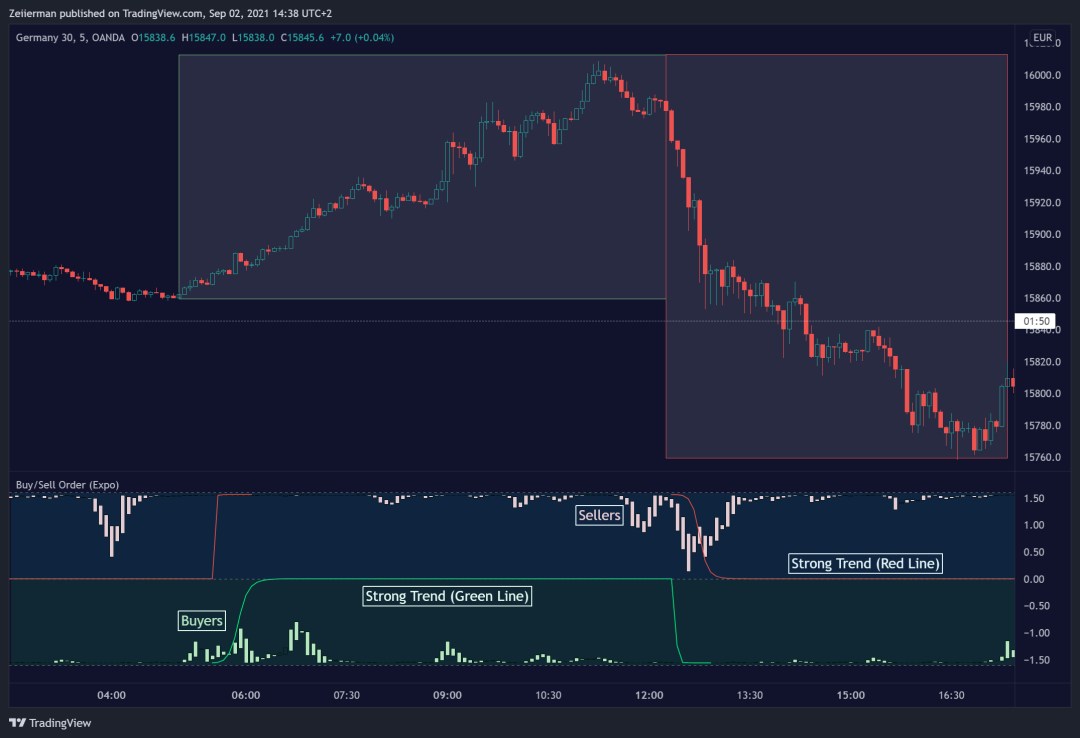
Buy & Sell Order is a trend tool that combines Buy/Sell Order insights. You gain insights about when a trend starts by seeing buying/selling pressure and if the market is entering a Strong Trend.
4. Momentum – Trend Strategy
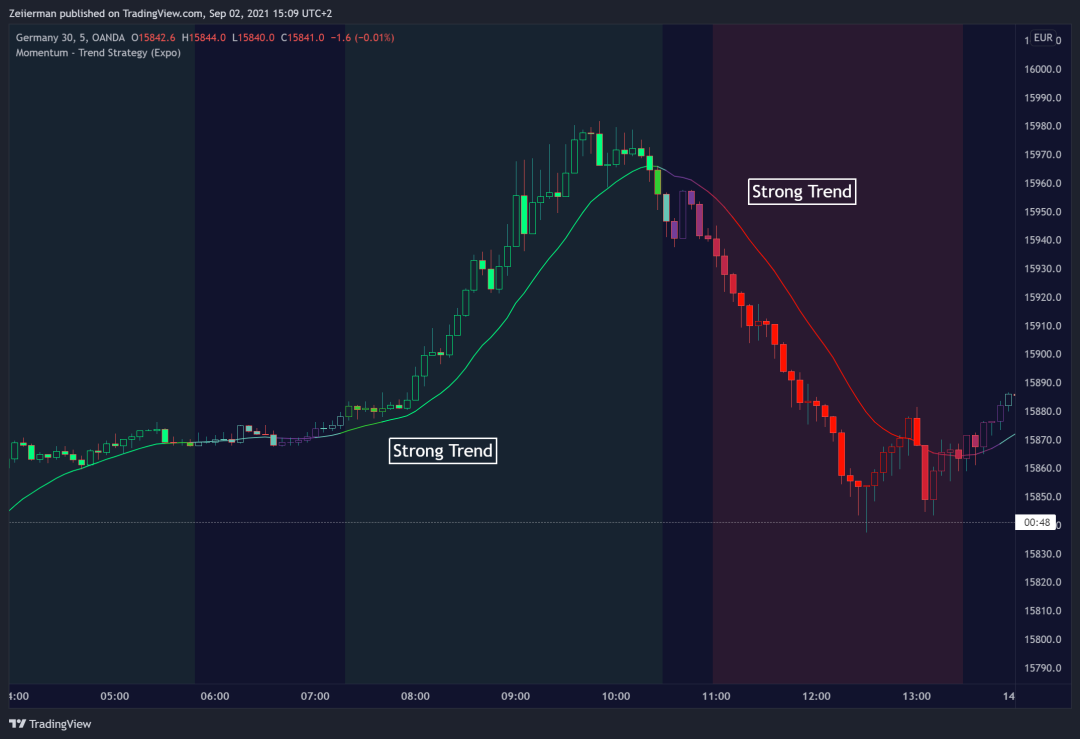
Momentum – Trend Strategy identifies momentum breakouts within strong trends. In addition to that, the user gets a clear understanding of the current market structure.
5. Onsens Trend Strength
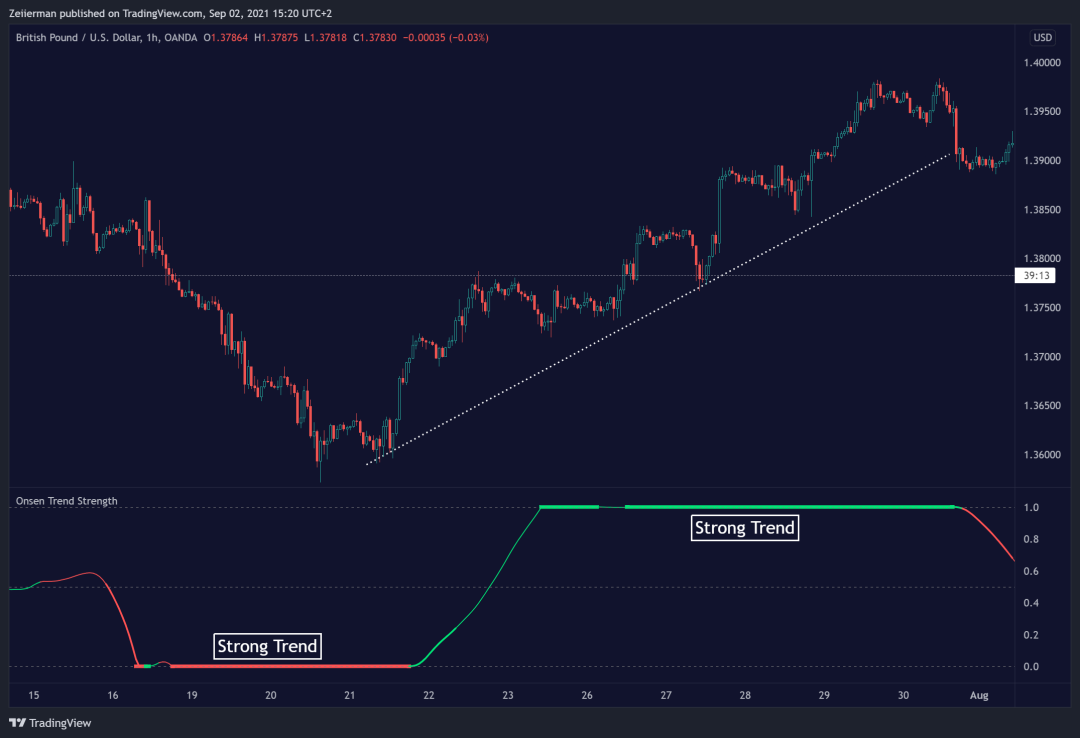
Onsen Trend Strength is a multi-timeframe price action indicator that can display both strong trends and reversals. Our Trader Onsens has his own suite of indicators.
6. Momentum Oscillator
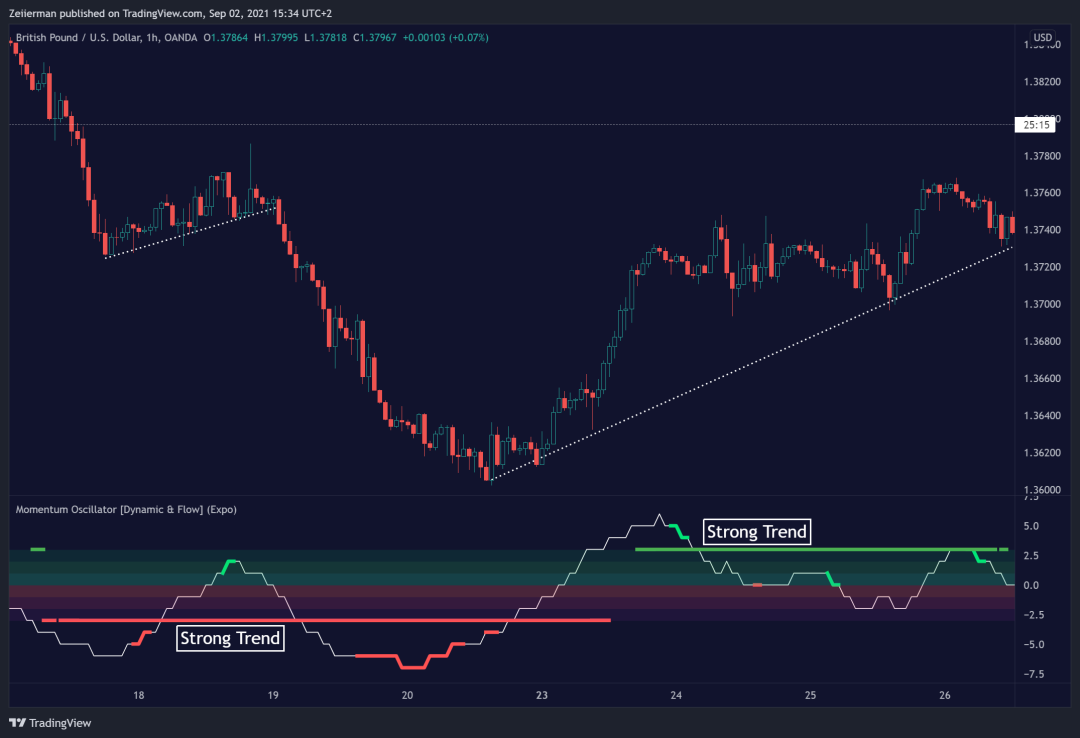
The Momentum Oscillator is an indicator that can be used in many strategies, one is to find retracements in strong trends.
