If you’re still trading like it’s 2010, you’re definitely not keeping up. Modern markets move at light speed, handling literal millions of data points per second.
I know that buzzwords like “indicators” and “artificial intelligence” are thrown around a lot but they do hold some merit when used correctly. AI is undeniably reshaping the trading landscape. You’re probably falling behind by relying solely on instinct or traditional chart patterns.
Why? Because markets now are faster, more complex, and need some experimentation with AI to gain an edge. Of course, it doesn’t have to replace your existing strategy. Our vision with the Zeiierman Trading members is to enhance your strategy instead.
In this guide, I’ll walk through how AI actually works in trading, what tools you can use, where most traders get it wrong, and how Zeiierman fits into an AI-powered strategy. You’ll walk away with real workflows you can apply, without any fluff or unearned hype.
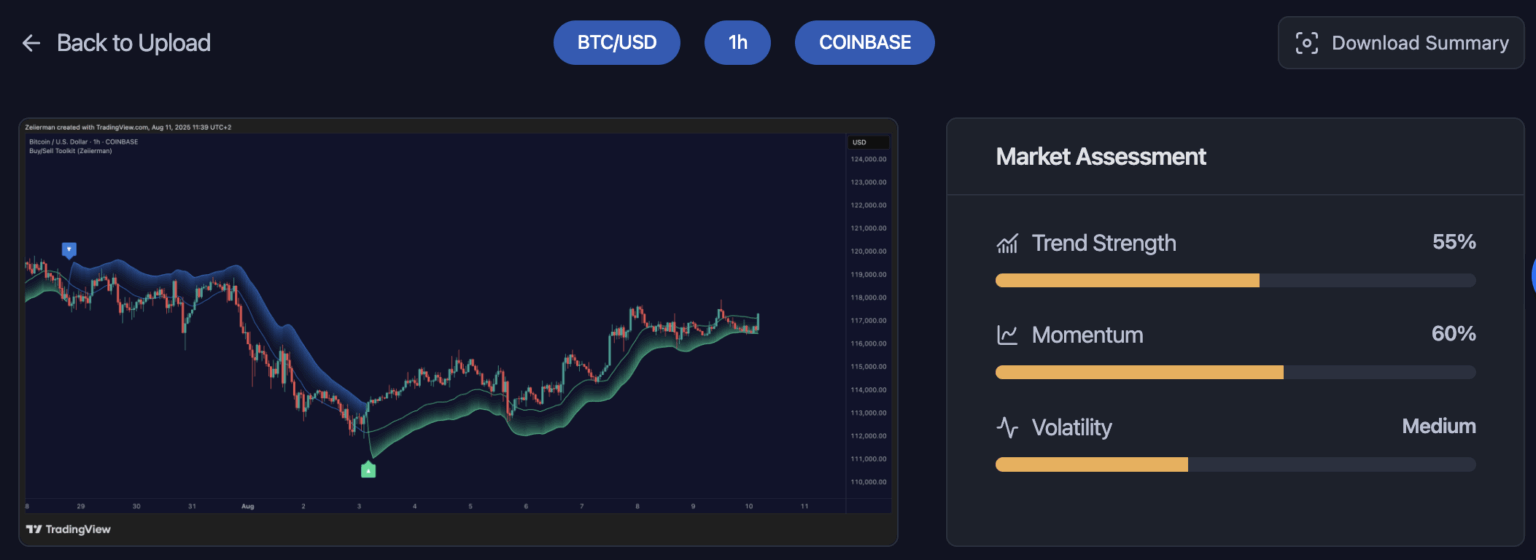
Note: Shortly after the publishing of this article, we launched our own AI Chart Analyzer.
1. How does AI work in the trading context?
Think of AI as your incredibly smart trading assistant who doesn’t sleep or get emotional, and can process information faster than you and I can blink. Unlike traditional programming, where you tell a computer exactly what to do, machine learning algorithms actually learn from data and improve their performance over time.
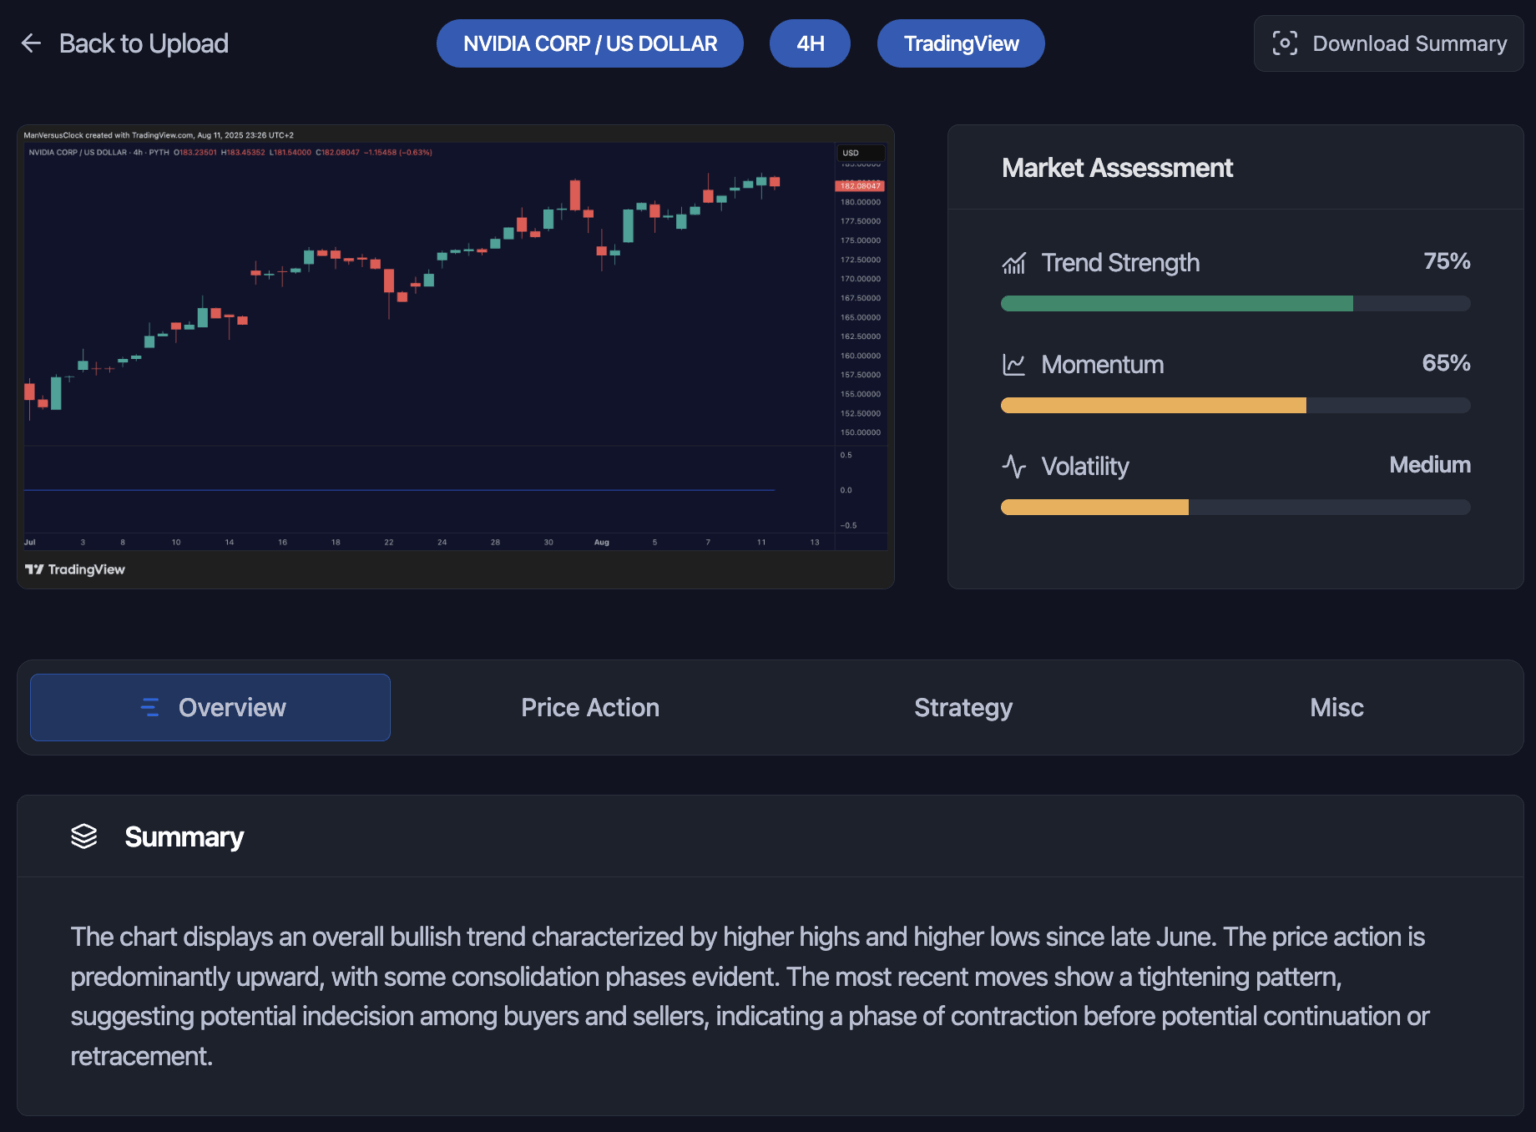
And this is what gets us the most excited at Zeiierman Trading: AI excels at pattern recognition. While you might spot a head-and-shoulders pattern on a single chart, AI can simultaneously analyse thousands of stocks across multiple timeframes, identifying patterns you’d never catch with your naked eye. It’s like having X-ray vision for market data.
But let’s get one thing straight: AI isn’t magic. It’s about pattern catching and prediction. At its core, AI learns in trading by using logic to identify relationships between data (such as price, volume, or sentiment) and outcomes (like future price direction). Quality data is equal to quality signals, but neither equals quality results without educated supervision.
Here’s how it works:
- Data Ingestion: Big data input like historical price data, indicators, news, social media, etc.
- Feature Engineering: Creating measurable parameters like moving averages, RSI values, or sentiment scores.
- Model Training: Using algorithms (e.g., neural networks, decision trees) to recognise patterns and make predictions.
- Signal Output: Buy/sell alerts, confidence levels, or risk estimates.
2. Core Applications of AI in Trading
A. Signal Generation
This is where AI transforms traditional technical analysis. Your favourite indicators, moving averages, RSI, and MACD, can be supercharged with AI to reduce false signals and improve timing. AI is really adept at spotting setups that we may miss. Within a few seconds, a properly constructed AI tool can analyse thousands of data points and generate signals to identify trend change, breakouts, mean reversals, volatile spikes, and much more.
B. Risk Management
Here’s where AI can become your financial bodyguard. You can train and use AI models to automatically adjust your trade sizes based on current market volatility and your risk appetite. When markets become choppy, your position sizes tend to shrink. When conditions are favourable, they expand.
These automated stop-losses might be the most valuable feature for active traders. It’s like having a professional risk manager watching every trade. More importantly, AI can continuously monitor correlations between your holdings and alert you when your “diversified” portfolio begins to move in a similar way.
Read: Do You Really Need Technical Indicators to Succeed in Trading?C. Portfolio Optimisation
Building a winning portfolio isn’t just about picking the “good” assets. It’s about creating the right mix of assets that work well together and adjust as the market changes. The markets are not static. Instead, they are noisy, nonlinear, and full of confluences.
AI-driven portfolio optimisation doesn’t just calculate returns and risk. It learns from data and adjusts smartly. You can use Zeiierman’s macro signals, like Institutional Activity Indicators or Volume Profile Zones, in your optimisation model as primary inputs.
D. Predictive Analytics and Forecasting
This is where AI truly shines for long-term individual traders. Machine learning models can filter through historical price data, spot patterns that keep popping up, and even give you a sense of where prices might head next. It’s almost like having a stock weather forecast.
Then there’s market sentiment analysis, which examines data from news articles, social media posts, and financial reports to gauge the market’s mood. If AI detects a significant amount of negative chatter about a stock, that could be a hint for traders looking to short/buy when others are feeling pessimistic.
And let’s not forget about economic analysis. AI can uncover connections between seemingly unrelated economic data points and predict how they might impact specific markets. For example, it might find that shifts in copper prices can hint at tech stock movements a couple of weeks in advance.
In the end, while the market runs on money rather than just numbers, AI can help point you towards where that money might be flowing next.
3. How to build your AI-enhanced trading strategy?
Okay, let’s shift gears from theory to real-world application. Creating an AI-driven strategy might sound a bit too much in the beginning, but you’ll be surprised as we go through each step. You don’t need a supercomputer or a fancy Wall Street team to get started. Instead, all that’s required is a solid process / logic.
Here’s a straightforward framework to help you build your very first AI-enhanced trading system, with the Zeiierman indicators thrown in for good measure.
Step 1: Define your trading approach and goals.
I usually start by setting some clear objectives first. Are you aiming for a consistent income or significant growth? Your risk appetite will largely determine all your decisions here. More cautious traders may use AI to fine-tune their portfolios and manage risk, while those with a higher risk appetite may opt for faster trades and higher frequency.
When it comes to your AI approach, you’ve got a few options:
- Fully automated systems handle everything from signal generation to executing trades. They cut out the emotional side of trading, but they need extensive testing to get it right.
- Semi-automated systems mix AI-driven signals with human judgment, so you can enjoy the benefits of AI’s pattern recognition along with good old human intuition.
- If you want something simpler, you can enhance your existing strategies with AI-powered indicators instead of diving into the deep water of complex algorithms.
- Finally, there’s the hybrid approach, where AI helps with research and analysis but leaves the actual trade execution in your hands. Here, your AI tool acts as a research assistant, highlighting potential opportunities and risks.
Your best route really depends on your trading goals, risk appetite, and comfort level with letting AI dictate your trading.
Read: How to use Zeiierman’s AI Chart Analyzer?Step 2: Collect data and prepare strategy.
Quality data is the spine of your AI trading strategy. You’ll need historical price data, volume information, and other data sources, such as news sentiment and social media activity.
No data = no model. And bad data = bad model. Your data inputs are everything.
You can streamline this by using Zeiierman Indicators:
- Institutional Activity: Detects smart money inflows.
- Smart Money Concepts: Flags liquidity grabs, engineered breakouts, traps.
- Volume Profile Zones: Shows high-importance price levels.
Step 3: Select the right tools and AI model.
I recommend using the TradingView platform to practice trading with AI. The Pine Script editor and strategy will be the main components of your AI trading strategy. First, select the technical indicator you prefer and are familiar with.
Let’s consider the Basic Daily Moving Average as our base indicator. You can access the source code of the indicator and feed it into the AI model. You can choose any model, such as ChatGPT, Claude, or Deepseek, etc. Once you paste the code into the chat, add a specific prompt explaining the capital size, entry, exit, risk measures, and any additional features you want to add to the signal. Ask to convert it into a Trading View strategy in the prompt.
The model will provide you with a Pine Script. Simply paste it into the Pine editor option in TradingView. This is where AI saves you hours (or days).
Step 4: Test and tweak in TradingView.
Now it’s time to see how your idea performs. Open the Pine Script editor in TradingView, paste in your AI-generated code, and hit Add to Chart. Remember, you have to go back to the chart and visualise this constantly:
- Does the strategy trigger entries and exits correctly?
- Is the logic working as you thought?
- How does it perform on different timeframes?
- Are there too many signals? Too few?
Make tweaks as needed. For example, want to filter out low-volume trades?
Ask the AI: “Add a volume filter to only trade when volume is above the 20-period average.”
Want tighter stops? Change the trailing stop value or convert it into a fixed stop-loss.
This back-and-forth refining is key. Don’t settle for a half-working strategy. Push it to the point where it starts making sense both logically and statistically.
Step 5: Go live and optimise over time.
I recommend that you work up the strategy in paper trading first without risking huge money. Once you’ve paper-tested and built confidence in your setup, you can start going live, slowly. Here’s how to roll it out without blowing up your account:
- Start small: Trade micro lots or the smallest position size possible.
- Track performance daily:Keep a log of every trade, not just the P&L, but also why the trade was triggered and how it performed.
- Keep refining: Markets change, and so should your strategy.
And if you’re using smart indicators, such as Zeiierman’s Institutional Activity, Volume Profile Zones, or Smart Money Concepts, you can feed those directly into your strategy. We use them as trade filters, confirmation tools, exit conditions, and more.
Read: How Focus Leads to Success: Overcoming The Common Struggle in Trading📌 Even the best AI logic falls flat without quality signals. Zeiierman indicators help your strategy stay aligned with what actually matters: where real money is flowing.
4. Common Pitfalls When Using AI in Trading
1. Overfitting to Backtest Results
Overfitting occurs when your AI strategy is overly reliant on the historical data it was trained on or tested on. It learns to “win the past” but falls short in the future. To fix it, I use data that hasn’t been used in the strategy, limit the number of optimised variables, and also avoid tweaking a strategy based solely on results.
2. Treating AI as a Black Box
Many traders blindly trust AI outputs because they sound smart. But if you don’t understand why a trade is being taken, you’re flying blind. When you don’t understand how your system makes decisions, you can’t identify when it’s about to fail. Always maintain some understanding of your AI’s decision-making process. You can simply use the model to add logs or print statements to show why a trade happened.
3. Poor Data Quality or Incomplete Inputs
If you put in bad data, you’re going to get bad results. Yes, it’s that simple. AI models rely completely on the data they’re trained with. So, if your data is messy, outdated, or simply irrelevant, your strategy is likely to fail, regardless of how advanced your model is. The key is to provide your system with high-quality signals, such as Zeiierman’s Institutional Activity Indicator or Smart Money Concepts. This way, your AI can learn from the movements of big money players, rather than just following basic trend lines or momentum tools.
4. No Built-In Risk Management
Having a great strategy is important, but without good risk management, you could lose everything with just one wrong slip-up. Remember, AI isn’t there to manage all the risks; it’s your job to keep a lookout. You need to set clear guidelines for yourself: determine your maximum drawdowns, adjust position sizes based on market conditions, have exit strategies tied to volatility, and consider structure-based stops using Zeiierman’s Volume Zones to safeguard your wallet.
5. Failing to Retrain or Adapt Over Time
As I mentioned earlier, you must continue refining the features and prompts, and don’t overlook the new patterns emerging in live markets. AI models require periodic tuning to remain effective. You need to re-edit the strategy script using the model with recent data, especially after major events or shifts in volatility.
Frequently Asked Questions (FAQs)
1. Can AI predict the market with 100% accuracy?
Artificial Intelligence (AI) cannot predict market movements with 100% accuracy. In fact, any platform or person that claims to be 100% accurate is either misinformed or misleading you. Markets are influenced by economic data, news events, institutional order flow, and human psychology.
AI is great at finding patterns in data and identifying statistical edges, but it’s not omniscient. The goal is not perfect prediction, but consistent probability-based decision-making.
2. How can you make sure an AI-driven strategy is solid before you launch it?
To truly validate our strategy, we follow a multi-step process.
Start by backtesting against historical data using a reliable testing tool, such as TradingView’s strategy tester or Backtrader. Next, proceed to forward-test with new data to determine if it overfits. The final step is to try paper trading it in real-time. Keep an eye on how the alerts work, how signals get triggered, and whether the execution meets your expectations.
My advice? It’s absolutely important to log every trade and decision made along the way. This real-time validation helps you spot problems such as delayed alerts, false positives, or instances where your model wasn’t ready.
3. Can I combine different indicators in my AI model, or is that too much?
Using various indicators can provide your model with multiple perspectives on the market. However, it’s also important to find a balance. If you overload your model with too many indicators, especially those that overlap, such as RSI, Stochastic, and MACD, you might end up sending conflicting or repeated signals.
Ideally, you want to give your AI unique, high-value data prompts. For instance, combining price action, volume structure, and institutional activity (Zeiierman) can create a well-rounded view. Keep your features straightforward and evaluate how each one adds value before complicating things further.
