If you take trading seriously, you must know the difference between guessing and having a plan.
Zeiierman’s AI Chart Analyzer gives you something closer to the plan: a structured, data-driven readout of any chart you upload. This way, you can make fast and clear decisions. If you use it right, it can give you the right edge to be on the winning side of the trade.
In this guide, I will walk you through a practical and tested approach for maximising the profit from the AI Chart Analyzer we have created after months of testing and years of experience. You’ll get exact workflows, pairing rules with other Zeiierman indicators, risk management, and tips on common mistakes to avoid while using the AI Chart Analyzer.
Let’s get to it.
1. What the AI Chart Analyzer tells you
Zeiierman’s AI Chart Analyzer is a next-generation tool that reads your charts, identifies patterns, and delivers technical insights in real-time. It evaluates trend strength, momentum, volatility, and other important factors to generate actionable analysis in multiple sections.
Read: Build an AI-Enhanced Trading Strategy (Step by Step)You just have to upload a clear, uncluttered chart image, and in seconds, it gives a detailed analysis divided into the following sections:
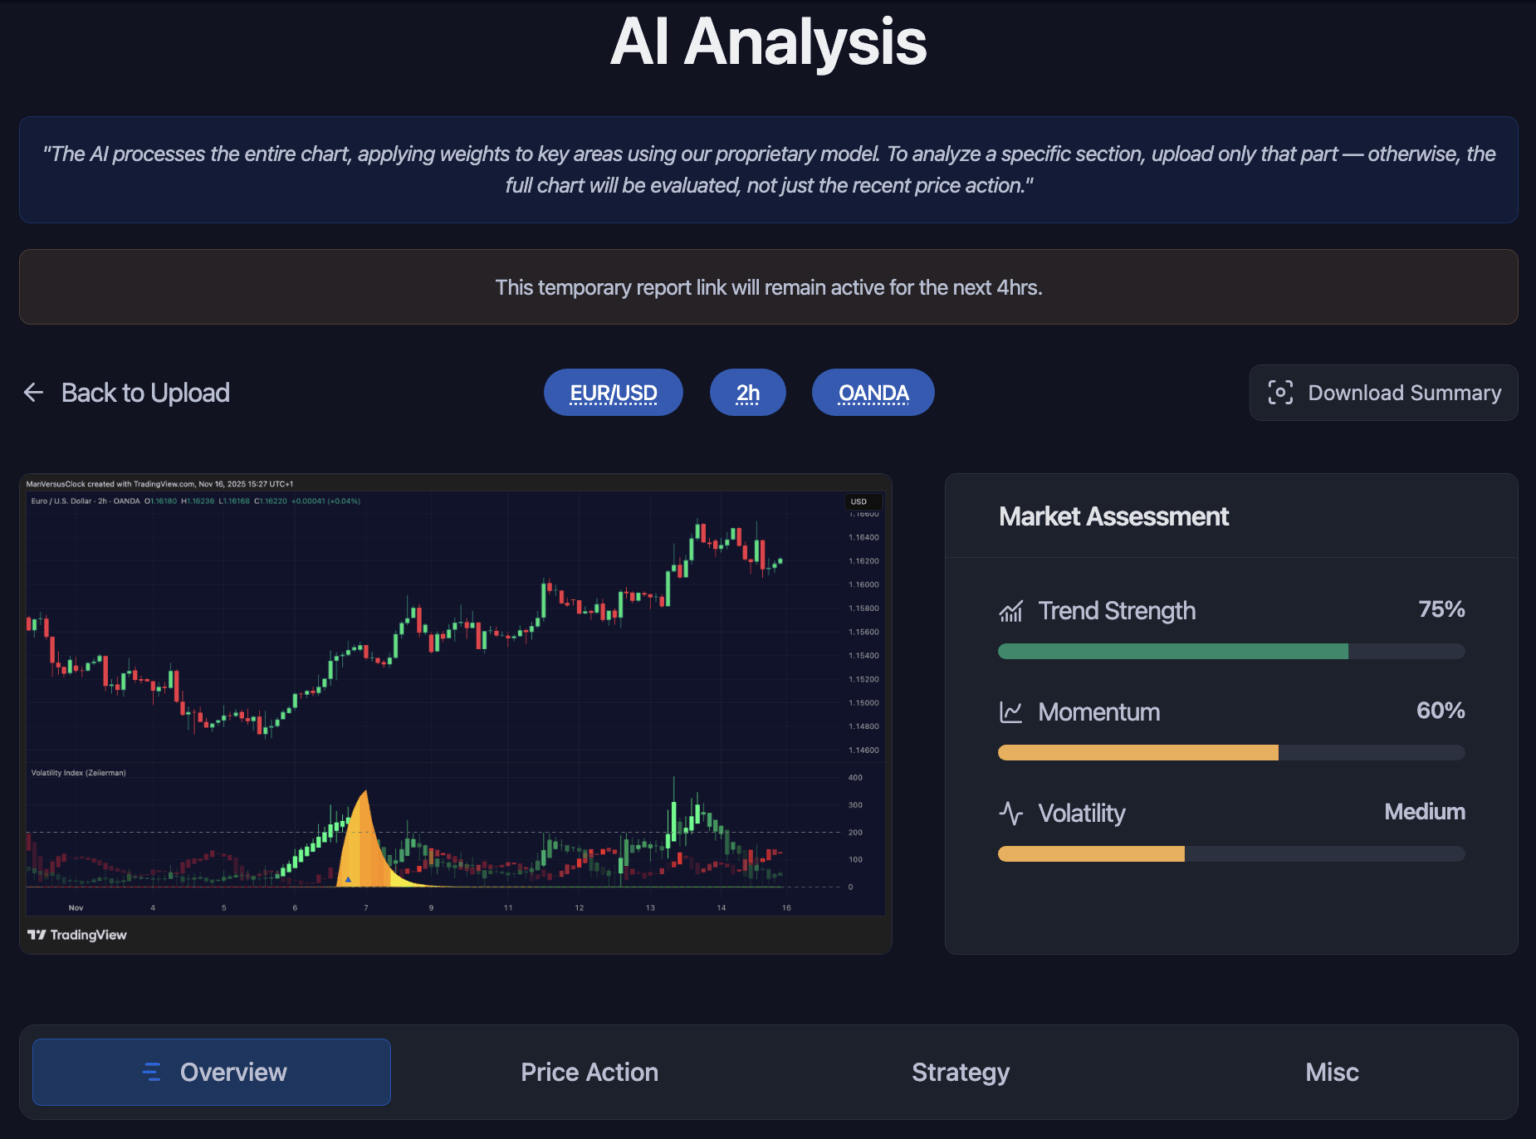
- Market Assessment: Quantifies the trend strength, momentum, and volatility to provide a better understanding of the direction of price action, the persistence of price movement, and the stability of the market.
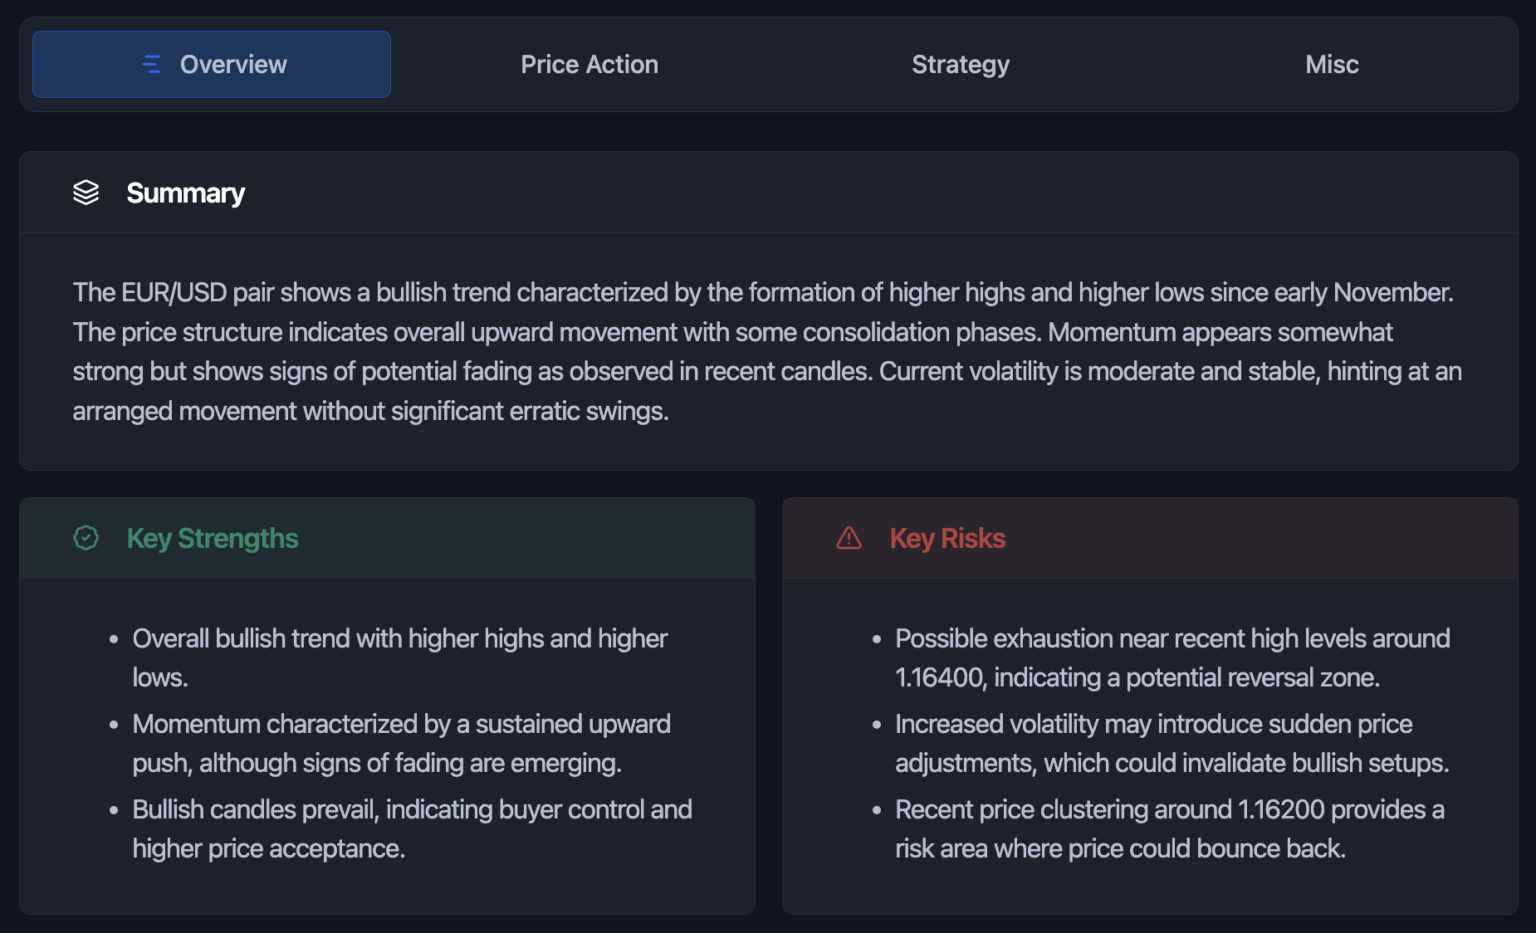
- Overview: This section provides a comprehensive overview, highlighting the big picture, including a bullish or bearish bias, key opportunities, and notable risks.
- Price Action: Identifies support and resistance levels, breakout and breakdown zones, and key patterns.
- Strategy: Gives trade directions, entry triggers, and exit points based on the chart’s conditions. This is the base of the trade plan.
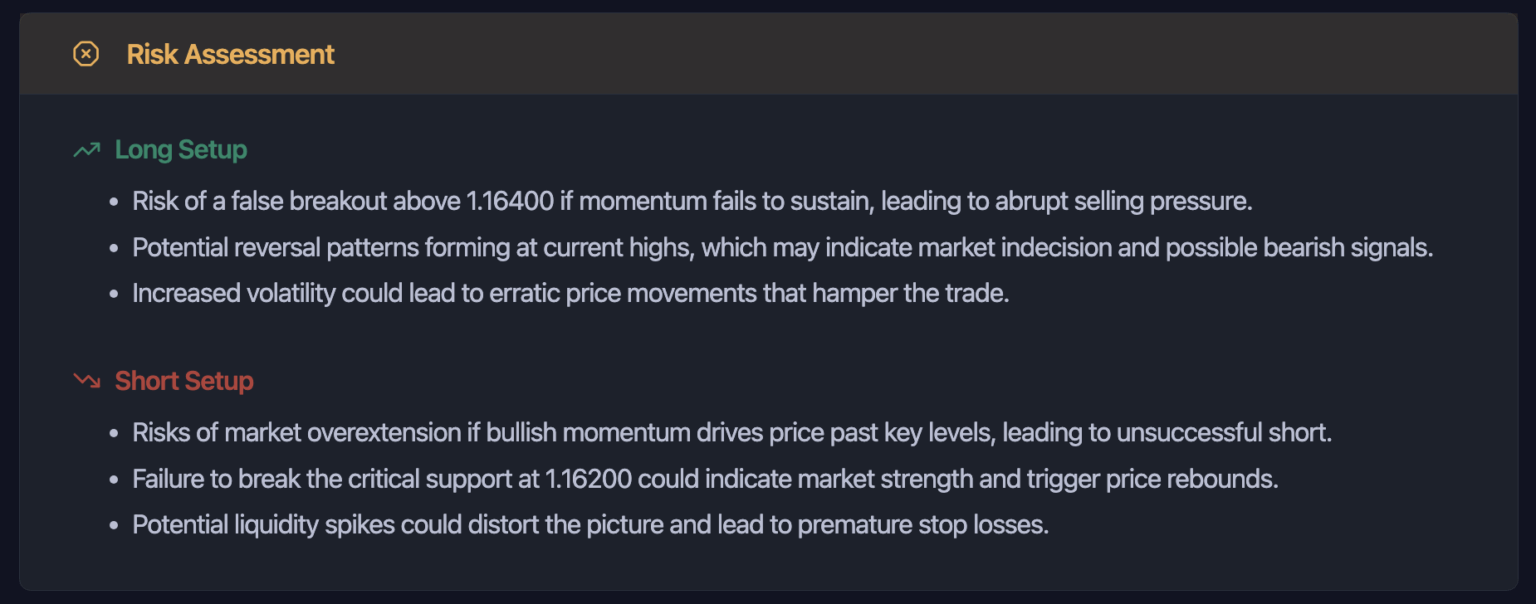
- Risk Assessment: Lists factors that could work against your trade and suggests stop-loss placement and profit-taking zones.
- Miscellaneous Insights: Flags liquidity zones, fair value gaps (FVGs), exhaustion wicks, and other advanced market signs.
Remember, it’s not an almighty signal generator, so you still make the final call. However, it provides the structure and clarity that you need in a market where most traders rely on gut feelings.
2. How to assess the AI output to make Strategies
You should start by uploading a clean chart image. Download the chart with good image quality directly from TradingView or any other charting platform you may use. Generally speaking, try not to take a screenshot. Make sure your chart is uncluttered with only the necessary indicators for your optimal setup.
If you need multi-timeframe context, upload three separate charts, one per timeframe, and treat each output as a piece of a bigger puzzle. Go from a higher frame to a lower timeframe.
Finally, standardise your chart layout. Use consistent timeframes, scales, and session times so the Analyzer doesn’t give you uneven outputs from similar setups.
B. Build Hard Filters with Market Assessment and Overview
The Market Assessment is the output’s cover page, which indicates the trend strength, momentum, and volatility. Here is how to see if there is a trading condition based on the outcome:
- When you see a strong trend (above 80) and strong momentum (above 70), you must gear up for entries that go with the current trend.
- If you see a weak trend (below 40) and high volatility (above 60), you can choose to scalp with caution or stay out for a moment.
- When the assessment shows low momentum (below 50) and low volatility (below 50), it usually means the price is consolidating, so you can play cautiously in the range or just wait for a breakout.
Furthermore, in the Overview, the AI Chart Analyzer lists key strengths and key risks. Use those points as your trade filters. For example:
- If the Key Strength is “higher lows above support,” only take longs above the most recent swing low.
- If the Key Risk is “overhead supply cluster,” avoid chasing breakouts that step into that zone.
C. Map the Price Action on Your Setup
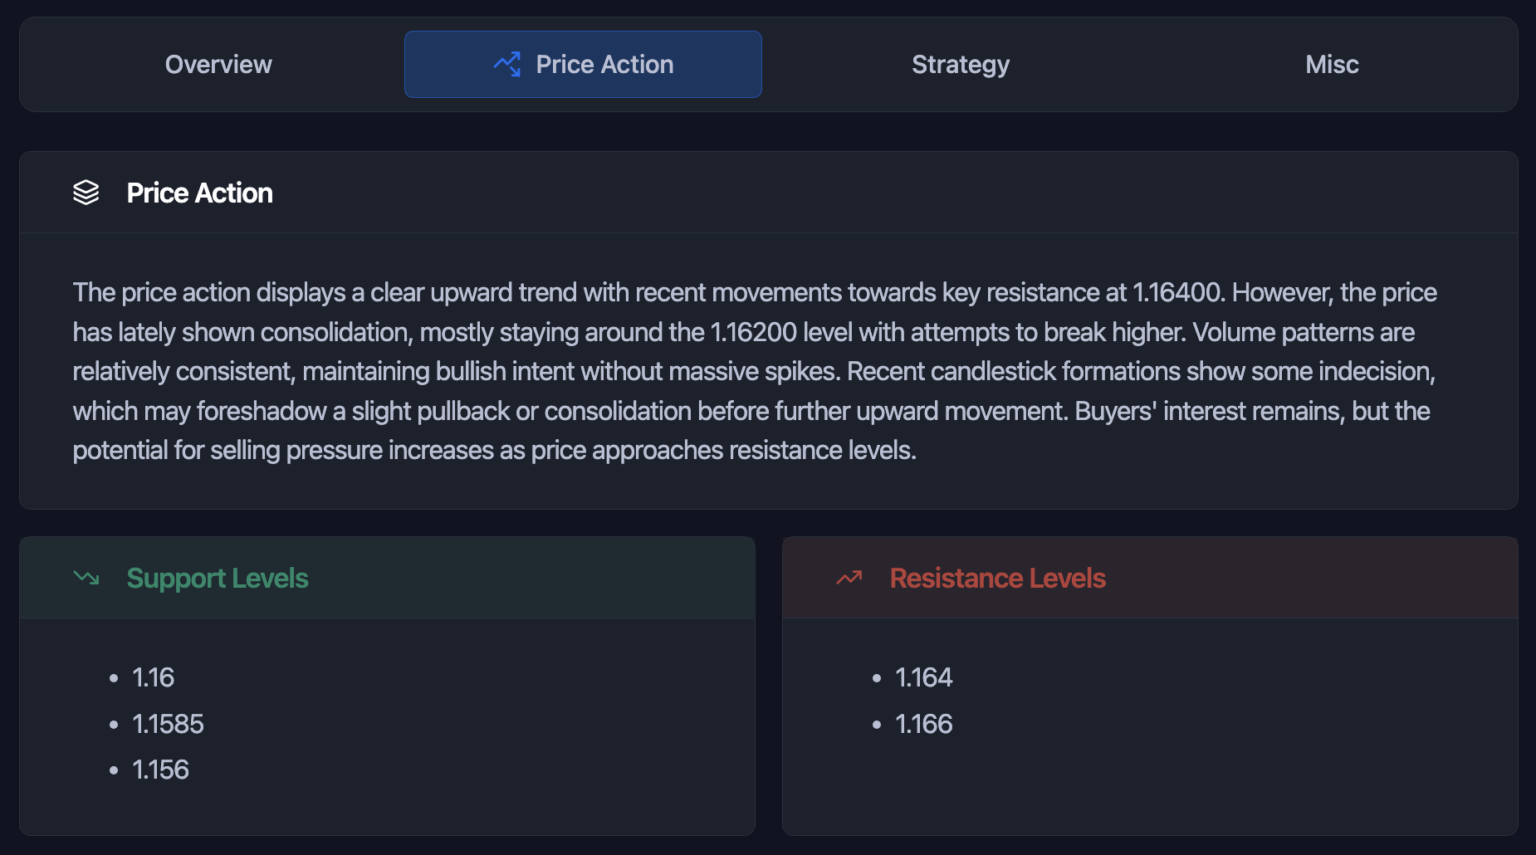
The price action section is where you find S/R levels, breakout zones, and pattern edges. Mark these on your live chart. Let me give an example of a Confluence setup:
The AI Chart Analyzer marks a potential breakout at 105. You can add two more checks: Volume SuperTrend shows trend confirmation, and an order block lies just below 102. Entry at 106 on cleared breakout, stop below order block, then scale into position.
Don’t worry, we’ll get to specific pairings very soon.
D. Strategy Output and Risk Assessment
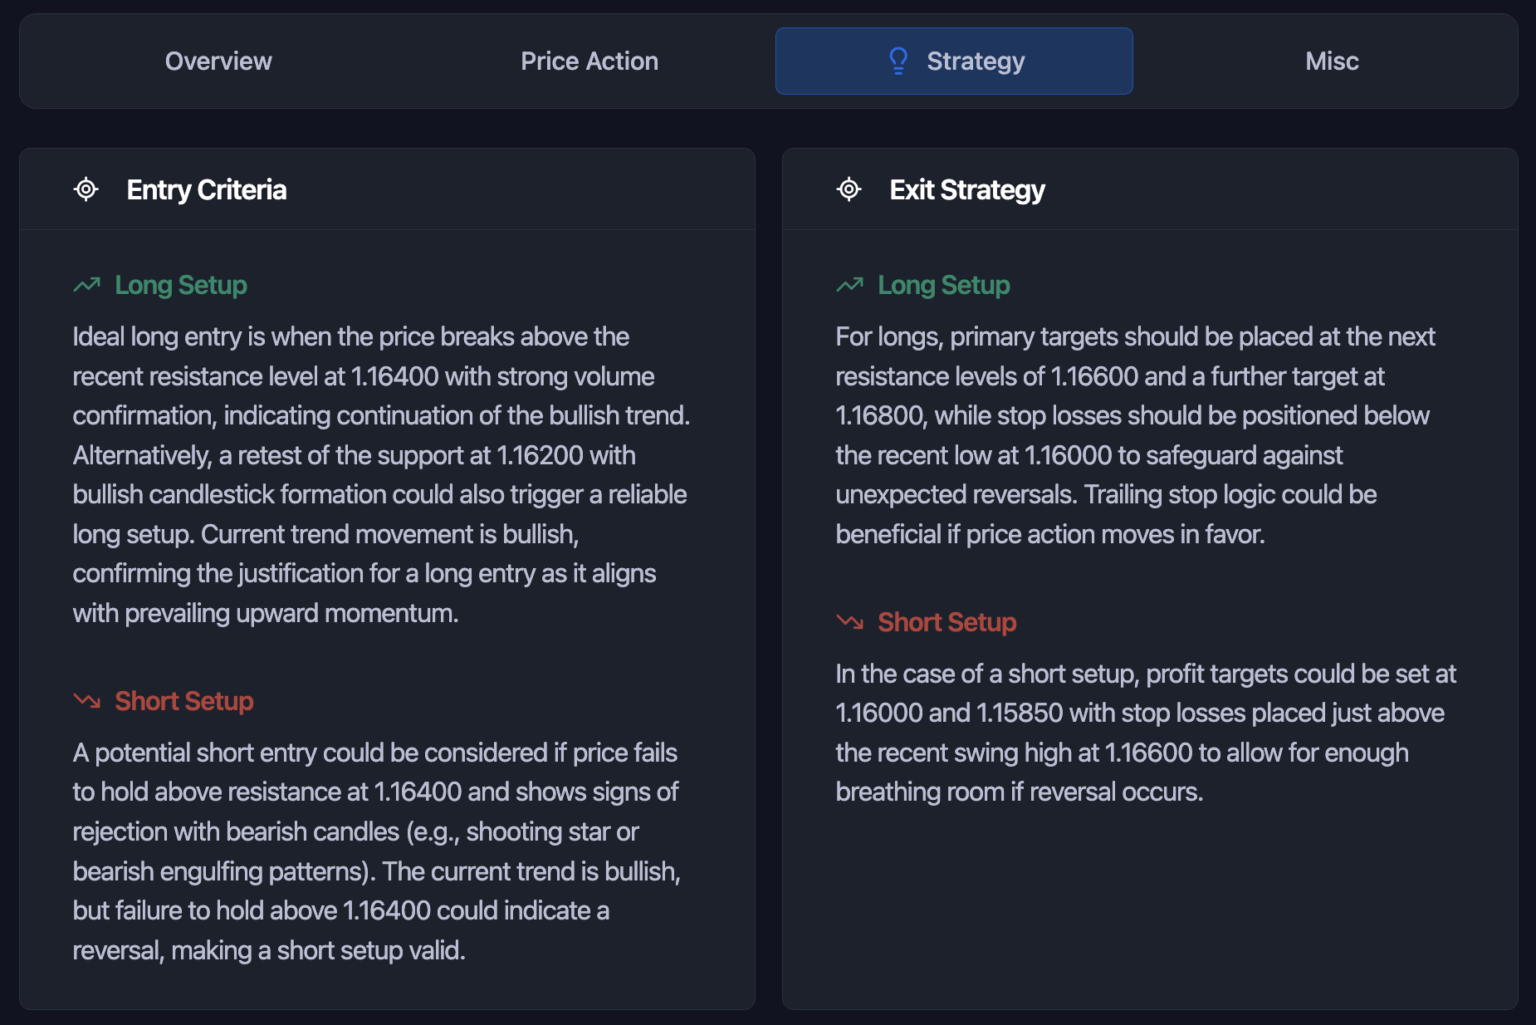
Follow the strategy section as a framework, rather than a full-blown setup. It suggests entries, stops, and targets.
Risk assessment may be the most important section in the analysis output, as it is what prevents you from blowing up after one bad move. This section suggests position sizing and stop placement zones and shows where the trade idea may fail.
- If it shows a conservative target, that’s often due to nearby resistance and support. You can scale out profits instead of going all-in on a single TP.
- If suggested stops are tight, reduce the size to avoid your stop loss being triggered by market noise or volatility.
- If suggested stops are wide, cut the position size and consider scaling in.
📌 Tip: Always calculate risk per trade (1% to 2% of your account) and commit to no more than that unless you have any other solid reason.
If you want to learn more about our AI Chart Analyzer, you can read that in our documentation.
Read: How to use Zeiierman’s AI Chart Analyzer?3. Using the AI Chart Analyzer with Chart Indicators
Using the Analyzer alone gives you clarity, but pairing it with an indicator (ours if you’d like) can help you stack the odds even better and maximize your profit.
Pairing 1: Volume SuperTrend AI
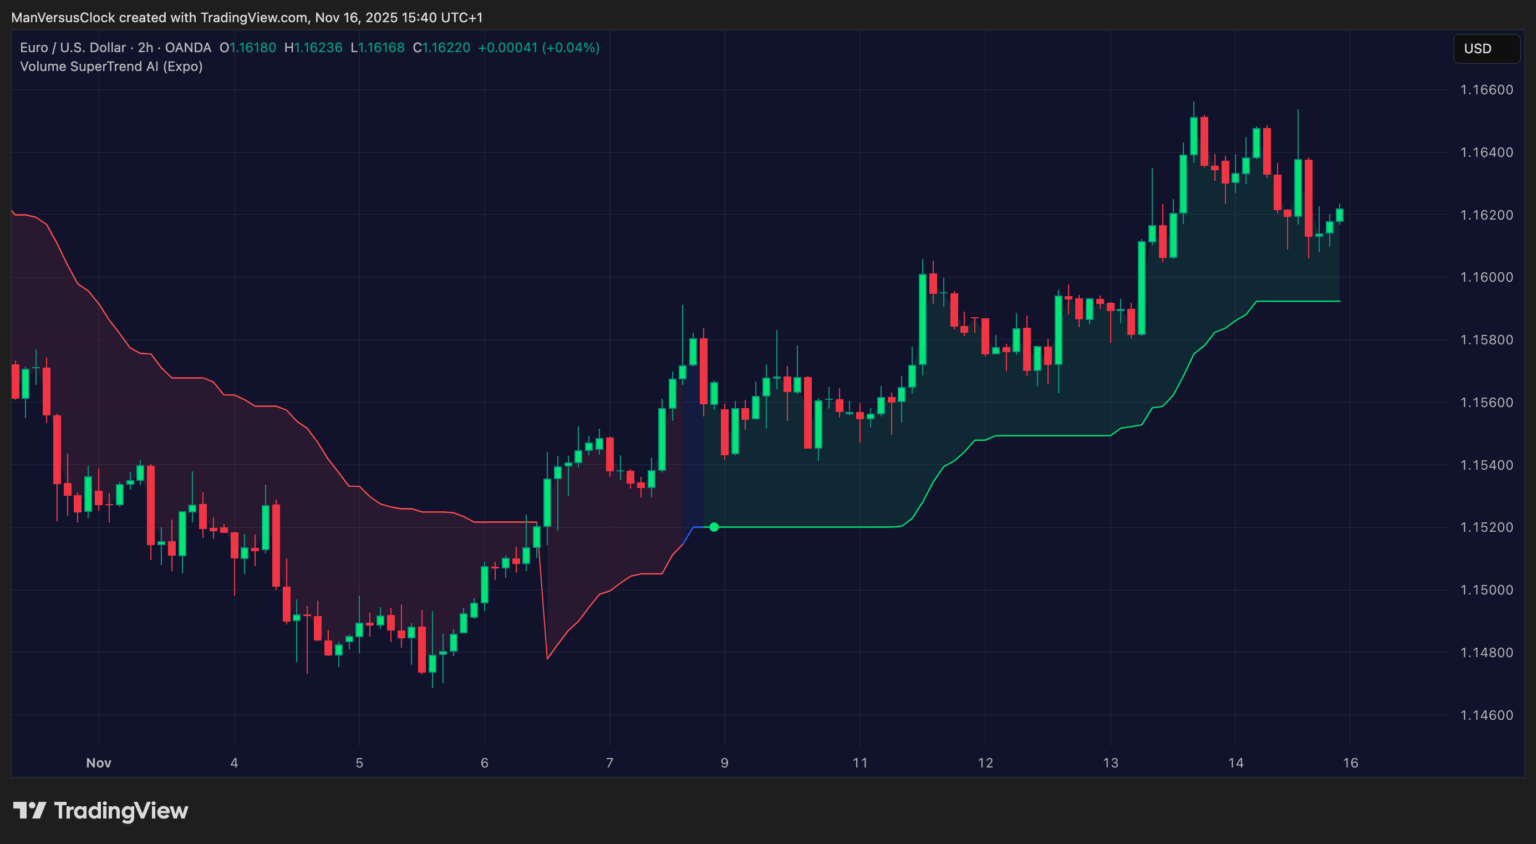
Volume SuperTrend AI mixes volume and trend detection. It responds to recent market changes, which is why it provides more accurate trend continuation signals. Additionally, when the Analyzer flags good trend momentum, this indicator helps you adjust your stops as the price moves. Here’s how to use it:
- Entry: After the Analyzer suggests a trend-following entry (strong trend and momentum), wait for Volume SuperTrend to show the same direction (green for long, red for short).
- Initial stop: Use the AI Chart Analyzer’s suggested stop or just keep it below the recent swing.
- Trailing Exit: Use the Volume SuperTrend line to trail your stop. Then, if the color flips, start locking in profits and exiting.
Pairing 2: Smart Money Concept
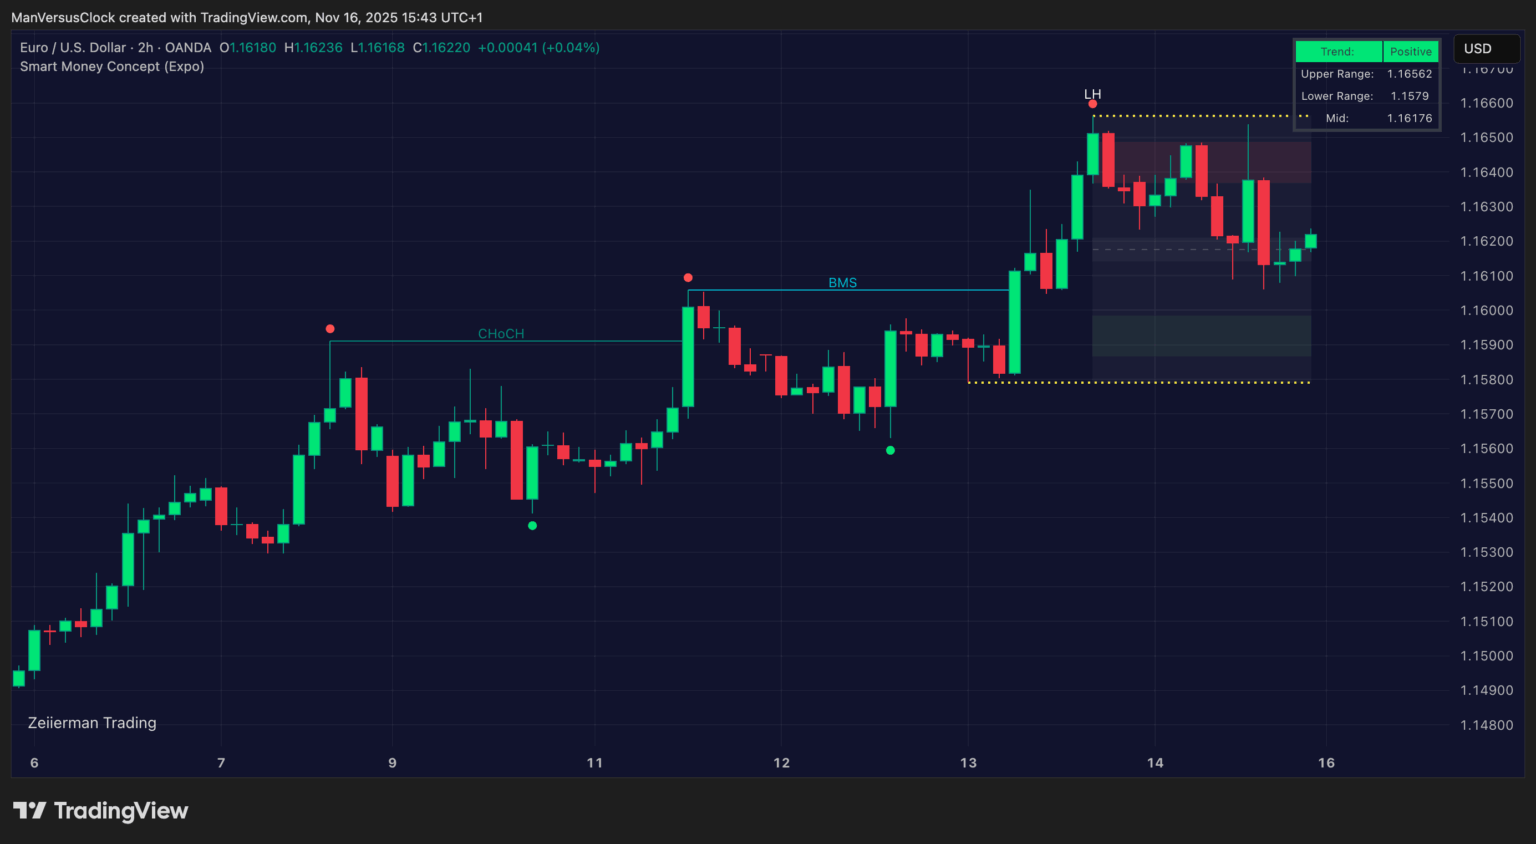
Zeiierman offers multiple Smart Money indicators that detect order blocks, order flow, imbalances, and supply and demand zones. They can be quite powerful when the Analyzer’s suggested entry sits inside or near those zones. Here’s how I use them:
Check for order blocks under or above the suggested entry. If it is present, your bias strengthens. Next, look for FVGs near your stop to increase the chance of a cleaner retest and a better entry opportunity. Accordingly, you can adjust the stop near or just beyond the order block structure rather than a random percentage.
Read: 11 Essential Chart Patterns Every Trader Should Master in 2025Wait for the SMC indicator to identify a market structure break (break of structure). Then use the AI Chart Analyzer (upload the chart on a lower timeframe) to confirm the strength of this move. When both align, you’ve got institutional confirmation, and you may catch the same signals that drive those explosive moves you always seem to miss.
It also helps in timing the entry because the SMC shows you the institutional order flow and liquidity zones, while the AI gives you the momentum confirmation. Look for AI trend strength above 70% combined with SMC structure breaks for the highest probability setups.
Pairing 3: AI Moving Average & Trend Range Detector
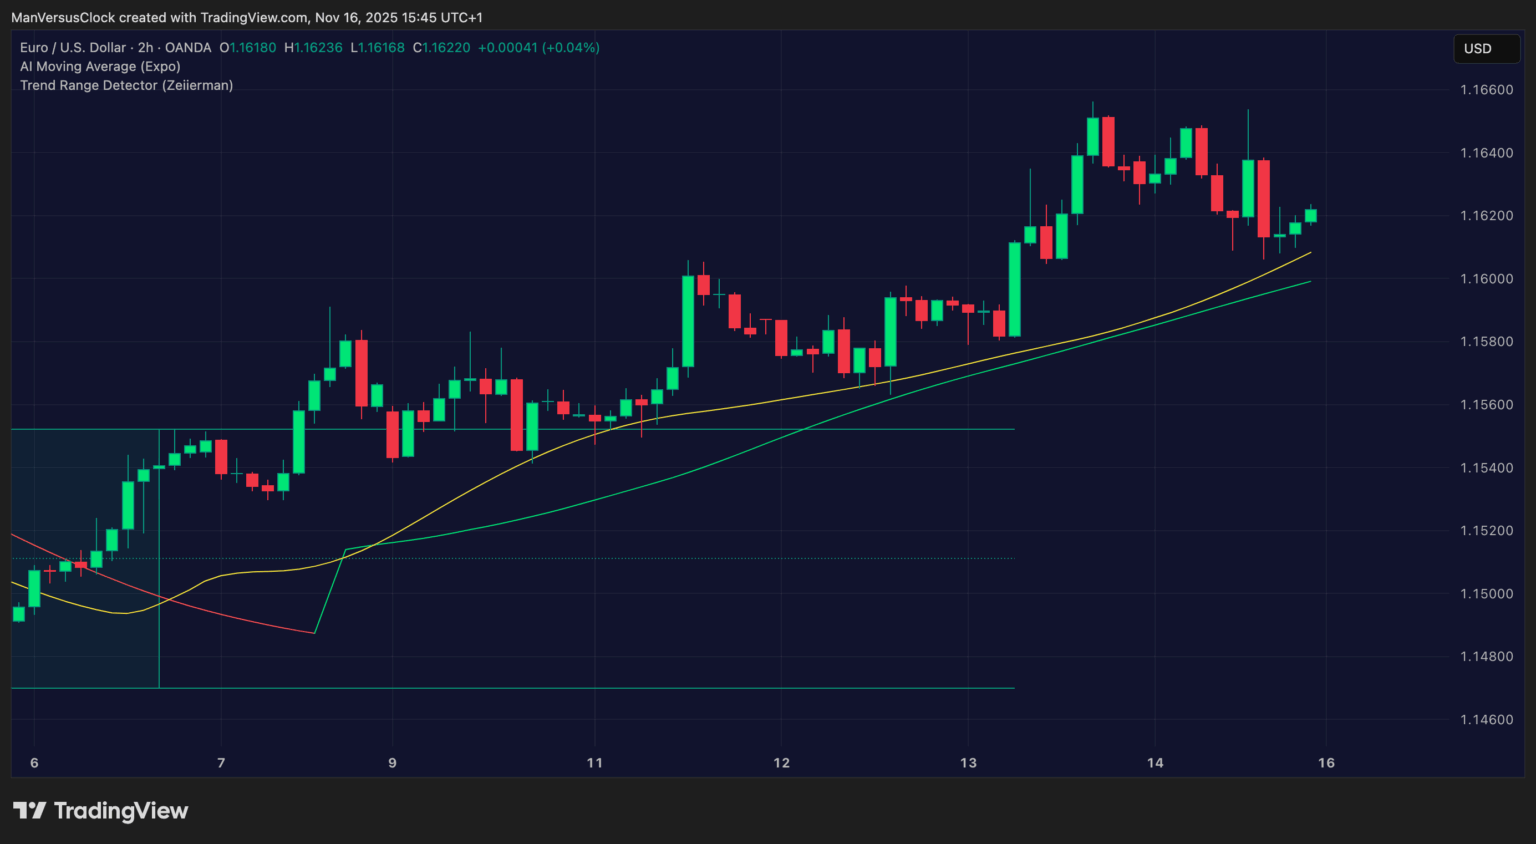
One of the biggest trading traps is the false breakouts. They occur when the price breaks above resistance or below support, but quickly reverses and traps the traders. The AI Chart Analyzer gives you the technical context (trend bias, volatility zones, and likely breakout areas), while the AI Moving Average and Trend Range Detector add a confirmation layer that filters out weak or deceptive moves.
When you get the analysis of the uploaded chart, focus on the Price Action and Strategy sections. If it suggests something like resistance within a certain price range and a possible breakout when a strong close above occurs. You can mark the breakout zone it suggested in your live chart.
Then the AI Moving Averages can help you confirm trend direction and strength.
Use these rules for MA:
- Only take bullish breakouts if the short-term MA (9 or 20 EMA) is above the long-term MA (50 or 100 EMA) and both are sloping upward.
- Only take bearish breakouts if the short-term MA is below the long-term MA and both slope downward.
The Trend Range Detector indicates whether the price is trending or ranging. If the AI Chart Analyzer signals a breakout but the Trend Range Detector shows ranging action, try to hold off the trade. Most breakouts from ranges need extra volume confirmation, so look for that.
If you see a strong trend on the range detector, the breakout has a higher probability of continuation. To filter the moves, only take breakouts above the AI Moving Average when the Trend Range Detector shows a breakout from compression.
4. Common Mistakes (and How to Dodge Them)
1. Ignoring Risk Management
This is the fastest way to deplete your account, regardless of how accurate the signals are. AI Chart Analyzer offers speed, accuracy, and efficiency, which lets you capitalize on market opportunities effectively, but only when combined with proper risk controls.
Keep in mind :
- Never risk more than 1–2% of your capital per trade.
- Use the AI Chart Analyzer’s volatility metrics to size your positions thoughtfully.
- Monitor activities that can influence the market and turn it against your trade.
2. Over-reliance on AI
Some traders treat AI outputs as a final signal instead of a starting point. They see a bullish or bearish signal and enter trades without considering broader market factors. You must always maintain situational awareness of the markets because they are influenced by geopolitical events, macroeconomic changes, and sudden volatility.
3. Signal Chasing
Quality is always better than quantity. It’s tempting to jump on every signal, but the best traders are selective. If you’re constantly in and out of trades, you’re probably overtrading. Wait for high-confidence setups with clear risk-to-reward profiles.
4. Uploading Low-Quality or Cropped Chart Images
The AI Analyzer relies heavily on chart clarity to read candlesticks, indicators, and key levels. If the uploaded chart is pixelated, missing an axis, price line, or cropped too tightly, the AI will misread data points.
For example, if you upload a chart without the price scale barely visible, the AI might still give you an overview of levels, but your price action analysis and strategy could be way different from what they should be.
For the final note, the Zeiierman AI Chart Analyzer is a powerful tool, but it’s not a crystal ball. Its real edge comes when used smartly with solid risk management, decision making, and powerful Zeiierman indicators. When you start mixing the AI Chart Analyzer’s pattern recognition with your trading plan, you can execute trades with more precision, discipline, and confidence, which ultimately maximizes your profits.
SM_Trader
SM_Trader is a highly experienced coder and strategy developer who brings the most complex algorithms to life. As a member of MENSA, the prestigious organization for individuals with intelligence scores in the top 2% of the world, he combines exceptional analytical skills with a keen eye for numbers and statistics, empowering businesses to grow at the right pace and in the right direction.
More from SM_Trader