I have always found this question to be somewhat moot. Technical indicators have become a cornerstone of modern trading, as they are now available on virtually every trading platform and are incorporated into numerous trading strategies worldwide. For many traders, indicators mean the difference between trading blindly and having a systematic approach to the markets. But what about you?
The answer depends on you, the trader. If you’re lost in a sea of candlesticks, indicators can provide a sense of structure. They’re not magic, but they help you spot patterns, confirm momentum, and avoid emotionally-driven trades.
For beginners, indicators provide structure and guidance by highlighting momentum, trend direction, or overbought and oversold zones. For experienced traders, indicators serve more as confirmation tools rather than decision-makers. The key is not whether you use indicators, but how you use them. I use them as support for my analysis, not a substitute for understanding price action. Overreliance can lead to confusion and missed opportunities, while smart, minimal use can improve timing and discipline..
It’s hard to believe, but these technical indicators are more of a hindrance for some users. Overreliance, signal clutter, or using tools without understanding what they measure can actually hurt your performance.
1. Why do traders rely on technical indicators?
I know I have a bias, but let’s be fair, indicators can be incredibly useful when used properly. Technical indicators provide structure to raw price charts; it’s akin to having GPS in a foreign city where you don’t speak the language. These indicators translate that chaos into something readable: “oversold,” “breakout zone,” “momentum shift.”
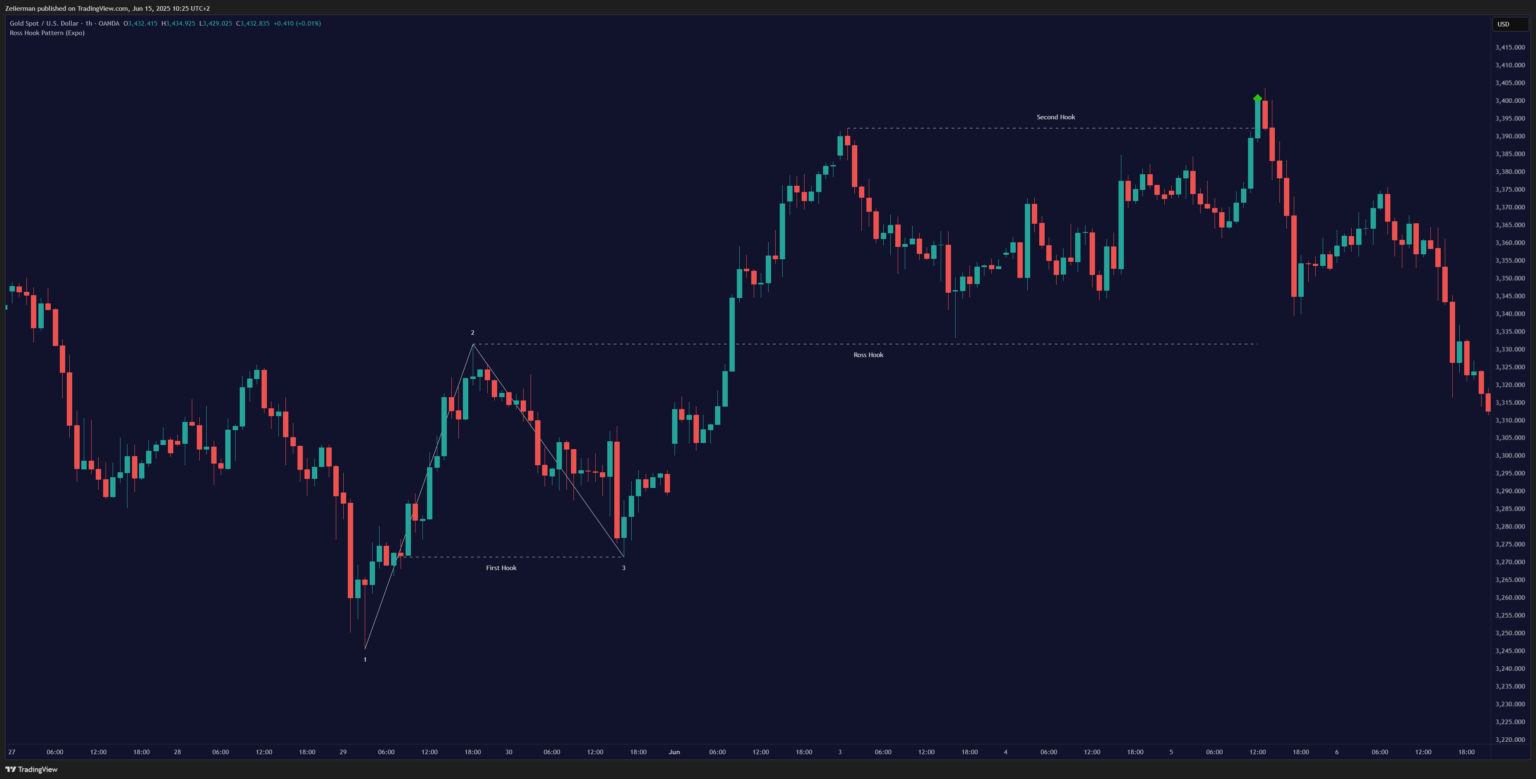
Most markets, whether it’s crypto, stocks, or forex, can be understood with the same set of tools. You can apply a Moving Average to Bitcoin or Apple stock, and it “works” the same way. That kind of universality gives traders a sense of control and an approach that theoretically works across different markets and timeframes.
And then there’s the holy trinity that excites every trader on the planet: automation, confirmation, and trend filtering. Want to set alerts when momentum shifts? Indicators can do that. Need confirmation that your gut feeling about a trade setup is correct? There’s an oscillator for that. Trying to figure out whether you’re trading with or against the trend? Moving averages have just entered the chat.
Most traders aren’t using indicators because they’ve done rigorous backtesting and determined that the tools provide a statistical edge. They’re using them because indicators make the chaos of the markets feel manageable and give structure to what would otherwise feel like educated guessing at best and, at worst, gambling.
A. The Rise of Technical Indicators: How We Got Here
Let’s rewind the clock a bit. Back when the elder generation of traders actually stood on exchange floors wearing those colourful jackets, technical analysis was pretty straightforward. You had price, volume, and maybe a few moving averages if you were feeling fancy.
The real edge came from reading the room—literally sensing the mood and momentum of other traders around you. The 1990s and early 2000s saw an explosion of interest in technical trading. Indicators like Bollinger Bands, MACD, and RSI became default tools for anyone opening a trade chart. You didn’t need to be a quant guy or coder, just click, drag, and boom! Out of nowhere, you were now a “technical analyst.”
Read: RSI vs Stochastic RSI: A Comprehensive Guide for Trading BeginnersBut here’s where things get interesting: Algorithmic trading entered the scene around the same time. Suddenly, you had institutional players using complex mathematical models to trade millions of shares in microseconds. This created a feedback loop in which retail traders thought they needed equally sophisticated tools to compete.
Modern traders are somewhat rightly attracted to these tools, as they understand the impact of big players in the market; therefore, they naturally follow the smart money by using technical indicators.
B. The Goal of Any Good Technical Indicator
From @Zeiierman’s and my perspective, the goal of any indicator in your strategy is to prepare, not predict. The second job is to confirm bias. Notice I didn’t say “create bias”—that’s a recipe for disaster. If your gut says “buy” but three different momentum indicators are screaming “overbought,” maybe it’s time to hit the brakes.
Timing entries is the third piece of the puzzle. You might be convinced that AAPL (Apple Inc.) is going higher, but when exactly do you pull the trigger? This is where indicators actually add value by helping you identify optimal entry points. Before you add any indicator to your arsenal, ask yourself these critical questions:
- What is this indicator actually measuring?
- Why do I need this particular insight?
- Does it duplicate something I already have on my chart?
- Can it adapt to my specific timeframe and trading strategy?
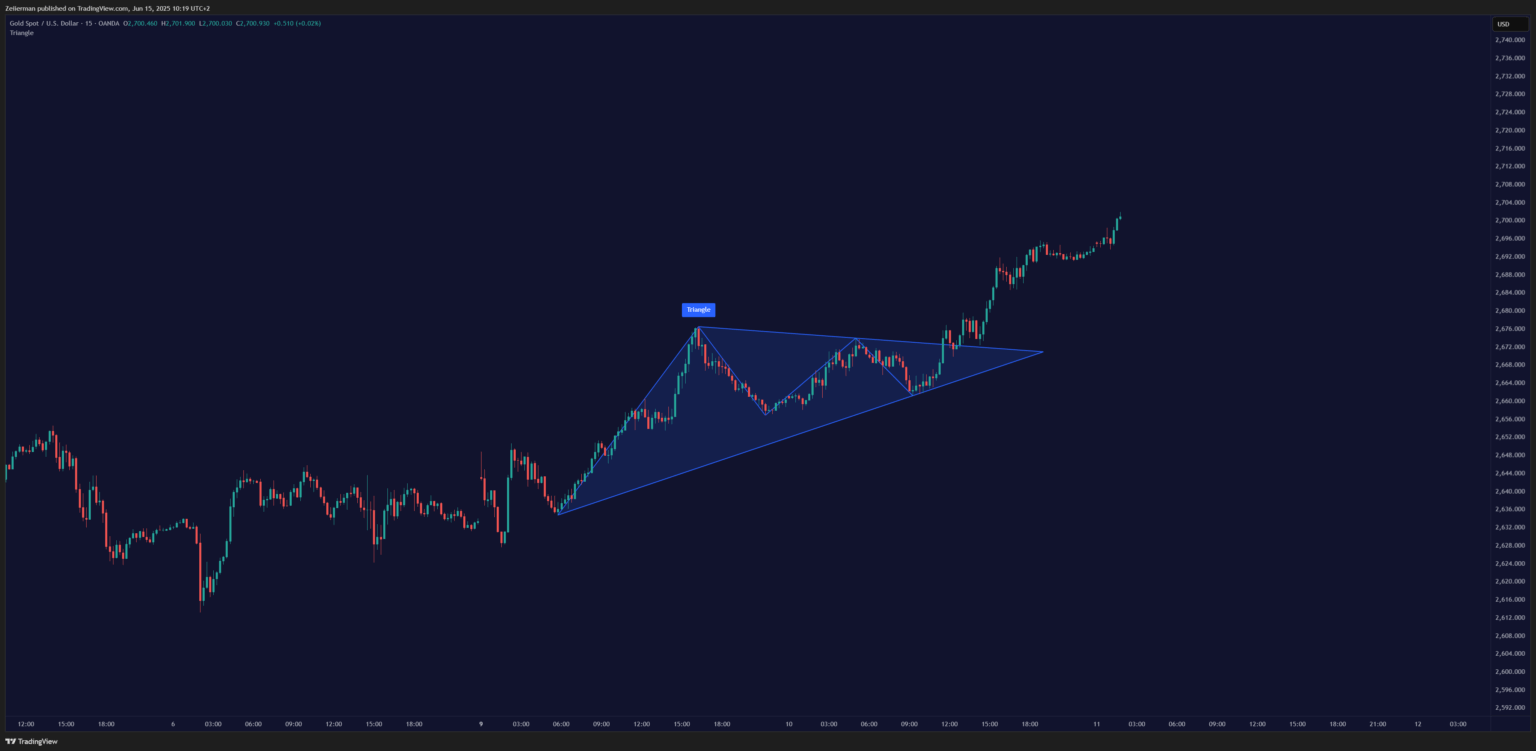
If you can’t answer these questions clearly, you’re probably just adding noise to your decision-making process. It’s like collecting kitchen gadgets. Sure, that avocado slicer looks cool, but do you really need it when you already have a perfectly good knife?
2. What academic research says (and doesn’t say)?
If you’re someone who likes hard data and peer-reviewed evidence like me, you’ve probably gone looking for academic studies on technical indicators. And more likely than not, you ended up being confused. Academic research on technical indicators is about as conclusive as a weather forecast – lots of data, mixed results, and everyone interpreting it differently.
Let’s break it down. There are two sides, really, and somehow both show evidence.
A. The First Side: “They don’t work.”
Some research papers argue that technical indicators offer no real edge. They say that most indicators are just fancy ways of looking at past price data, and that by the time you see a signal, like an RSI crossover or a MACD shift, the opportunity is already gone.
This argument often comes from the Efficient Market Hypothesis (EMH) crowd. First argued by Eugene Fama in 1970, the efficient market hypothesis states that all available information is already “priced in,” so it is not possible to consistently beat the market using indicators driven by historical data.
Burton Malkiel’s book “A Random Walk Down Wall Street” presents stimulating views that most technical analysis is just sophisticated astrology. Malkiel’s stance is rooted in the efficient market hypothesis, viewing it as “voodoo finance” or lacking a solid theoretical foundation. In the book, he claims price action is not influenced by historical data and is random. This claim undermines the usage of technical indicators, which rely heavily on past data of the commodity.
Furthermore, in the research by Sullivan, Timmermann, and White (1999), titled “Data-Snooping, Technical Trading Rule Performance, and the Bootstrap,” they applied rigorous testing to over 7,000 technical trading rules. They concluded that most did not outperform a simple buy-and-hold strategy once adjusted for data-snooping bias.
However, here’s the kicker: most academic studies test indicators in isolation or employ oversimplified strategies that don’t accurately reflect how real traders actually utilize these tools. Real trading is messier than laboratory conditions, and that messiness is where fortunes are made (and lost). It’s like testing whether a hammer is useful by examining its effectiveness at driving screws alone.
Read: 11 Essential Chart Patterns Every Trader Should Master in 2025B. The Flip Side: “They work when used properly.”
Some studies, particularly in the fields of behavioral finance and quantitative analysis, have found that certain technical indicators can be effective under specific conditions. For example, the momentum effect, as documented by Jegadeesh and Titman in 1993, is a well-established view. It states that stocks (or cryptocurrencies or currencies) that have been trending upward in the past 3–12 months tend to continue rising for a while, and vice versa. Their conclusion supported the use of tools such as moving averages, MACD, or breakout indicators.
Also the paper by Lo, Mamaysky, and Wang (2000) explored the use of technical indicators in financial markets, specifically focusing on how they can provide incremental information useful for investment decisions. Brock, Lakonishok, and LeBaron (1992) tested two simple strategies in their landmark paper: moving average crossovers and support/resistance breakouts. The results? Statistically significant positive returns in the U.S. equity market, especially in trending environments.
Most academic research tries to find universal truths. But in trading, there’s rarely such a thing. One strategy might work exceptionally well in a trending environment but fail miserably during consolidation. That doesn’t make it useless — it just means it’s situational.
Also, here’s what most academic studies don’t consider:
- Slippage and fees in live trading
- The psychological side of running trades
- How traders combine indicators with intention or news
- The impact of different settings and parameters (most studies just use the default ones)
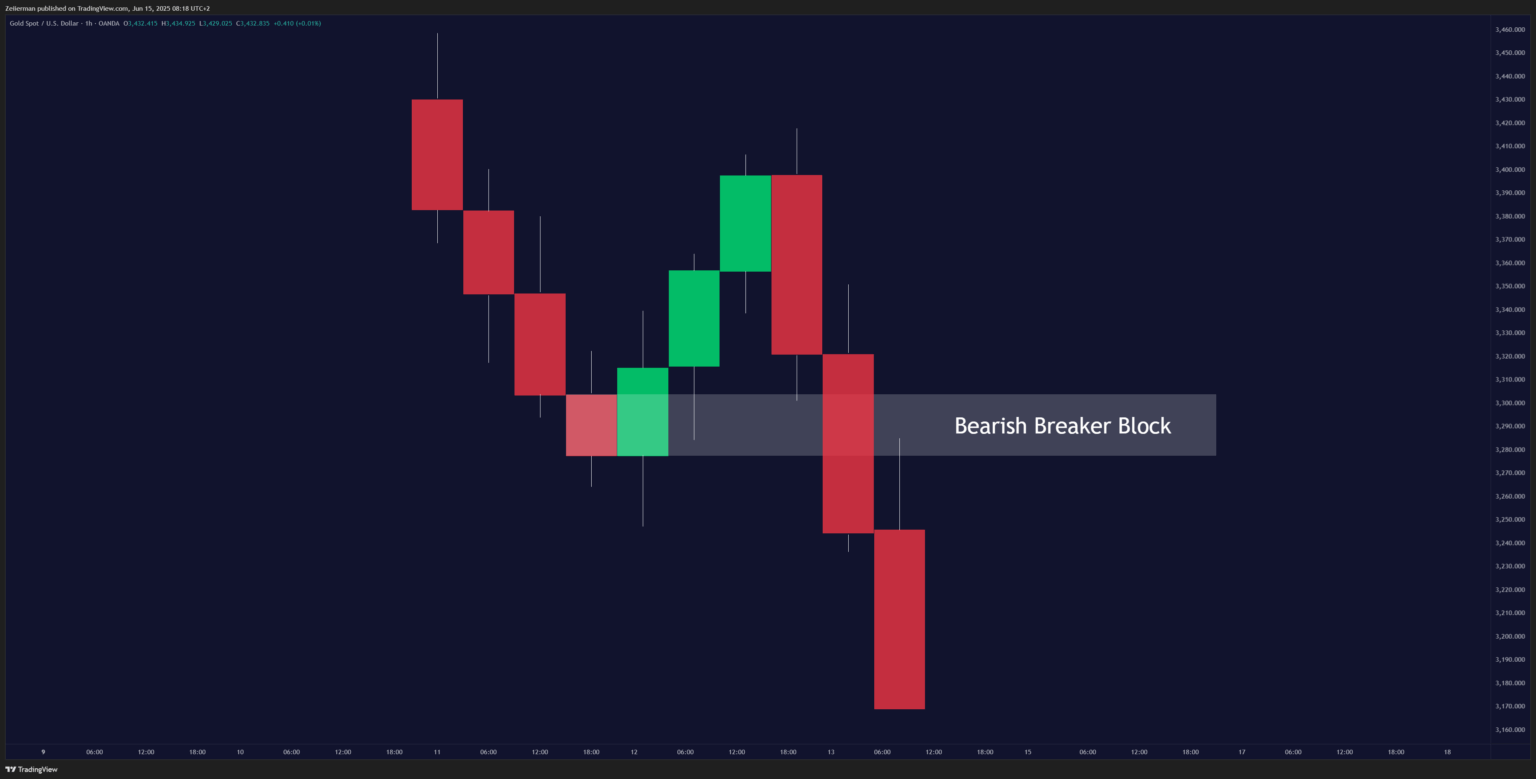
3. Noise vs. Signal: How indicators mislead uninformed traders
Alright, let’s pull back the curtain a bit. While indicators promise clarity, they can just as easily lead you toward confusion if you’re not careful. It’s a classic case of too much “noise” drowning out the actual “signal.” In my experience, the lagging nature of some indicators is their biggest weakness.
Most indicators are mathematical derivatives of price action, which means they’re telling you what happened, not what’s about to happen. By the time your MACD gives you a bullish crossover, the move might already be halfway done. This lag can cause you to enter trades late, missing the juiciest part of a move, or even worse, getting caught on the wrong side of a reversal.
Over-optimisation and curve fitting are where things get really dangerous. I’ve met traders who spent months perfecting their RSI settings, adjusting the period from 14 to 13.7 just because it backtested better. They created a beautiful system that worked perfectly on historical data and failed miserably in real-time trading. They have optimised for the past at the expense of adaptability to future conditions.
Another sneaky issue, especially with some custom or poorly coded indicators, is repainting indicators. These indicators adjust their historical values or signals as new price data becomes available. It’s like a GPS that shows you the perfect route after you’ve already arrived, then proudly claims it guided you there flawlessly.
Finally, a major pitfall is that indicators often provide redundant information. Stacking RSI, Stochastics, and MACD? You’re not getting more data, you’re getting the same data three times. Instead of clarity, you get clutter.
Indicators are reflections, not predictors. They can misinform through lag, false signals, or by making you believe in an over-optimised fantasy. Use them wisely, or they’ll turn your trading journey into a frustrating game of whack-a-mole.
4. When Indicators Do Make a Difference
So, after all that scepticism, are indicators useless? Absolutely not! As I said, there are two sides to this coin. When used correctly and with a clear understanding of the limitations, technical indicators can be incredibly valuable tools for your trading success. It’s about knowing when and how to use them.
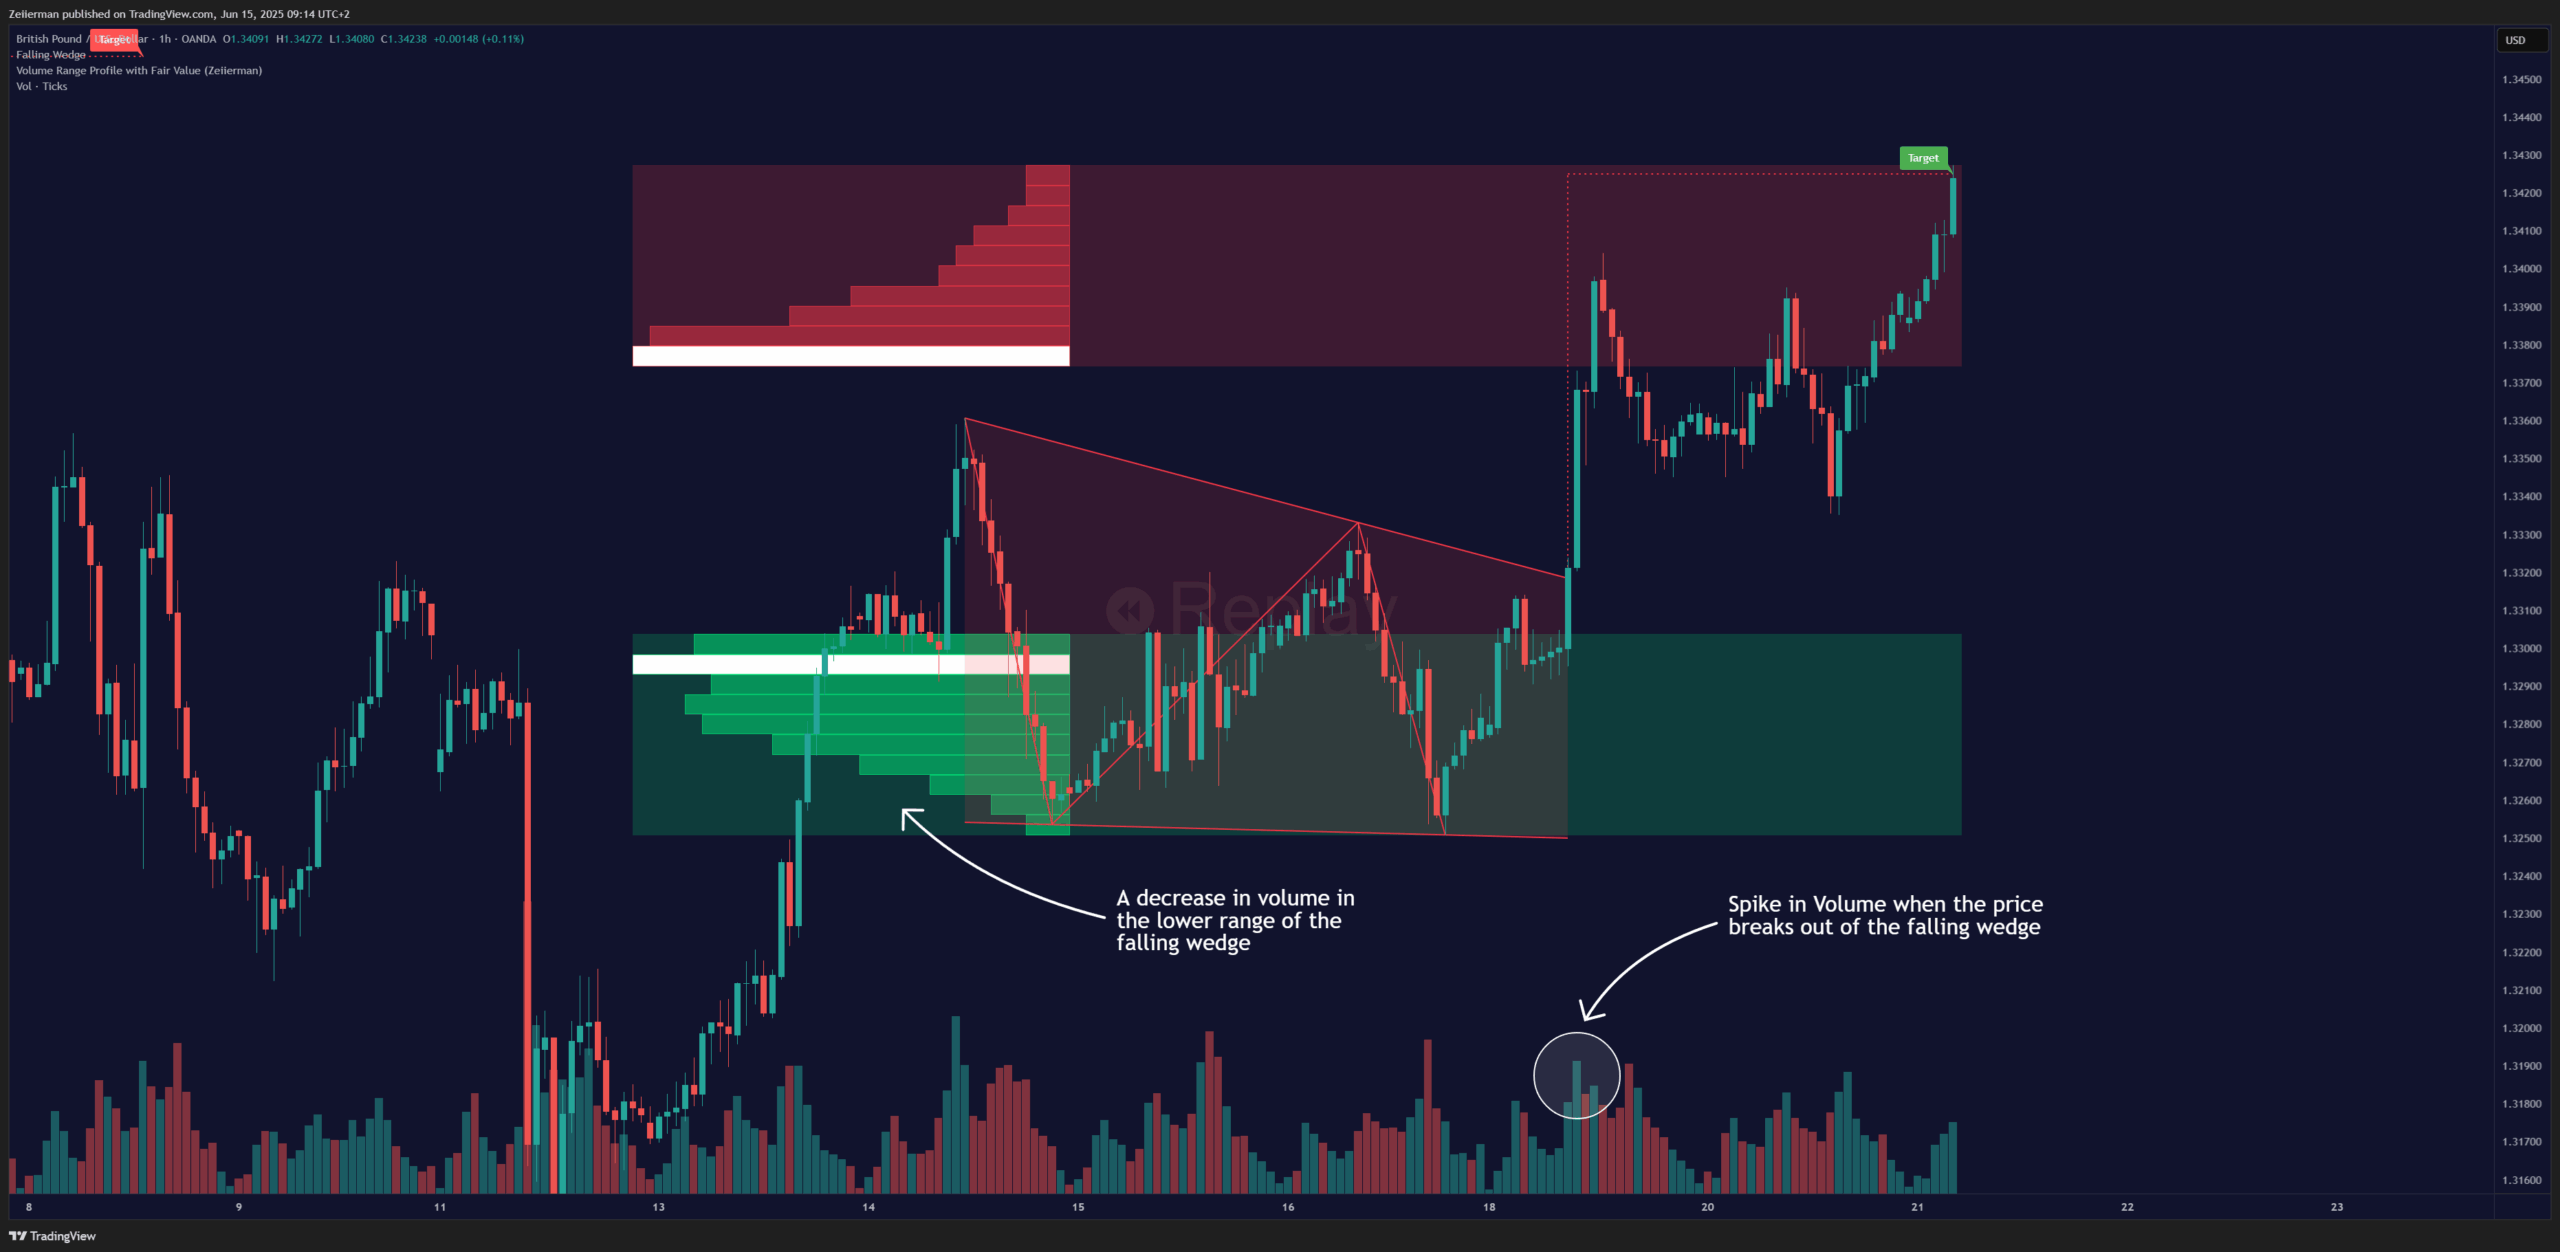
Confluence setups are where indicators shine brightest. Instead of relying on a single indicator for trade signals, smart traders use them in combination with price action analysis. Price action, the raw movement of candlesticks, chart patterns, and S/R levels, is king. Indicators should be supporting actors, providing additional weight to a decision you’re already leaning towards because of what the price itself is telling you.
Another scenario where indicators shine is when you’re using indicators from a reputable vendor or tools that are heavily backtested and run non-redundant data. These aren’t the free indicators you download from random forums; they’re sophisticated tools developed by experienced traders and programmers who understand market dynamics through decades of experience. Not to toot my own horn, but yeah, that includes us.
For new traders who need structure and visual cues, indicators can serve as valuable training tools. They provide definite rules and clear signals that help beginners develop consistency and discipline. The critical question is: Does the indicator refine your trading style rather than define it?
If you’re using indicators to enhance your edge and improve your timing, you’re on the right track. If you’re completely dependent on them for every trading decision, you might be setting yourself up for trouble.
Read: How to Trade Head & Shoulders Pattern in 2025 – Beginner to Advance5. How to Make Indicators Work for YOU
It’s not about choosing sides in some holy war between technical approaches. It’s about building a toolbox that works for your specific style. First and foremost, adopt a selective approach to indicator usage. This means selecting just one or two indicators that genuinely complement your primary analysis, which should always be based on price action fundamentals.
I primarily use three things: a 20-period moving average for trend context, volume analysis for confirmation, and RSI only during specific market conditions. That’s it. No Christmas tree charts, no conflicting signals, no analysis paralysis.
Furthermore, context-dependent trading is essential. Different market conditions call for different tools. In strong trending markets, I rely more on moving averages and momentum indicators. During consolidation periods, oscillators become more useful. In high-volatility events, I strip my charts down to almost nothing and focus purely on key levels and price behaviour.
Based on my experience, I recommend starting to build your personal trading system by understanding your natural trading style. Start by defining your stronghold, outlining your rules and risks while constantly refining your moves. Ultimately, your system should be yours. Not copied from Reddit, not pieced together from Twitter threads.
Final Advice: Test everything. Strip away anything that doesn’t add clarity.
Frequently Asked Questions (FAQs)
A. How do I know if an indicator is actually helping my trading performance?
Track your trading statistics with and without specific indicators. Key metrics include win rate, average profit/loss ratio, and maximum drawdown. If removing an indicator doesn’t harm (or actually improve) these metrics, the tool was likely adding noise rather than value to your decision-making process.
B. As a beginner, how should I start incorporating technical indicators into my trading?
While understanding raw price action is your bedrock, indicators are fantastic for building confidence and structure early on. I suggest starting with one or two fundamental indicators, such as a simple Moving Average to visualize trends or an RSI to grasp momentum. They provide clear visual cues that simplify complex market movements, giving you a tangible way to interpret what the price is doing.
C. With so many indicators available, how do I choose the right ones without cluttering my chart?
It’s not about how many, but how effectively you use them. Think of your chart as prime real estate – every indicator should earn its spot. Focus on selecting just a few indicators that offer unique, non-redundant insights and are heavily tested.
D. My indicator gave me a signal, but the trade went against me. Why?
Welcome to the real world of trading! Indicators give you the probabilities, not certainties. There are several reasons this could happen: the signal may have been false (common in choppy markets), you may not have considered the overall market context, or you may have relied solely on the indicator without confirming it with price action.
Every trade carries risk, and even the best signals can fail to yield a profit. That’s why proper risk management is crucial.
