Works on the Following Platforms
TradingView
For use on the TradingView platform
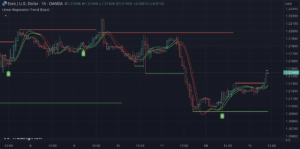
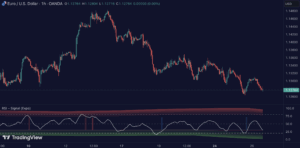
The “RSI with Self-Adjusting Linear Regression Bands (Zeiierman)” indicator is a sophisticated tool designed to provide traders with insights into market momentum and volatility, using the Relative Strength Index (RSI) combined with linear regression bands. This indicator adapts to changing market conditions, offering a dynamic approach to identifying overbought and oversold levels.
How the RSI with Self-Adjusting Linear Regression Bands Works
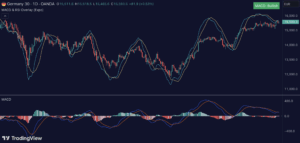
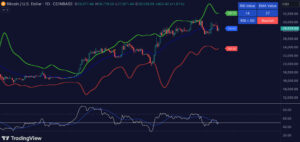
This indicator calculates the RSI of the market prices, which is then smoothed and used to form the basis of a linear regression channel. This channel adapates based on the RSI values, allowing traders to visualize the current trend strength and potential reversal points with upper and lower bands indicating deviations.
Key Components of the RSI with Self-Adjusting Linear Regression Bands Include:
- RSI Calculation: Uses a windowed and weighted moving average approach to smooth out the RSI calculations.
- Linear Regression Bands: These bands adjust according to the volatility and the mean reversion indicated by the RSI, providing dynamic support and resistance levels.
- Overbought and Oversold Levels: Customizable thresholds that help identify extreme conditions which might indicate a reversal.
Usage of the RSI with Self-Adjusting Linear Regression Bands
Traders use this indicator to:
- Identify potential buy or sell signals based on where the RSI lies in relation to the adaptive bands.
- Gauge the strength of the current market trend.
- Determine potential exit and entry points by observing the interaction between the RSI and the regression bands.
Features of the RSI with Self-Adjusting Linear Regression Bands
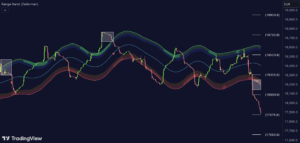
- Adaptive Thresholds: The linear regression bands adjust based on real-time RSI changes, which allows for a more accurate representation of market volatility.
- Visual Effectiveness: The bands provide a clear visual guide to current market dynamics, adjusting in width with market volatility, which is essential for making quick trading decisions.
- Alert System: Includes customizable alerts for RSI crossovers over significant levels, aiding in timely decision-making.
Conclusion
The “RSI with Self-Adjusting Linear Regression Bands (Zeiierman)” is an essential tool for traders who rely on momentum and volatility analysis to guide their trading decisions. Its ability to adapt to market conditions makes it a valuable addition to any technical trader’s toolkit, suitable for various trading styles and strategies, particularly in highly volatile markets.
Zeiierman
With over 16 years in the market, Zeiierman has extensive experience as a full-time trader and risk advisory consultant for hedge funds. He has developed many profitable trading strategies, drawing on his background in risk management and strategy execution.
More from Zeiierman