Breakout trading sounds simple on paper. Price moves above resistance or below support, you jump in, and the market runs. In reality, breakouts are where most traders lose patience, money, confidence, or all three.
You’ve probably seen it yourself. Price breaks a level. You enter. Two candles later, it snaps back, stops you out, and then moves in the original direction.
That’s not bad luck. That’s a misunderstanding of how breakouts actually work. Breakout trading works best when used to capitalize on the momentum of a price move and to take advantage of the increased volatility that often follows a breakout.
In this guide, I will explain how a breakout trade works in a real and practical way. Take advantage of my experience to learn how breakouts really behave, why they work, when they fail, and how traders use structure, volatility, and momentum to stay on the right side of the move.
How Breakout Trading Works (& When)
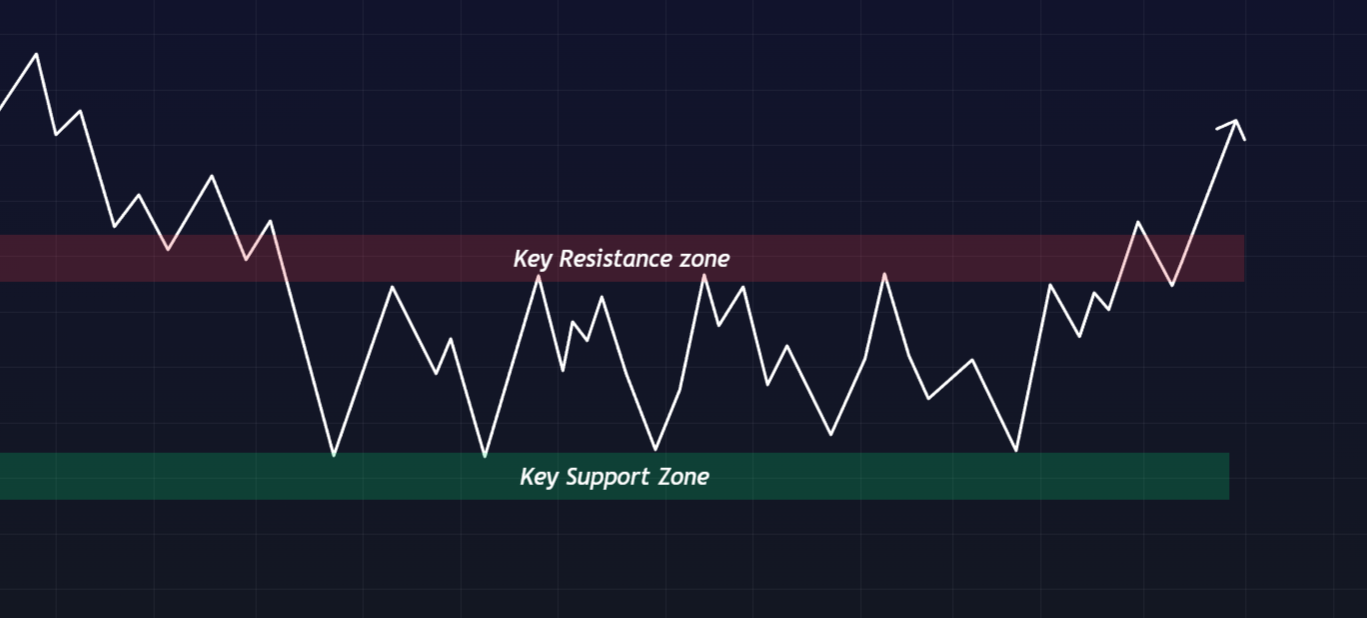
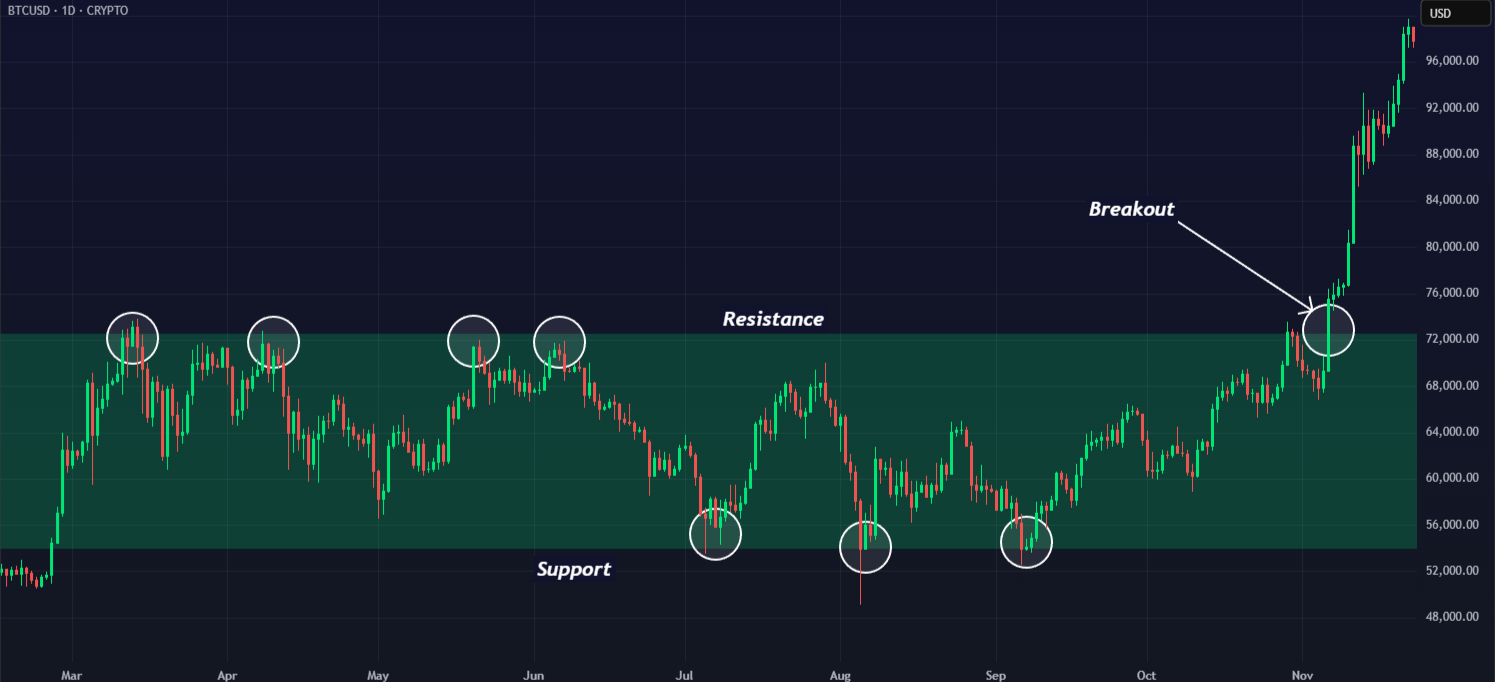
Markets go through cycles without creating clear and distinguishable trends on most days. In real life, markets pause, compress, and then expand. That pause is where breakout traders focus. A ‘pause’ in my dictionary is when a market is ranging or consolidating; it means buyers and sellers are in a stalemate, and the price is bouncing between a floor (support) and a ceiling (resistance).
Within that range, orders are building. Short sellers have their stop-losses sitting just above the ceiling. Buyers who missed the move are waiting for a sign of strength. When the price finally breaks through that ceiling, it sets off all those buy-stops, creating a massive surge in demand and a significant market move.
To sum up, a breakout works when the price has spent enough time building the structure, liquidity pools sit above or below a visible level, and participation increases at the moment of expansion.
That expansion is the breakout. But the key point most traders miss is that breakouts are not about levels. They’re about pressure. Support and resistance are just visual references, because the real driver is the market’s stored energy (orders). When that energy is released, the price moves fast because there’s little opposition left.
1. Identifying Breakouts Correctly
It’s an important distinction that many traders often overlook. Say, you drew a ‘line’ on your chart, by yourself or by using an algorithmic indicator, and the price is barely poking above it. Would that make it a price breakout?
It’s more likely to be just noise instead of a proper, actionable breakout. The key here is not to mistake movement for meaning. Markets move ALL THE TIME without needing to make a meaning out of each movement. Truth is, breakouts are rare, and real breakouts usually give you clues before and during the move. In my experience, three things have to line up for a breakout to happen undeniably:
1. Structure
The market must clearly recognize the level that is about to be (or is being) broken. This usually comes in the form of repeated reactions at a specific high or low, a well-defined range, or a recognizable consolidation pattern. If the price has only hit a level once or twice, it’s not necessarily about to break out. Odds are that there probably aren’t enough orders/liquidity stacked up to support a lasting move.
2. Time Period of Range
Compression doesn’t happen instantly. The longer the price stays within a defined range, the more significant that area becomes. In my experience, you should try not to get overly bored or frustrated by the market’s lack of movement, as it takes time for positions to form.
3. Expansion Phase
At the moment of breakout, something must change. Volatility should increase, momentum should pick up, and price should move with intent rather than hesitation. Breakouts that drift slowly beyond a level without follow-through are rarely reliable because they indicate a lack of commitment from market participants.
2. Types of Price Breakouts in Trading
A. Horizontal Breakouts
Horizontal breakouts happen when the price moves within a clearly defined range. It may be bouncing between obvious S/R levels. These breakouts are incredibly dependable because the structure is easy to spot and the behavior is consistent across markets and timeframes.
In a horizontal range, buyers consistently defend the lower key level (support) while sellers protect the upper boundary (resistance). Over time, each test slightly weakens the defending side. When the price decisively breaks through one of these levels, the move often picks up as trapped traders exit and new traders step in.
Horizontal breakouts work well with the Trend Algo indicator, which helps find the overall market direction. I look for consistency between the trend indicator and the breakout direction, since a breakout occurs in line with the dominant market trend rather than against it.
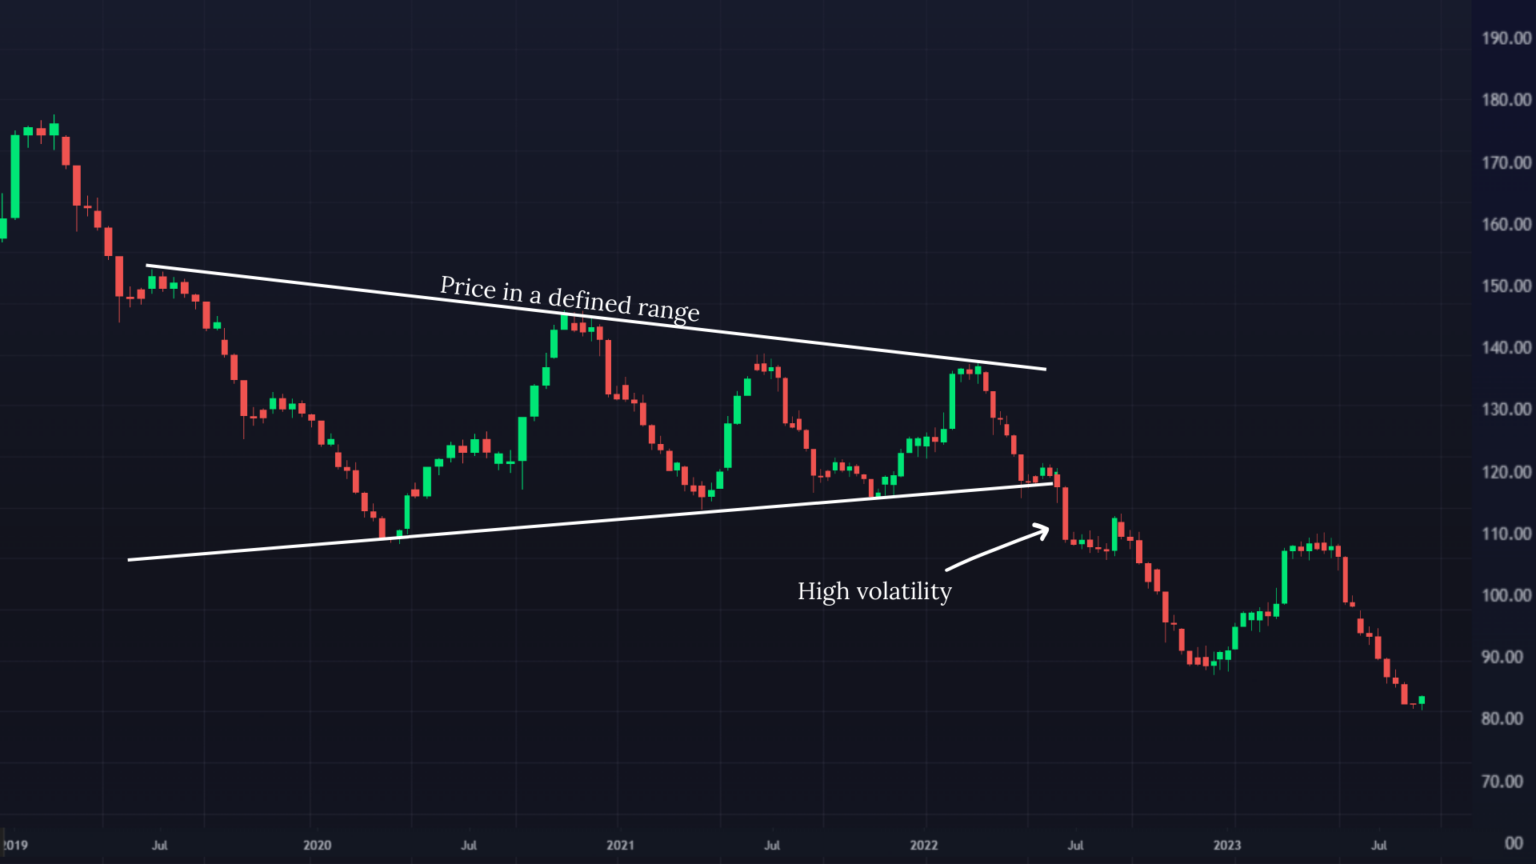
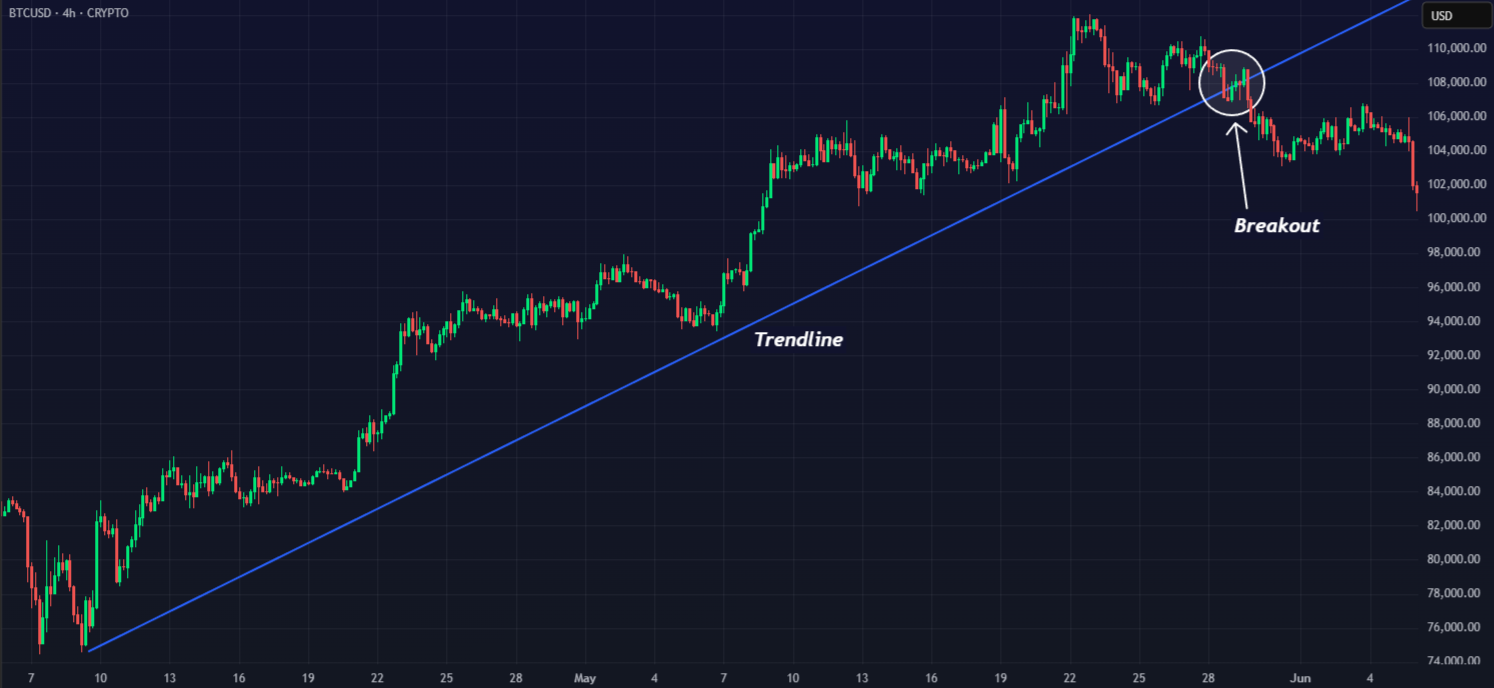
B. Trendline and Diagonal Breakouts
Diagonal breakouts occur along sloping trendlines or in wedge-like patterns. This setup can be fairly effective when appropriately confirmed. Two traders can draw on the same chart and reach different conclusions, given how trendlines can be pretty subjective.
These breakouts work better when they align with other structures, such as flat levels or zones where volatility is compressed. They also gain strength from confirming momentum. That’s where the Momentum–Trend Strategy indicator can really help you, as it helps figure out if momentum is actually shifting in the direction of the breakout or if it’s just bouncing around within the range.
Read: What is volatility in trading? How to use volatility in trading?If you don’t have that momentum confirmation, diagonal breakouts can be more likely to fail because the price often spikes past the trendlines for a moment before settling back down.
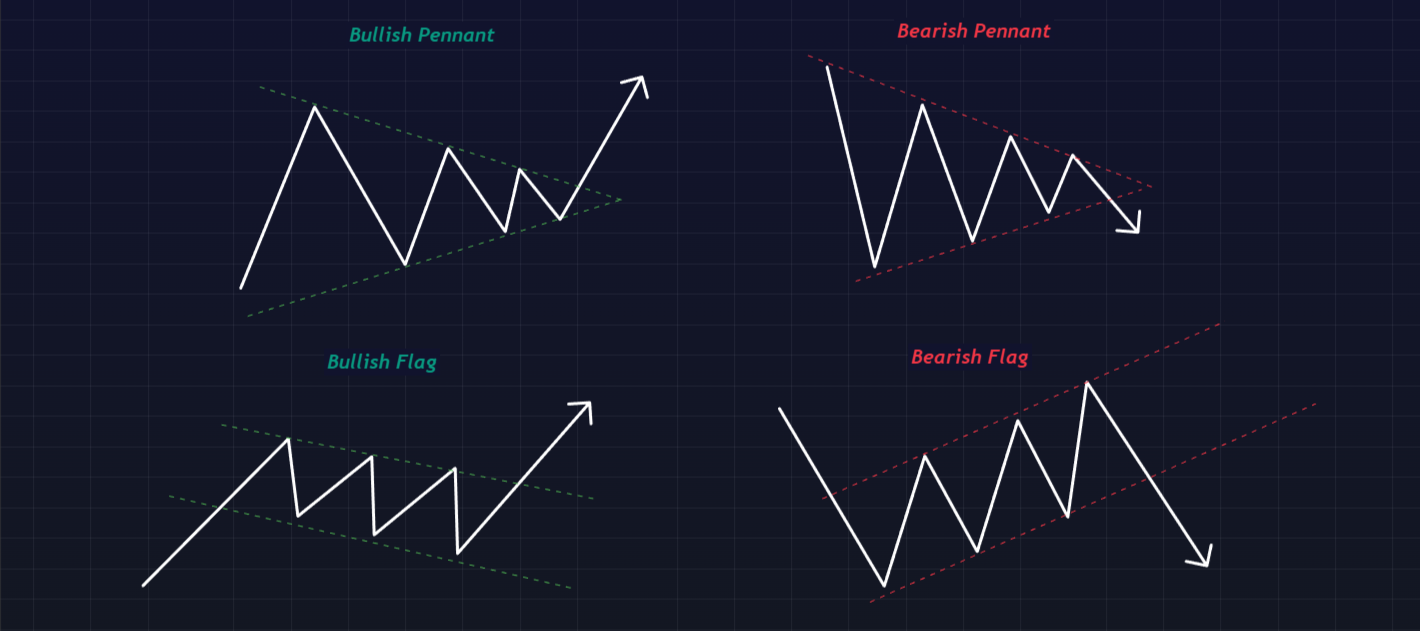
C. Pattern-Based Breakouts
Patterns like triangles, flags, pennants, and channels are basically organized consolidations. It’s more important to focus on their behavior than on the shape itself when fishing for breakouts. As prices move through these patterns, you’ll notice a drop in volatility and a buildup of expectations.
You shouldn’t trade based on these patterns in a mechanical way. For instance, a triangle breakout doesn’t count just because the price reaches the apex. It only carries weight if there’s movement that follows the compression. So, think of these patterns as helpful visuals rather than straightforward trading signals, and it’s a good way to sidestep a lot of unnecessary losses.
Breakout Trading Strategy
In fundamental markets, breakout trading becomes reliable only when structure, momentum, and volatility line up. Using my notes, I have curated a step-by-step strategy for breakout trading with multiple layers of confirmation rather than a single signal.
📌 My strategy primarily leverages Zeiierman’s tools to filter out noise and focus on high-probability breakout conditions. You can, however, choose to switch to alternate indicators that achieve the same goal, more or less.
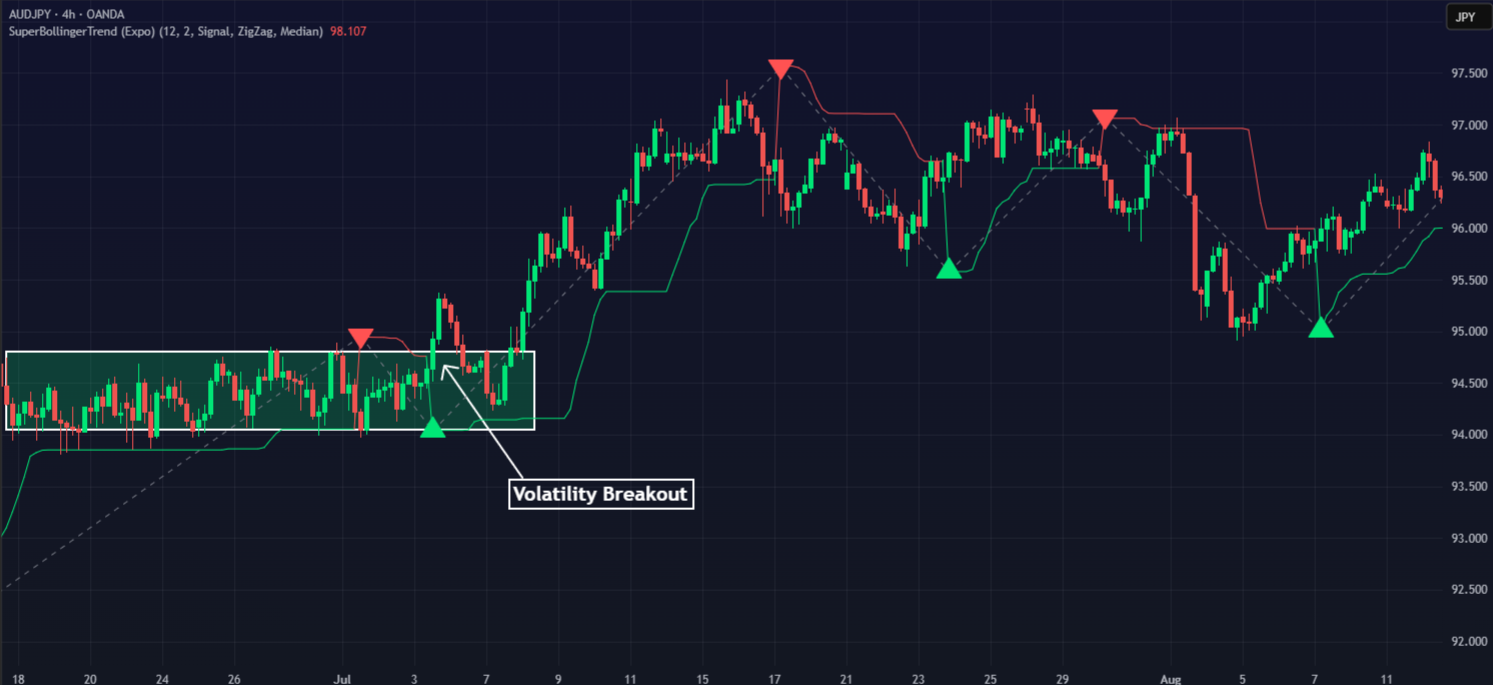
1. Identify Consolidation
Use the 1-hour, 4-hour, and Daily timeframes for most breakout setups. These capture meaningful structure without too much noise. I use the Smart Range Breakout System to automatically mark range blocks or consolidation zones based on volatility compression and adaptive structural mapping.
A valid consolidation will do the following:
- Show multiple rejections at upper and lower range boundaries
- Tight price action confined between the range edges
- No clear trend continuation yet
This ‘range’ represents a balance between buyers and sellers. Longer and tighter consolidation indicates that more energy is likely stored for the eventual breakout.
📌 Expert Tip: Do not enter trades while the price is inside the range. The breakout only matters once the price exits the range structure with conviction.
Read: How to Trade in Volatile Markets? 4 Crucial Investment Strategies by Pros2. Confirm Momentum
Switch your attention to Zeiierman’s Momentum Breakout Pro once the price reaches your intended range and boundary. Our TradingView script (indicator) will reconstruct a momentum signal and highlight only breakouts with intense directional pressure that align with price structure, the overall trend, and volatility conditions.
Through our Momentum Breakout Pro, you need to look for two main confirmations. You need a clear signal that indicates momentum has expanded beyond the threshold. This is your breakout signal. Second, you need confirmation levels. These three adaptive levels, based on volatility, show how far the price needs to move to validate the breakout.
Here’s a quick checklist to identify a strong breakout:
- The breakout signal appears near the range edge
- When volume gradually increases in either direction
- Momentum aligns with price direction
- Confirmation levels are tight (close to price), which implies stronger potential continuation.
- Look for a clear break in the market structure (BMS).
Avoid breakouts where momentum is weak, confined, or misaligned with price direction. In most cases, these breakouts either fail or revert into the range.
3. Trade Execution: Entry Rules
Once the range and confirmation signals are established, we must start planning our trade entry. Gotta enter the market now, right? Let’s say the breakout calls for a long entry.
For long entry conditions to be considered valid, the price must close above the upper range boundary, and a valid breakout signal should be present in the upward direction, with confirmation levels tightening. You can also use the Adaptive Squeeze Momentum to confirm recent volatility compression followed by expansion.
For short entry conditions to be considered valid, the price should close below the lower range boundary, and a valid breakout signal should be present in the downside direction, with strong confirmation levels.
Now that we have our conditions set. We can enter the trade in one of two ways, and you’ll choose based on your intended position and risk appetite.
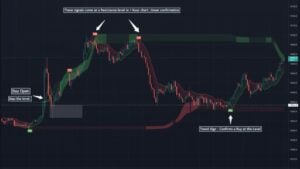
- Breakout Close Entry: Enter a position immediately after the breakout candle closes beyond the range boundary with momentum confirmation.
- Retest Entry: Wait for a pullback to the broken range edge, which now acts as support (for longs) or resistance (for shorts), and enter on confirmation.
Retests often provide better risk positioning, especially in slower markets.
4. Risk Management & Exits
Breakouts can fail as easily as they can run far when valid. We always recommend that our community members keep their risk management up to date based on their position size and risk appetite. Many members of our little community prefer using the Trade & Risk Management Tool to calculate and provide stop-loss and take-profit levels in real-time.
Stop-loss Placements: Place your initial stop just below the breakout candle’s low for long trades, or above the breakout candle’s high for short trades. Alternatively, you can use a recent swing low or swing high just outside the range boundary.
Profit Targets: You can reuse the Momentum Breakout Pro indicator, which includes adaptive take-profit markers that act as realistic first objectives. A good practice when you want to manage the trade manually is:
- Take part of the profit when the price hits your first target
- Move the stop-loss to break even instead.
- Trail stops manually or with an indicator once the trend confirms continuation.
Any breakout strategy requires patience and good timing to be successful. By combining range identification with momentum confirmation, you’re stacking confluences in your favor.
Read: How to start trading with TradingView? Setting Yourself Up for SuccessCommon Mistakes to Avoid while Trading Breakouts
1. Trading every line that breaks
Most “breaks” are just noise through minor or subjective levels. The ones that matter usually emerge from a clear, tight consolidation with squeezed volatility. Only trade ranges you can outline with confidence (clean highs/lows, multiple touches). Tools like the Smart Range Breakout System will help filter real ranges from random lines.
2. Front-running the move
Entering inside the range because a breakout “looks imminent” is how you get chopped. A breakout isn’t a breakout until price closes outside the range with follow-through. Always wait for a close beyond the boundary and for momentum to expand. You can use our Momentum Breakout Pro to help confirm actual expansion instead of a single tick through the line.
3. Ignoring context and regime
Breakouts created in (or by) counter-trends often fade before stalling. It has been my experience that trend-aligned breaks travel farther with less babysitting. Check the higher-timeframe trend and structure first.
4. Parking stops where everyone does
Stops at/just outside the breakout line are liquidity magnets and get swept before the real move. Place invalidation beyond structure: past the most recent swing, last pullback, or an ATR buffer. If that’s “too wide,” reduce the size, don’t tighten the idea.
5. No plan for failed breakouts
Define failure criteria upfront (e.g., full reclaim back inside range on closing basis). Exit cleanly if your plan includes it. And if you’re switching to signals, wait for fresh ones. Don’t do it out of revenge.
Zeiierman
With over 16 years in the market, Zeiierman has extensive experience as a full-time trader and risk advisory consultant for hedge funds. He has developed many profitable trading strategies, drawing on his background in risk management and strategy execution.
More from Zeiierman