Markets don’t always reverse with a bang. Sometimes, they whisper. Interestingly, the Abandoned Baby candlestick doesn’t rely on hype or noise. Instead, it signals a deep shift in sentiment through a clean, three-candle setup which has helped me spot trend reversals for over a decade now.
The best part? It works in both bullish and bearish market conditions. Whether you’re swing trading, day trading, or looking at long-term positions, knowing how to identify and trade this pattern will give a huge boost to your win rate in the market.
📌 Disclaimer: This isn’t a get-rich-quick magic pill. Like any technical pattern, “Abandoned Baby Candlestick” requires patience, proper risk management, and a solid understanding of the market context.
Stick with me, and I’ll show you exactly how to make this pattern work for your trading style.
1. How to identify the Abandoned Baby Pattern?
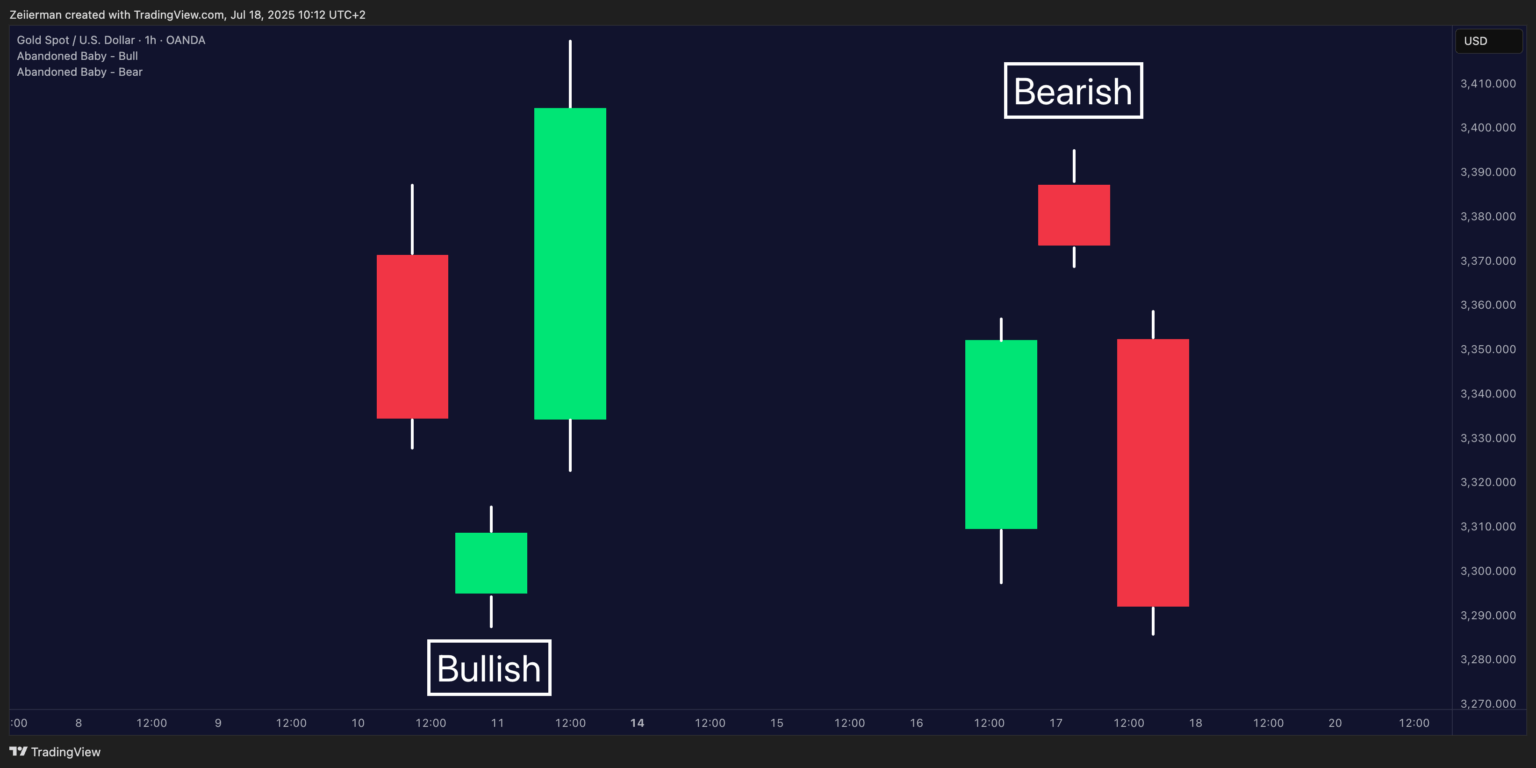
Here’s a how the Abandoned Baby pattern forms:
The First Candle continues the ongoing trend. This candle will push higher if you’re in an uptrend and fall in a downtrend. Nothing fancy here – just the trend doing its thing.
The Second Candle (the “baby”) is where things get interesting. The open and close prices are very close in this second candle, creating a small body like a Doji or spinning top. Most importantly, this candle must be completely isolated from the candles on both sides of it.
We’re talking about gaps – real gaps where there’s no overlap in the price ranges. My thumb rule is that the middle candle’s high (bullish case) must be below the first candle low, and the third candle must open above the Doji high (vice-versa for bearish).
The Third Candle confirms the reversal. It opens with another gap (in the opposite direction from the trend) and closes strongly in the new direction. This is your “aha moment” because the market just told you it’s officially changing directions.
I. Conditions for a Valid Abandoned Baby Candlestick Pattern
Alright, let’s get into the nuts and bolts of actually finding these patterns.
1. Gap Requirements
Both gaps need to be real gaps, not just slight price overlaps. I’m referring to the actual whitespace on your chart where no trading took place. The Doji’s high should be below the previous candle’s low (in a bullish pattern), and its low should be above the next candle’s high. Point is, the gaps MUST isolate the Doji.
2. Doji Characteristics to Look For
The middle candle doesn’t have to be a perfect Doji, but a very small body is required compared to the other candles. The key is that the open and close are nearly identical, showing that neither bulls nor bears gained control.
3. Volume Considerations
Volume could be your best friend when confirming these patterns. I want to see a decent volume on the first candle (trend continuation), often with a lighter volume on the Doji (indicating uncertainty), and finally strong volume on the third candle (showing confidence in the new direction).
4. Timeframe Selection Tips
This pattern is effective on multiple timeframes, but I find it more reliable on larger timeframes. Daily charts are your sweet spot for swing trading, while 4-hour charts can work for more active strategies. Avoid hunting for these on anything shorter than 1-hour charts, or else you’ll drive yourself crazy with false signals.
Read: How Focus Leads to Success: Overcoming The Common Struggle in TradingII. Common Look-Alikes That Fool Beginners
- The “Almost” Gap: You’ll see a tiny overlap between the candles here. It looks like a gap at first glance, but the price ranges actually touch when zoomed in.
- The Evening/Morning Star Confusion: These are similar three-candle patterns, but the middle candle doesn’t need to be isolated by gaps. Don’t confuse the two patterns since Abandoned Baby is much rarer and typically more reliable.
- The Choppy Market Trap: In sideways markets, you’ll see lots of Doji-like candles with gaps but they mostly form noise rather than the Abandoned Baby pattern. You need a clear trend before the pattern for it to mean anything.
2. Identifying Setup for Bullish Abandoned Baby Pattern
This is the one that gets me excited. A bullish Abandoned Baby often appears after extended downtrends when everyone is convinced the stock (or currency or cryptocurrency) is heading into a spiral.
Setup: You’ve got a strong, bearish candle that continues the downtrend, followed by a Doji that gaps down below the previous candle’s low, and finally, a bullish candle that gaps up above the Doji’s high and closes strongly higher.
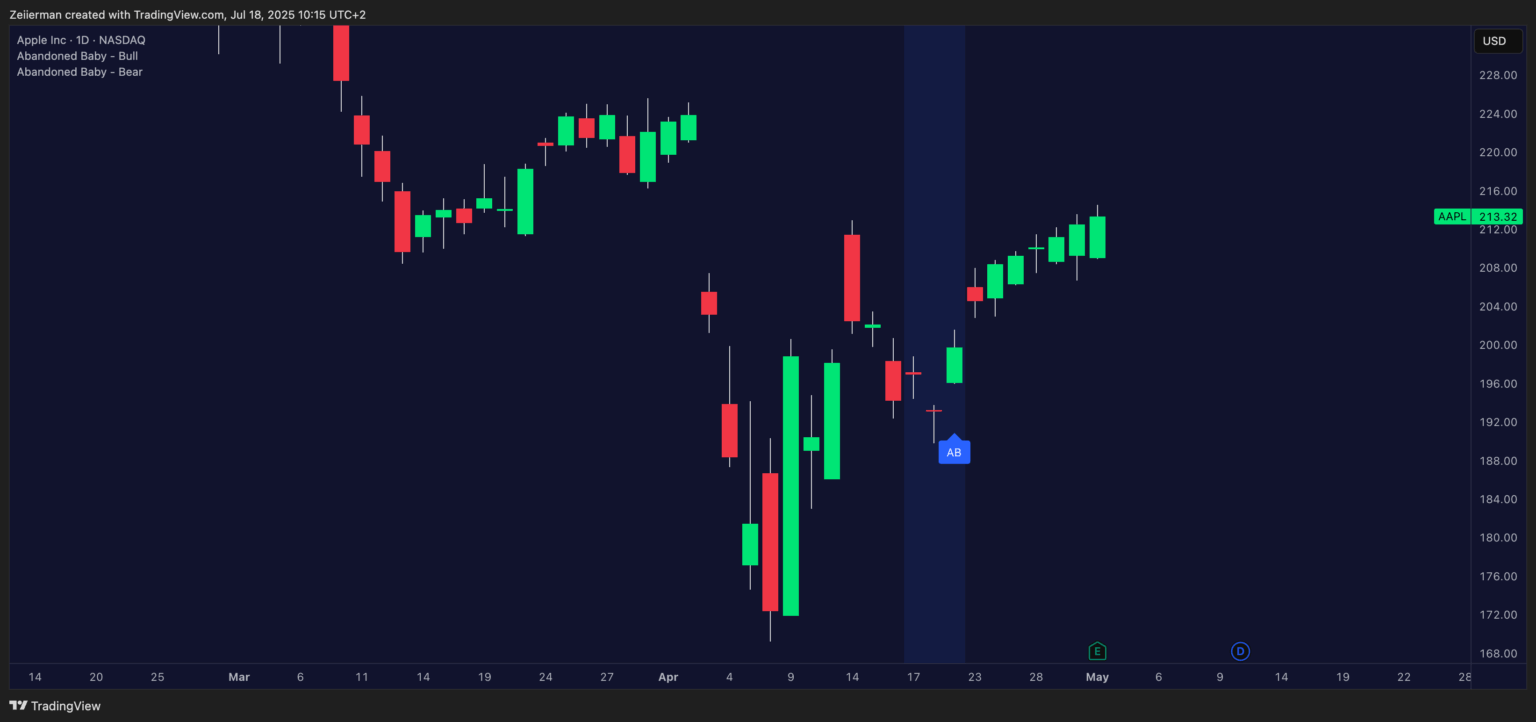
What’s really happening: The market has been falling, sellers are in control, and then suddenly, nobody wants to sell at these low prices. The Doji represents this moment of uncertainty. Next, the buyers step in aggressively and create that gap for a strong close.
Best Conditions for Bullish Patterns:
- Forms near major support levels or previous resistance-turned-support.
- RSI showing oversold conditions (below 30).
- High volume on the reversal candle (third candle).
- Possible after a decline of at least 10-15% from recent highs.
📌 Pro Tip: Bullish Abandoned Baby patterns often take longer to play out than their bearish counterparts. Why? Because fear is usually stronger than greed, and it takes time for buyers to regain confidence after a significant decline. Be patient with these setups, and you’re in for a profitable trade.
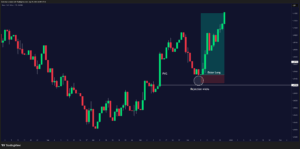
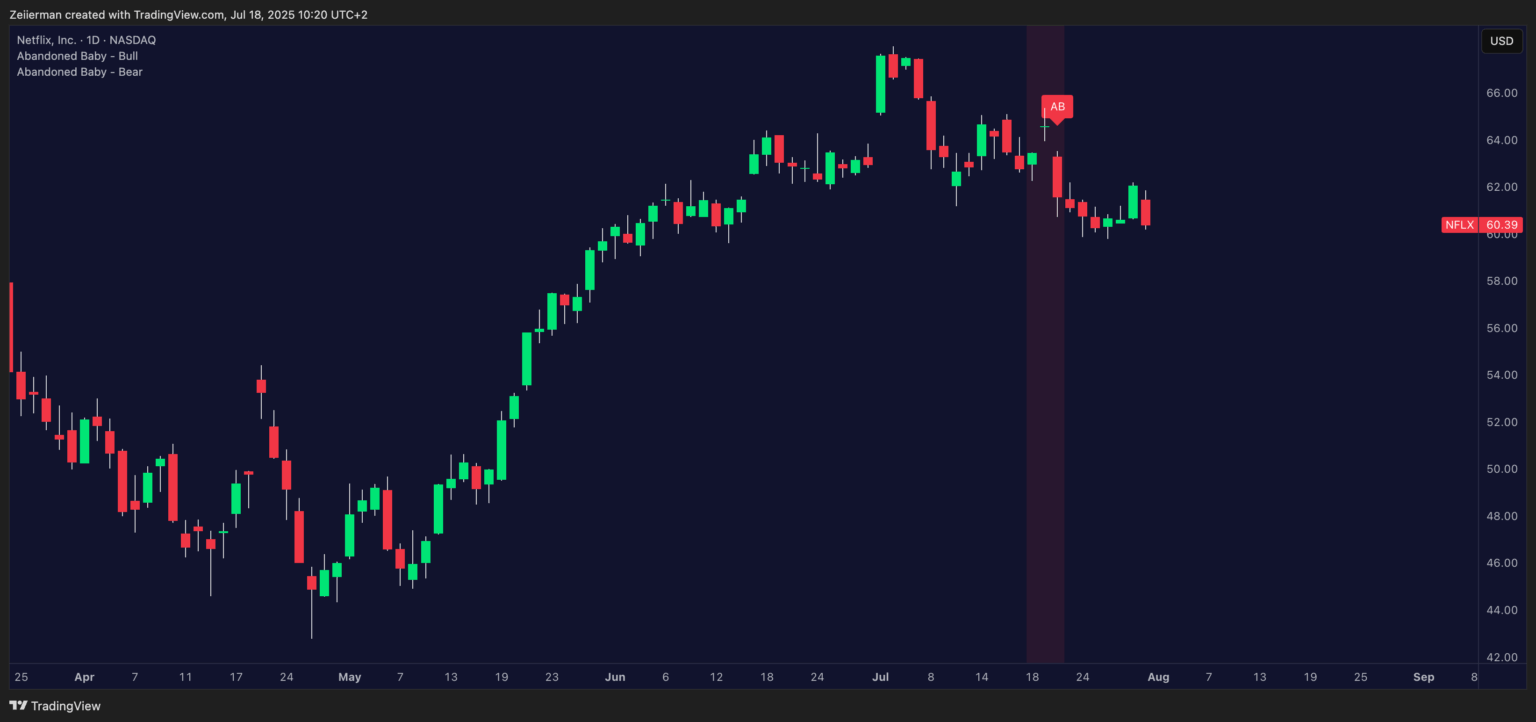
3. Identifying Setup for Bearish Abandoned Baby Pattern
This pattern typically appears after strong uptrends and can signal significant profit-taking opportunities. Abandoned Baby’s bearish counterpart is often more explosive than bullish patterns because gravity works faster than climbing.
The Setup: Strong bullish candle continuing the uptrend, followed by a Doji that gaps up above the previous candle’s high. A bearish candle then gaps down below the Doji’s low and closes even lower.
What’s really happening: Everyone is feeling great about the uptrend, with a wider price gap, but then reality sets in – perhaps valuations became stretched, or big players began taking profits. The Doji indicates hesitation, and the third candle signals a rush for the exits.
Best Conditions for Bearish Patterns:
- Forms at or near major resistance levels
- RSI showing overbought conditions (above 70)
- High volume on the breakdown candle
- Occurs after a good run-up (20% or more)
- Extra legit if it coincides with earnings disappointments or negative geopolitical news.
4. How to trade the Abandoned Baby Pattern?
This is what my confirmation protocol looks like:
First, wait for Candle 3 to CLOSE. Remember that patience isn’t optional. Next, check the volume. Is there a spike on the third candle that exceeds at least 150% of the average? Green light. Finally, you must find confluence. RSI needs to be under 30 for a bullish Abandoned Baby and over 70 for a bearish Abandoned Baby.
When trading an Abandoned Baby Candlestick pattern, you can take one of the two approaches: conservative and aggressive.
Read: Key Differences Between Supply and Demand vs. Support and ResistanceSetup #1: The Conservative Approach
Once everything is confirmed, here’s how I would trade this conservatively:
- Entry Timing: Don’t jump in right when you spot the pattern. Wait for the third candle to close and confirm the reversal. Then, if the next candle opens in the direction of the reversal, that’s your entry signal. You may miss some of the moves, but you’ll avoid a lot of dangerous fake-outs.
- Stop-Loss Placement: You can place your stop just beyond the opposite side of the Doji candle. For a bullish Abandoned Baby, your stop goes just below the Doji’s low. For a bearish pattern, it goes just above the Doji’s high. This gives the trade room to breathe in market noise while limiting your downside.
- Target Setting: Use the nearest major S/R level as your first target. If the pattern forms near a significant level, your target could be the next major level. A good rule of thumb is to aim for a 1:1.5 Risk-Reward Ratio (secure profits quickly).
- Risk Management: Never risk more than 1-2% of your account on any single trade. These patterns are reliable, but they’re not foolproof. Size your positions accordingly.
Setup #2: The Aggressive Play
This approach is suitable for experienced traders who aim to maximize profits and are willing to take on additional risk.
- Early Entry Techniques: You can enter during the formation of the third candle if it’s showing strong momentum in the reversal direction. Look for the candle to open with a gap, and if it immediately moves in your favor with good volume.
- Tighter Stops: Use the middle of the Doji as your stop level rather than above or below. This provides a better risk-to-reward ratio but increases the likelihood that the stop-loss will be triggered by normal market fluctuations.
- Quick Profit-Taking: Take partial profits at 1:1 risk-reward, then let the rest run to your main target. This locks in gains while still giving you upside potential.
5. What Can Go Wrong (And How to Avoid It)
1. The Gap-Fill Nightmare: This is probably the most common way these trades go on bleeding wallet mode. You spot a perfect abandoned baby pattern, enter your position, and then the market decides to “fill the gap” by trading back to the price level of the Doji. Your entire setup will be thrown out the window if (and when) this happens. To successfully avoid this issue, look at the volume during gap formation. Gaps formed on high volume are less likely to be filled quickly. Additionally, gaps that form over weekends or during major news events tend to be more sustainable.
2. False Breakouts: Sometimes, the third candle appears to confirm the reversal, but it’s actually just a temporary shift in the original trend. You think you’re catching a trend change, but you’re really just getting caught in a bull trap or bear trap. To successfully avoid this issue, wait for additional confirmation beyond just the third candle. You can see if On-balance Volume (OBV) breaks its trendline on the third candle. Additionally, wait for the MACD crossover after the third candle closes.
3. Choppy Market Conditions: The abandoned baby pattern is most effective in trending markets with a clear directional bias. In sideways, range-bound markets, you’ll see lots of Doji-like patterns with gaps, but they’re mostly just noise. To successfully avoid this issue, always check the bigger picture and context. If the market has been choppy for weeks, I would sometimes wait for a clearer trend to develop before searching for reversal patterns.
Frequently Asked Questions (FAQs)
1. Is the Abandoned Baby bullish or bearish?
An Abandoned Baby can signal either a bullish or a bearish reversal, depending on the direction of the gap. A bullish Abandoned Baby forms after a downward move: a long red candle, a Doji that gaps below it, and then a green candle that gaps back above the Doji. It signals that the sellers have exhausted and buyers are taking control. A bearish Abandoned Baby is the mirror image after an up-trend: a strong green candle, a gap-down Doji, and a red candle that opens above the Doji’s high and drives lower, revealing a sharp sentiment flip from buyers to sellers.
2. How reliable is the Abandoned Baby pattern?
Since it requires two clean gaps and a true doji, the Abandoned Baby is rarer but statistically more reliable than most single-candle signals. To boost accuracy, I prefer to pair the setup with volume spikes, a break of structure, or RSI divergence before committing capital.
3. What’s the difference between an Abandoned Baby and Morning Star?
A Morning Star (or Evening Star) allows the middle candle to overlap slightly with its neighbors. In contrast, an Abandoned Baby demands no overlap at all—the Doji must be “abandoned” by gaps on both sides. Basically, every Abandoned Baby qualifies as a stricter, higher-conviction version of a Morning/Evening Star.
This means that if either gap is missing, it’s best to default to Star-pattern logic rather than Abandoned Baby criteria.
Zeiierman
With over 16 years in the market, Zeiierman has extensive experience as a full-time trader and risk advisory consultant for hedge funds. He has developed many profitable trading strategies, drawing on his background in risk management and strategy execution.
More from Zeiierman