We’ve rolled out our largest update cycle to date: three new Pro-level tools for price action and momentum, a full Investor Pro Suite for long-term decision-making, and sweeping upgrades across our most-used indicators.
Zeiierman Trading has been on fire this year – thanks to our team, and of course, all of you. Over the last quarter, we rebuilt core signals, launched new Pro-level tools, and introduced the Investor Pro Suite. Why? We could help read the market faster, understand the context more clearly, and make better decisions.
This update closes the loop from intraday execution (breakouts, momentum, volatility) to long-term positioning (valuation, fundamentals, portfolio oversight) without leaving your charting workflow on Trading. Call me lazy, but that’s my favorite part about this.
1. New Professional Trading Tools
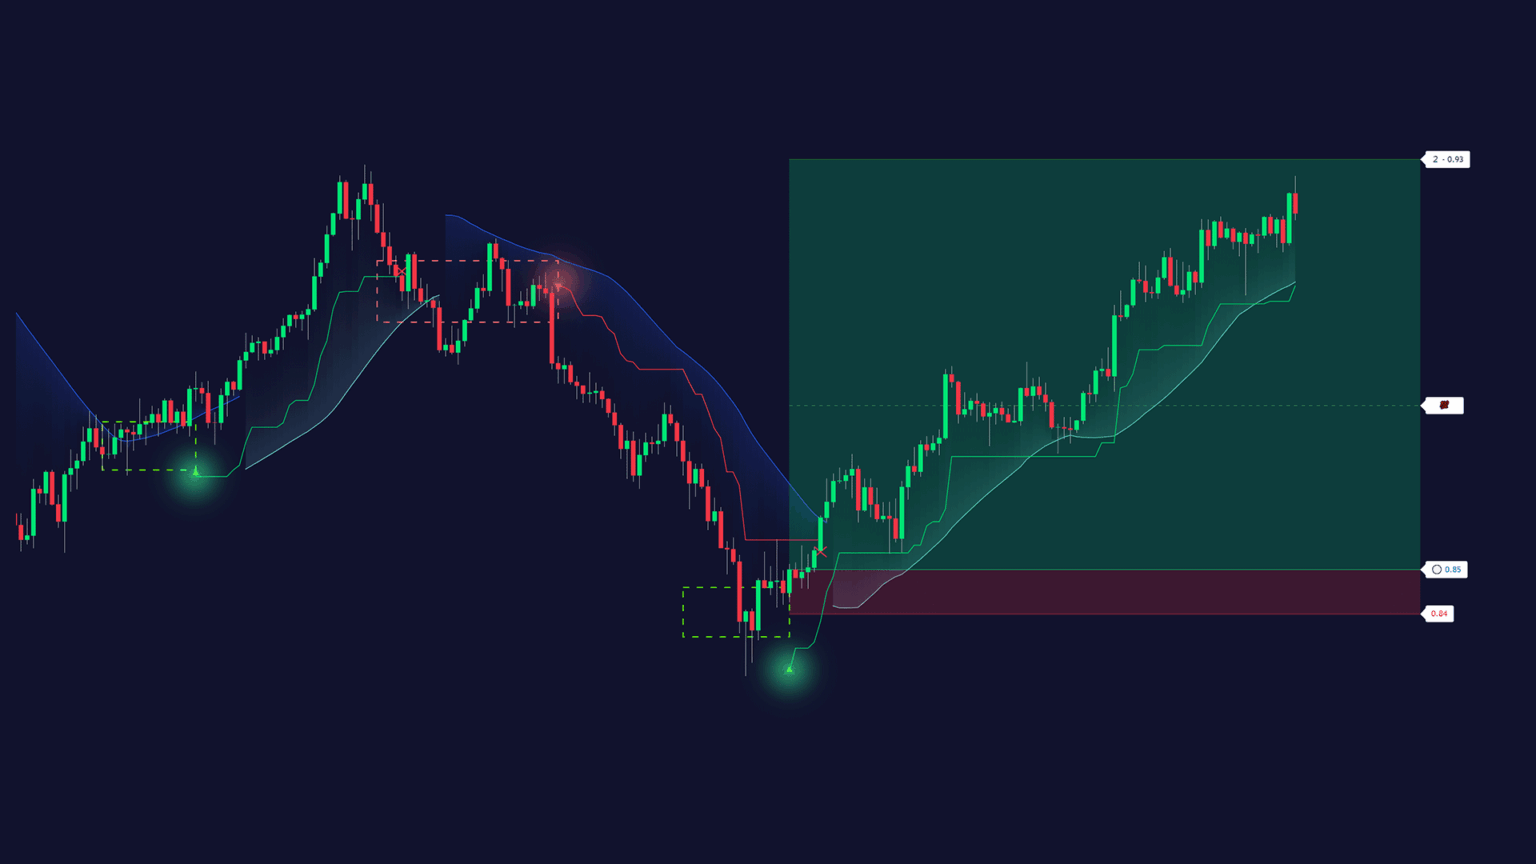
A. Smart Range Breakout System
A volatility-driven breakout framework that detects compression, projects expansion, and maps structure automatically (entries, stops, targets, trailing). This range breakout system filters noise, aligns with the regime, and gives a self-contained plan for traders who want clarity around expansion phases.
Try: Smart Range Beakout System on TradingViewWho it’s for: Volatility-expansion traders who want a rule-based breakout framework with pre-mapped entries, stops, targets, and trailing.
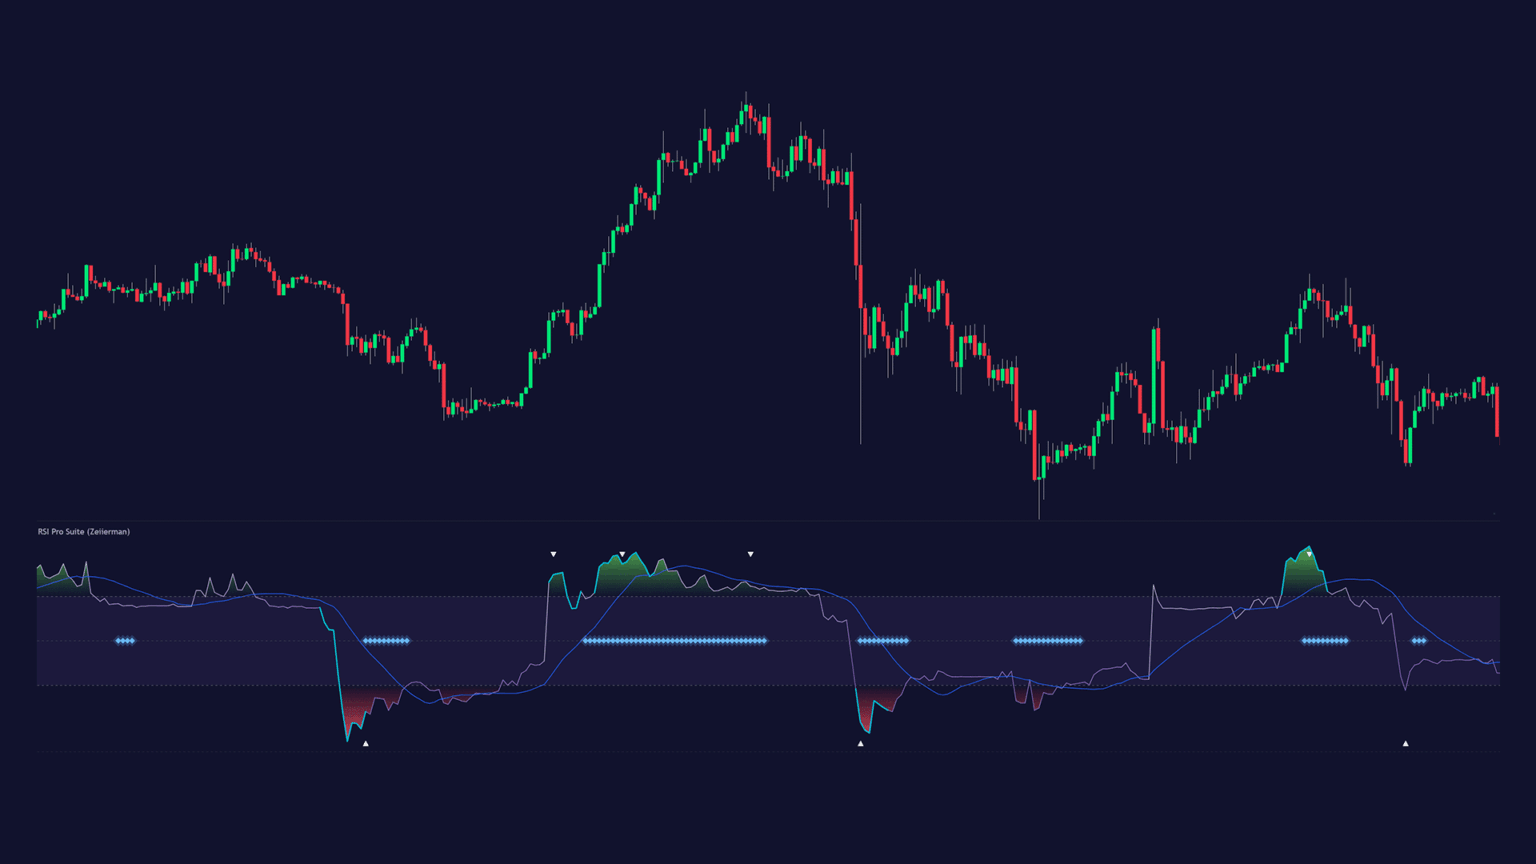
B. RSI Pro Suite
I know, I know. Has there ever been a shortage of Relative Strength Index (RSI) indicators on TradingView? Well, no, but this one’s different. We developed a modern RSI built on an Efficient Price (EP) foundation for cleaner, more meaningful momentum reads. It adds divergence detection, momentum impulses, pressure zones, and a multi-timeframe dashboard. All of which are pretty useful for timing pullbacks, regime shifts, or continuation.
Try: RSI Pro Suite on TradingViewWho it’s for: Momentum/trend traders timing pullbacks, regime shifts, and divergences who need cleaner momentum reads than classic RSI.
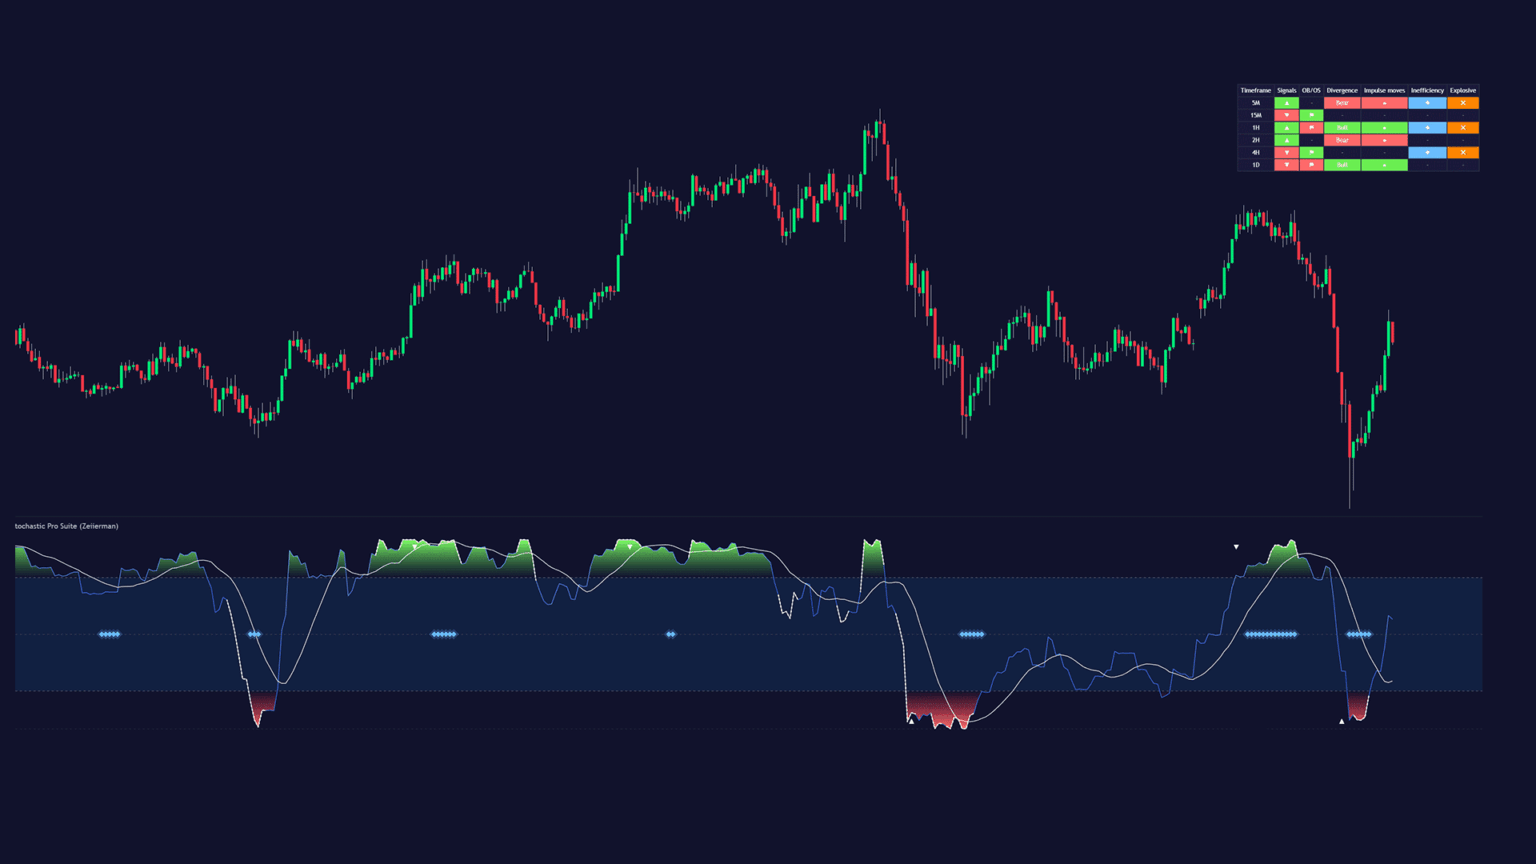
C. Stochastic Pro Suite
This is a cycle-aware, EP-powered stochastic that stabilizes rotations and highlights overbought/oversold conditions with adaptive context. It supports mean-reversion, swing, and trend traders who need reliable rotation cues without excess noise.
Try: Stochastic Pro Suite on TradingViewWho it’s for: Swing/mean-reversion traders who depend on cycle turns and want stabilized rotations without excess noise.
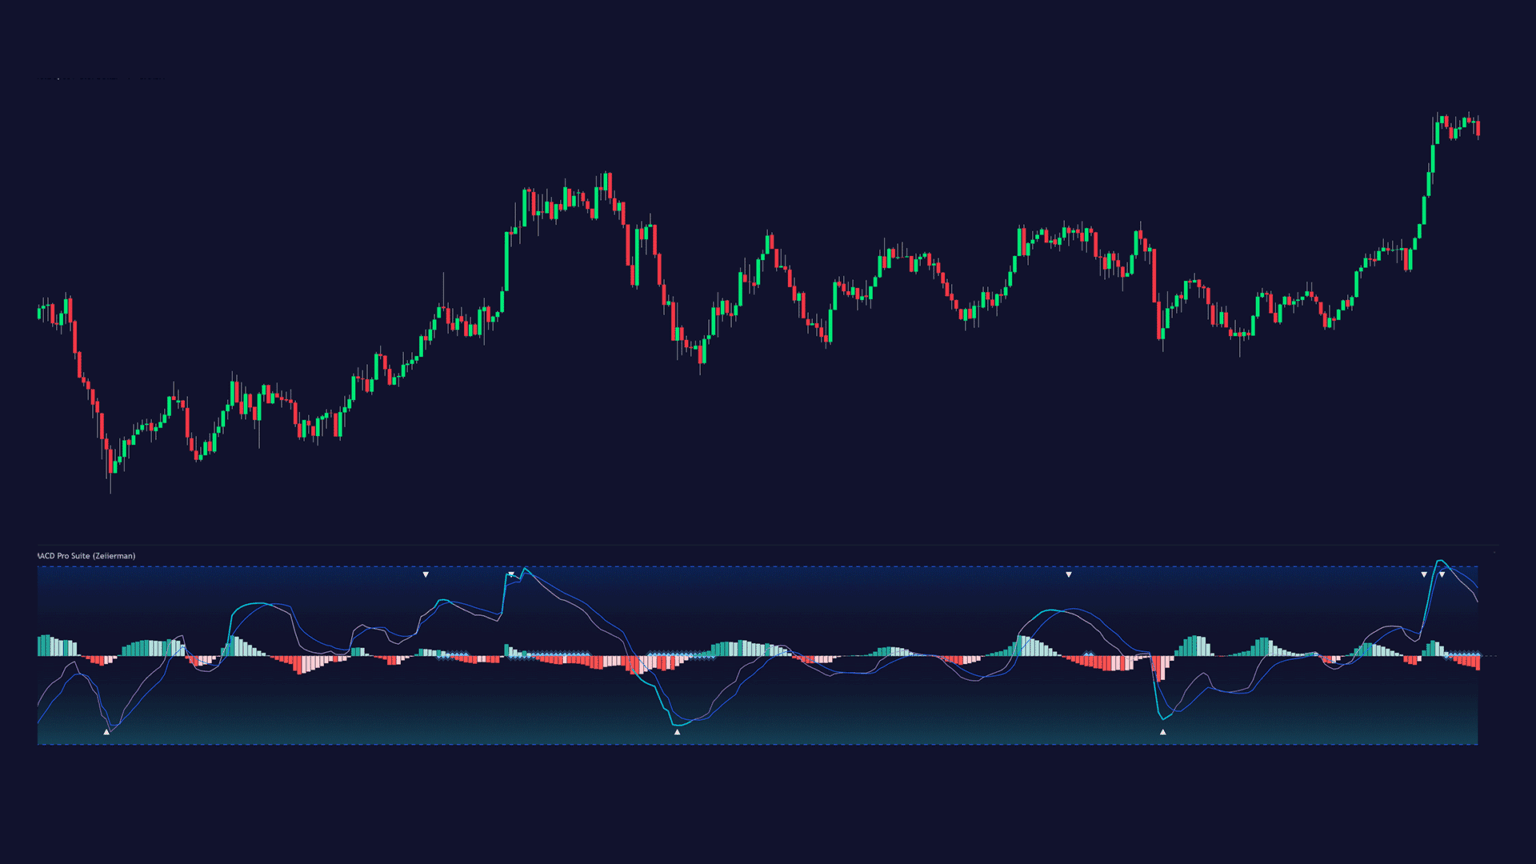
D. MACD Pro Suite
MACD Pro Suite upgrades the classic MACD into an adaptive engine that reacts to trend quality, volatility, momentum strength, and market structure in real time. It uses efficiency-weighted price and momentum acceleration to deliver cleaner signals, earlier transitions, and more stable behavior during both expansions and compressions. A compact multi-timeframe dashboard makes it easy to read market conditions at a glance.
Try: MACD Pro Suite on TradingViewWho it’s for: Traders who depend on momentum shifts, trend confirmation, breakout conditions, and early warnings of weakening pressure, and want a far more adaptive version of MACD than the standard model.
2. Toolkits for Long-Term Investors
Our Investor Pro Suite is a unified toolkit for analysis, valuation, and portfolio oversight. You’re getting an entire investor’s workflow in TradingView, with automated evaluations, dynamic fair-value zones, and live position tracking. The suite has three primary tools:
- Stock Valuation & Analysis: Adaptive DCF/multiples with trend overlays and volatility regimes to surface fair-value context and actionable zones.
- Stock Fundamentals: Multi-dimensional scoring (Value, Health, Growth, etc.), spider charts, and sentiment bars to visualize strength at a glance.
- Stock Management: Track positions (P&L, allocations, dividends), normalize currencies, and view risk exposure across up to 20 holdings – turning TradingView into a lightweight portfolio hub.
Who it helps: long-term investors who want integrated valuation signals, fundamentals, and portfolio awareness without leaving their charting environment.
Try: Zeiierman’s Investor Pro Suite on TradingView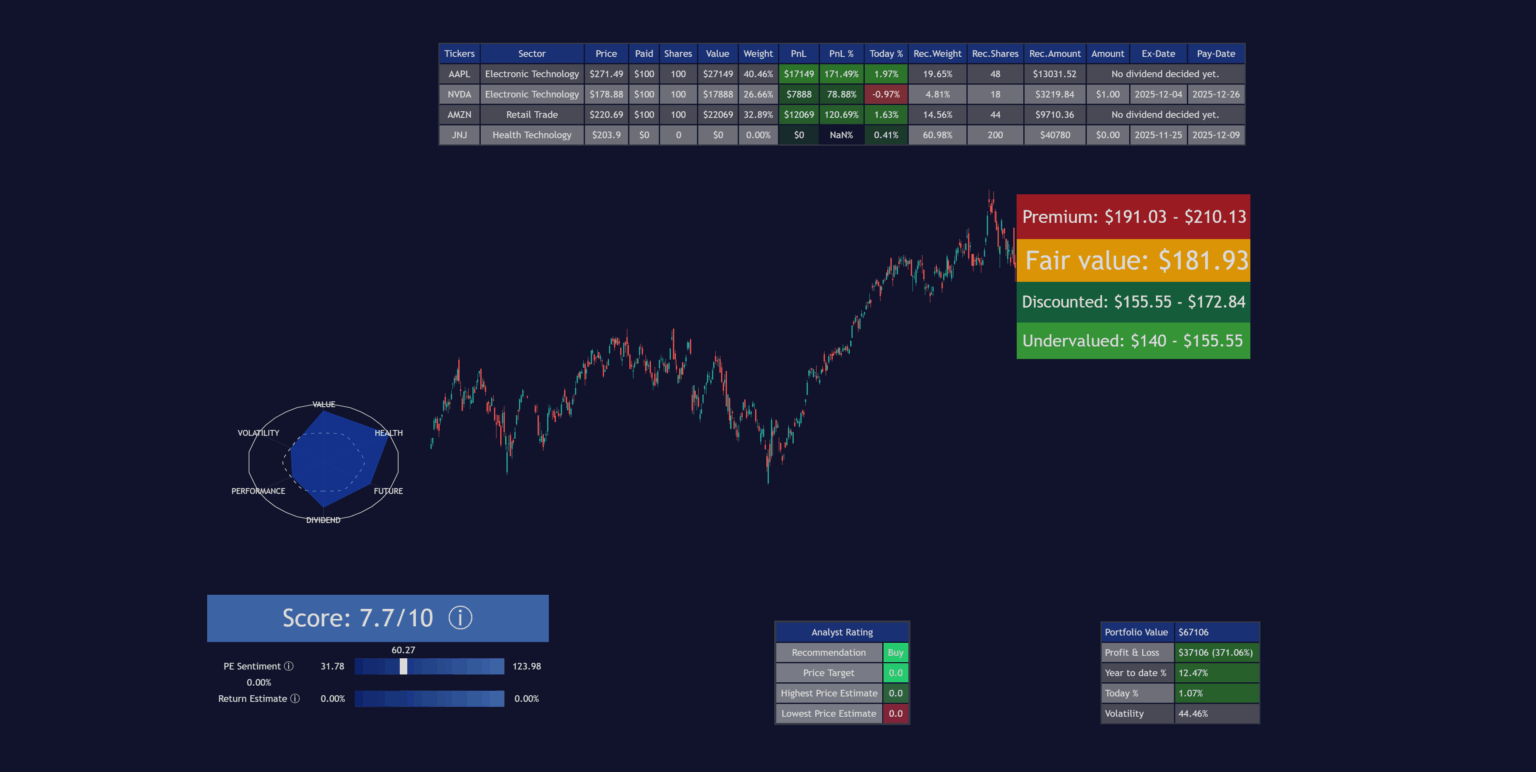
3. Platform-wide Enhancements
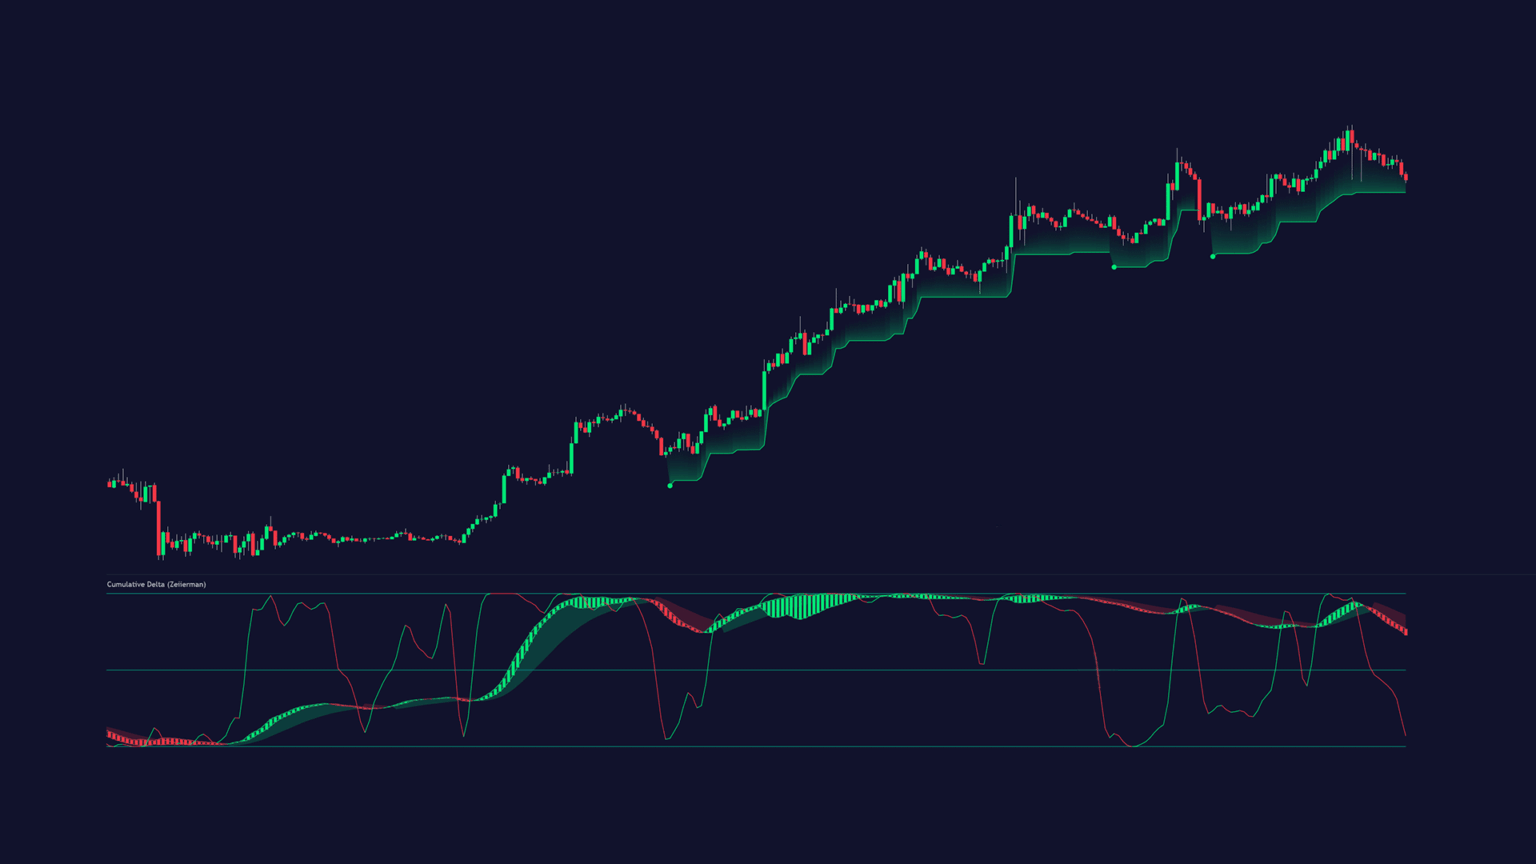
Cumulative Delta: Added volume-driven triggers for cleaner buy/sell pressure reads (absorption, delta reversals, footprint-style clarity).
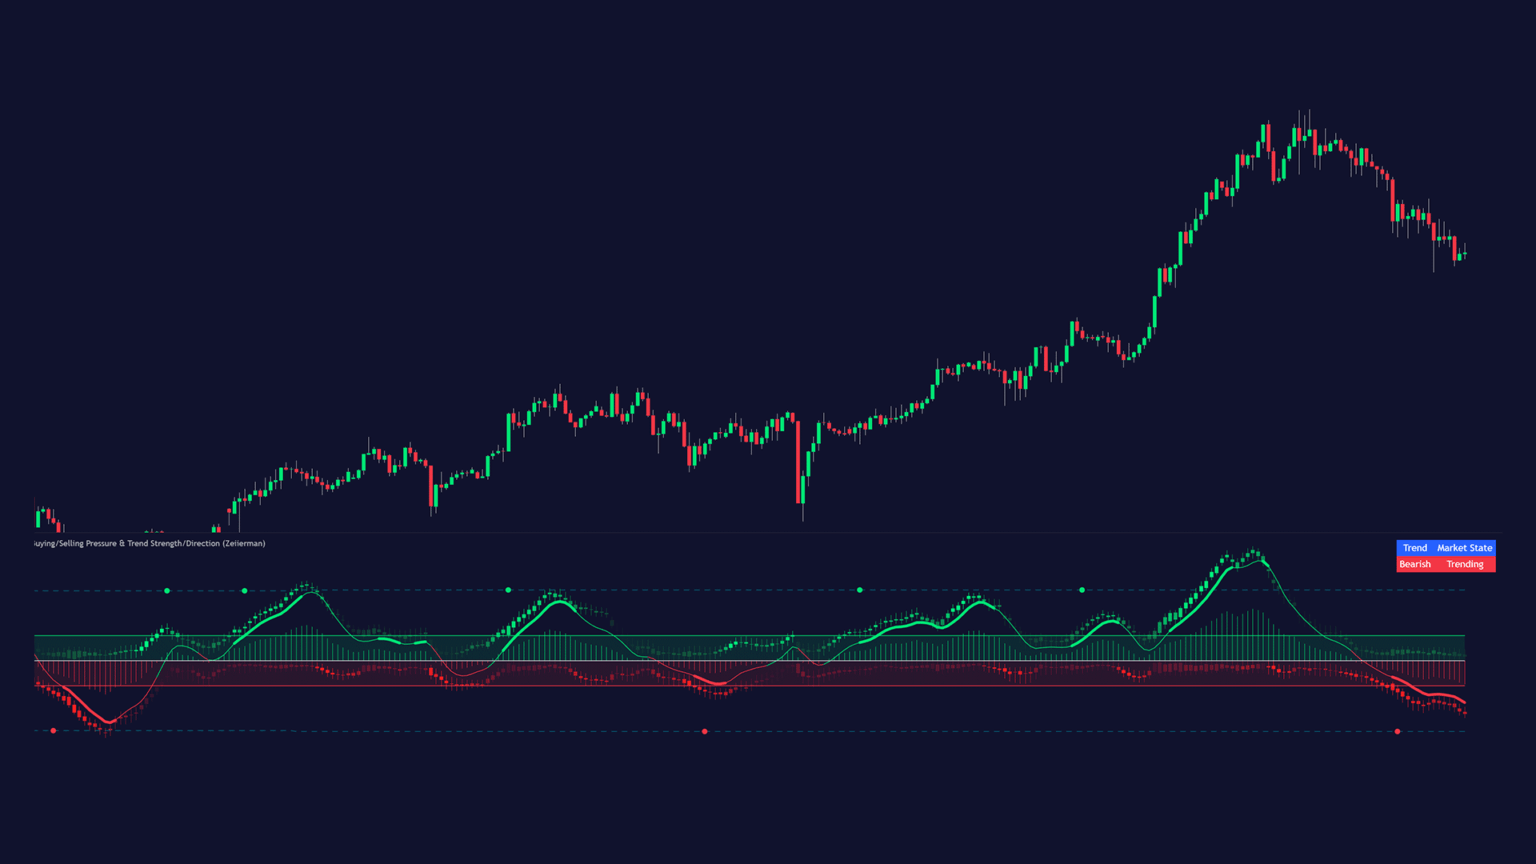
Buying/Selling Pressure & Trend Strength/Direction: Major UI redesign, top/bottom signals, trend buy/sell cues, performance improvements, and refined visuals for faster read-through.
This indicator now includes a four-layer trend model (Fast, Core, Strong, Established) plus Long/Short and Long-Covered/Short-Covered signals. It can also add anomaly flags for position unwinds (e.g., price rising on negative delta or falling on positive delta) with optional alerts, so you can spot forced exits early.
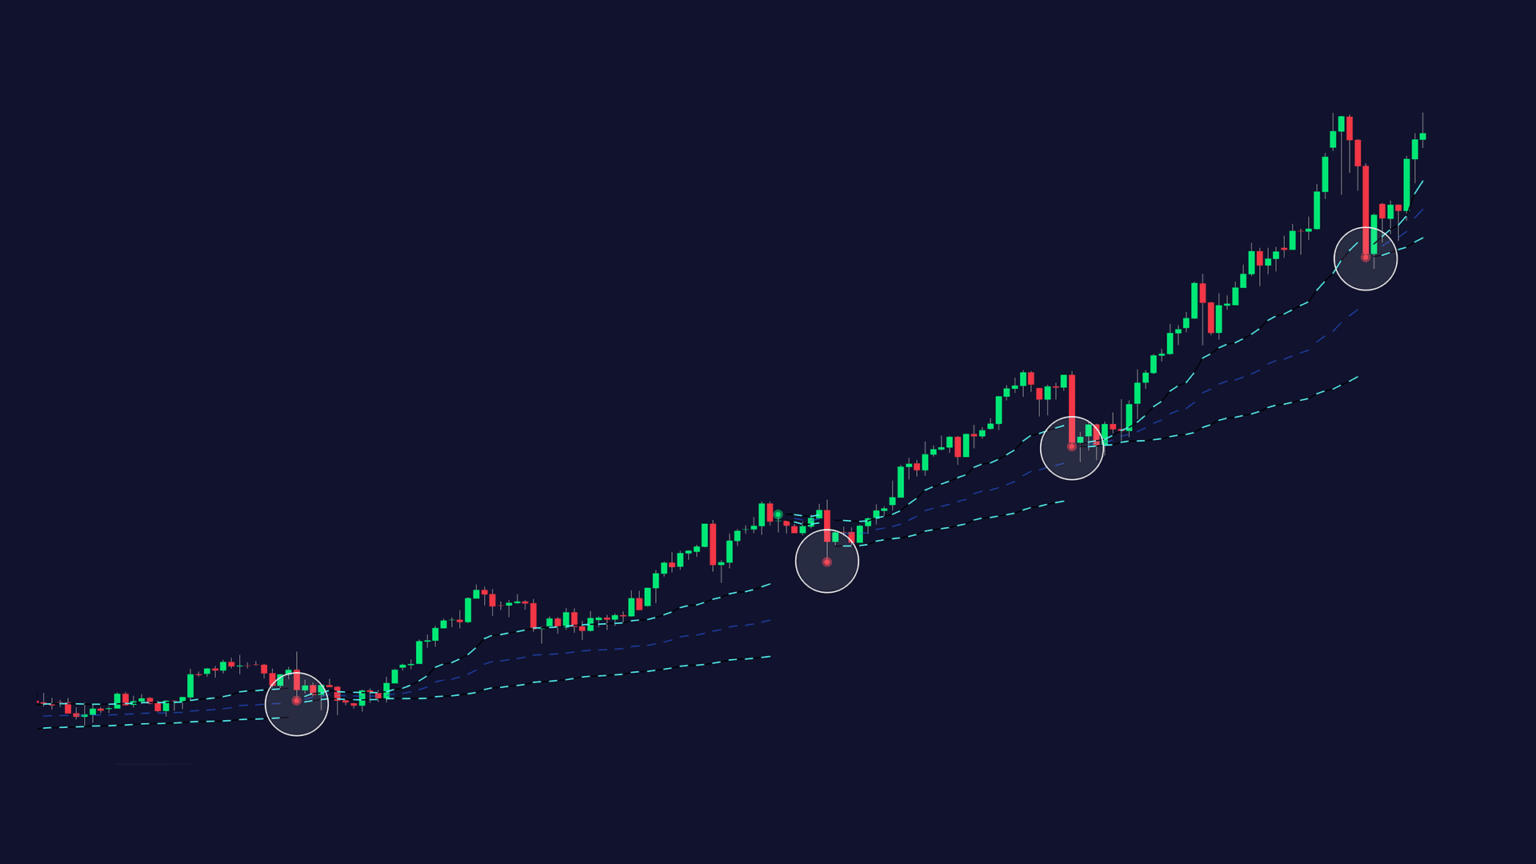
ATR Trend & ATR Top/Bottom: New trend layers, alerts, bar coloring, and improved reversal detection to pair volatility with direction.
You can now see surfaced contrarian signals when price stretches beyond ATR bands (exhaustion tags) and highlighted trend-channel hits/impulses to guide partials and stop-trailing. A new direction+volatility composite trigger helps confirm when a move is ‘real’ versus noise.
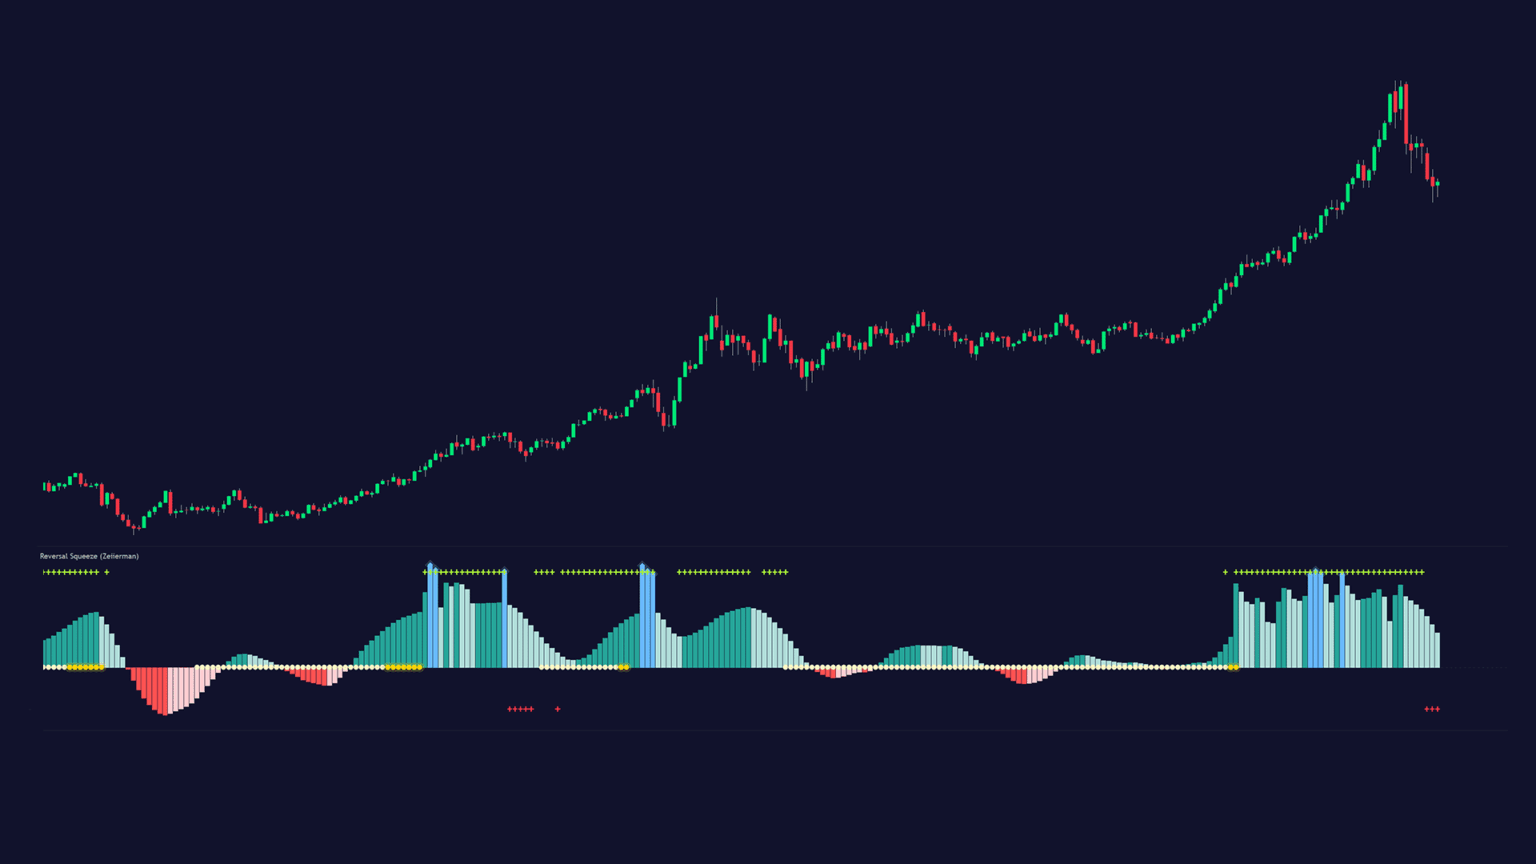
Adaptive Squeeze Momentum: Overhauled engine for quicker squeeze detection and cleaner momentum transitions; highlights expansion and reversal zones with efficiency awareness.
Here’s the visual logic to follow:
- Light dots: compression building
- Yellow dots: release.
Inefficiency overlays highlight low-efficiency zones so you can time entries around the squeeze without over-fitting.
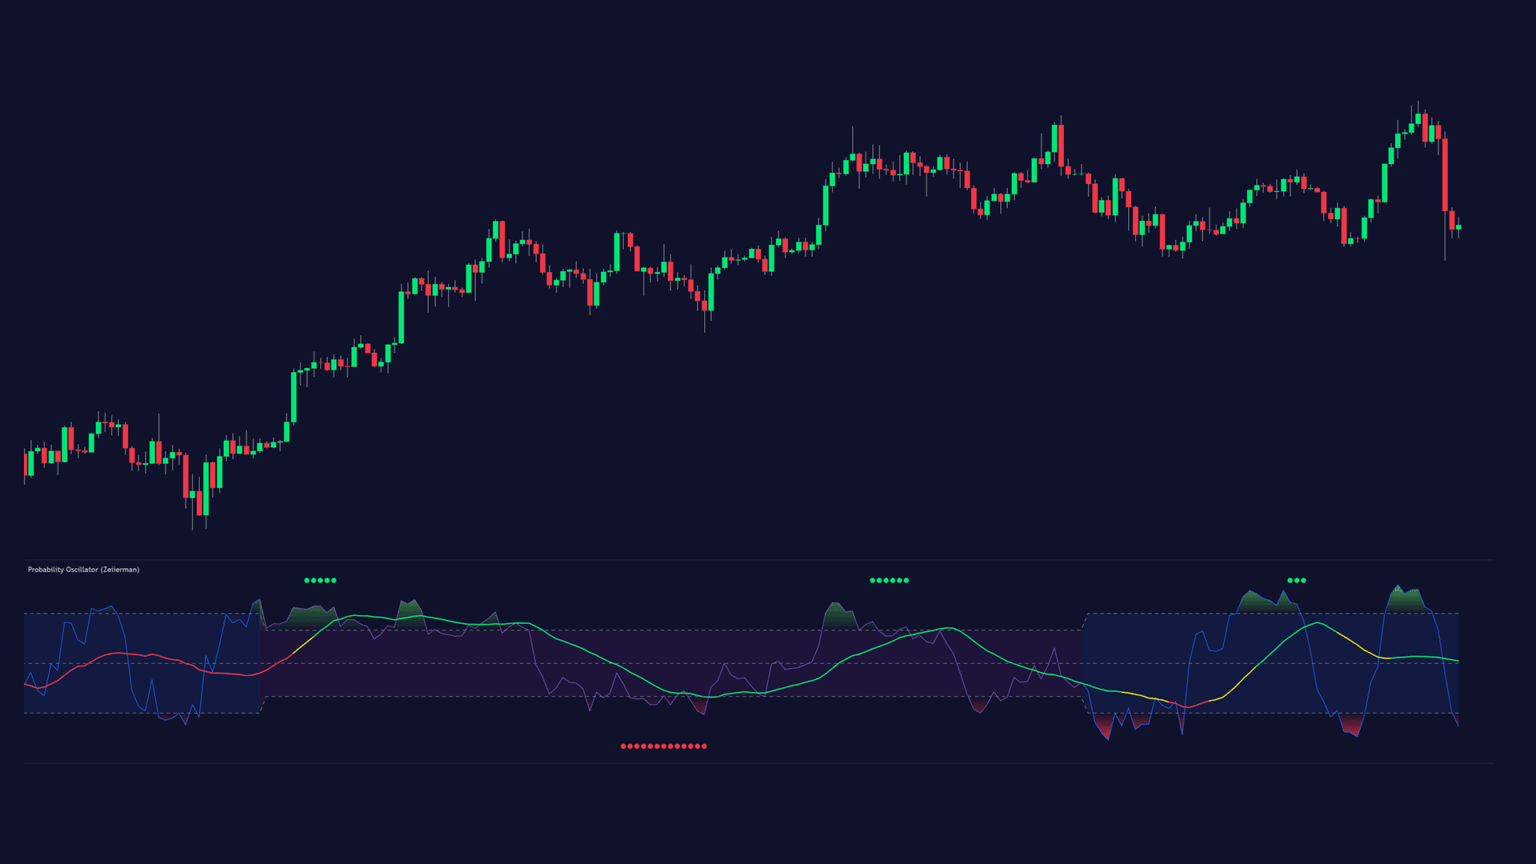
Probability Oscillator: An adaptive, regime-aware probability model (Bayesian framework) that shifts smoothly between trend persistence and oscillation states.
Climax Volume: Now with dynamic VWAP and POC to contextualize extreme participation and post-event equilibrium for better breakout/mean-reversion reads.
Uses an evolving Point of Control as the transaction center with tolerance bands around PoC. The purpose is to quickly find the post-climax equilibrium for either mean-reversion back to PoC or continuation once the price accepts above/below it.
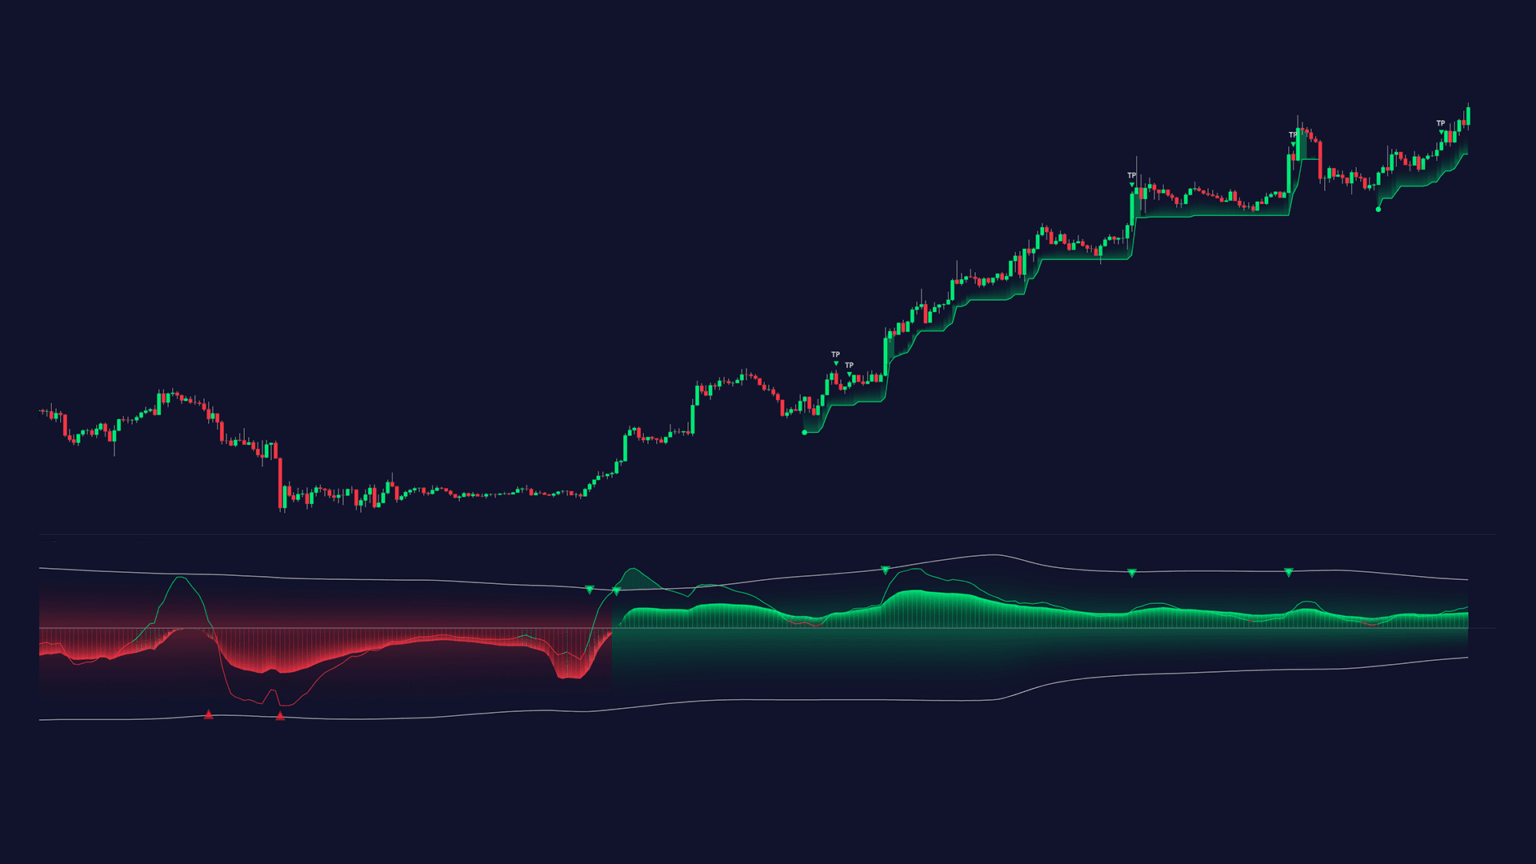
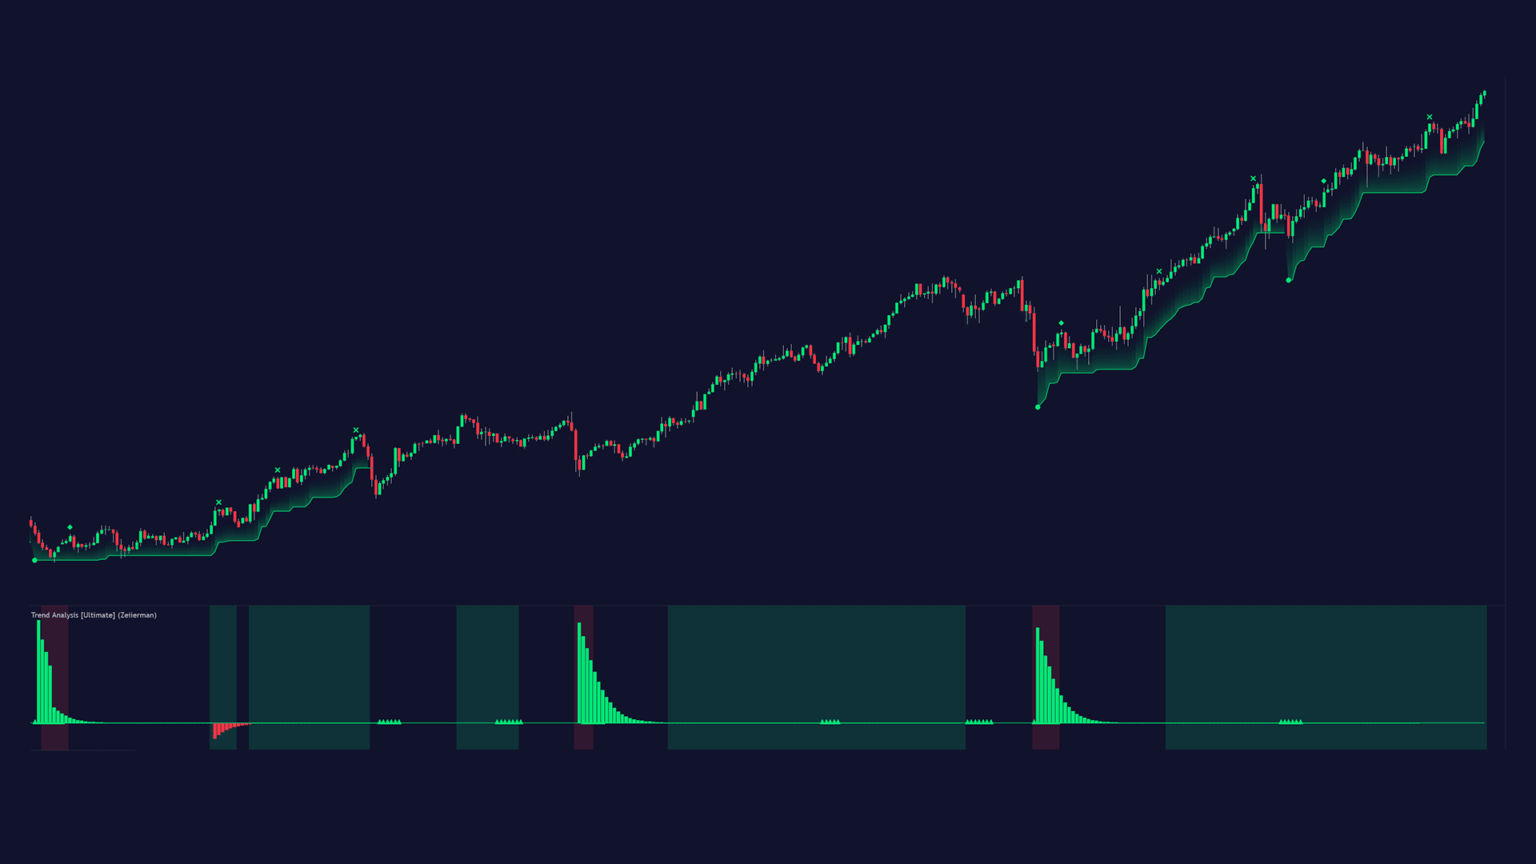
Trend Analysis Ultimate: Added trend signals and refined retracement logic to separate normal pullbacks from actual reversals (with automation for stops/profits/alerts).
4. Improved Documentation for Users
We’ve expanded descriptions, usage notes, and strategy examples directly inside TradingView listings. You can now expect clearer feature explanations, practical tips, and tooltips that shorten the learning curve and improve day-one results.
And if you still need to learn (or know) more, there’s a treasure trove of trading documentation and tool knowledge on the Zeiierman Documentation site.
Get Started
Explore the new Pro tools, try Investor Pro for portfolio-grade decisions, and update your existing indicators to access the latest performance and signal upgrades. Questions or feedback? Reach out or join the Discord community to engage in trading discussions 24/7. We’re iterating fast and building with your workflows in mind.
Zeiierman
With over 16 years in the market, Zeiierman has extensive experience as a full-time trader and risk advisory consultant for hedge funds. He has developed many profitable trading strategies, drawing on his background in risk management and strategy execution.
More from Zeiierman