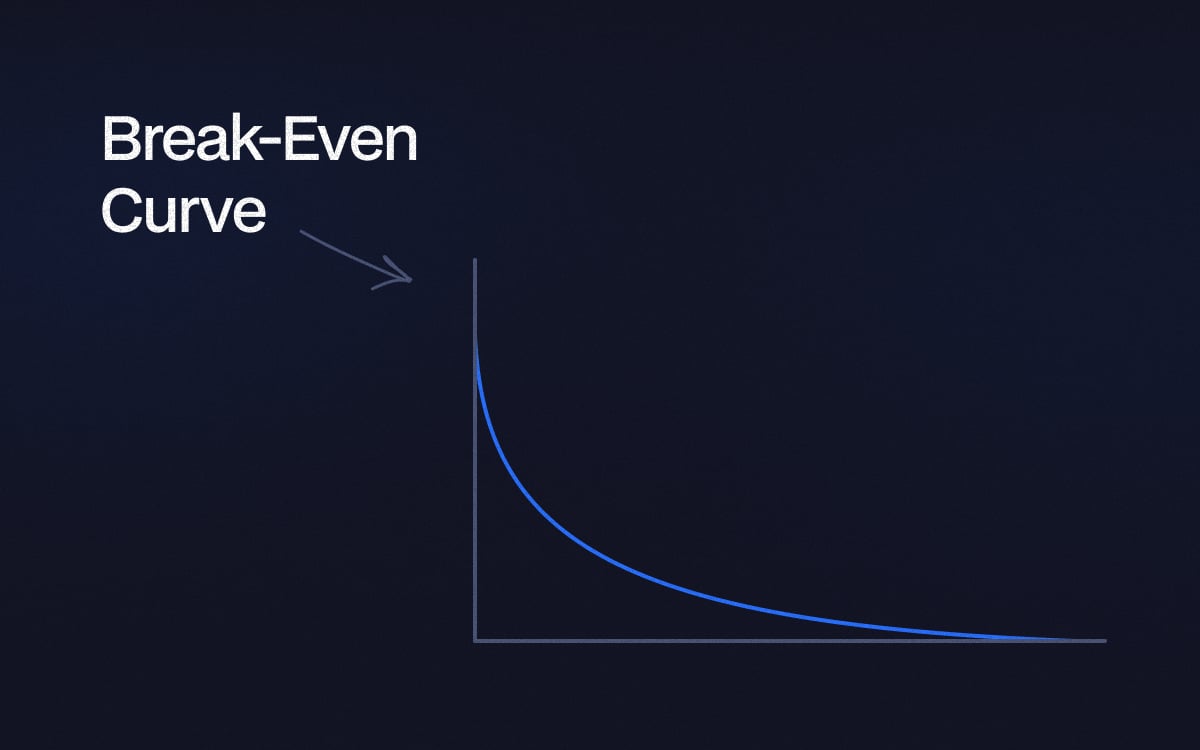
The Break Even Curve is a valuable trading statistic tool because it shows what win rate and profit factor your trading system requires to be profitable.
You don’t make or lose money when your trading system is at break-even (at the blue curve). If your trading system performs below the blue curve, you lose money.
If you have a high win rate or profit factor, you will make money from trading. However, you can make good money from trading with a low win rate and a high profit factor. It all depends on which trading strategy you use.
It all comes down to the Risk-Reward ratio your trading system has. Your winning trades have to outperform your losing trades.
How to use the Break-Even Curve?
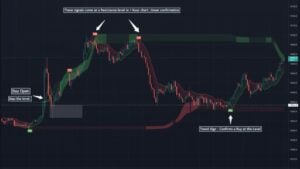
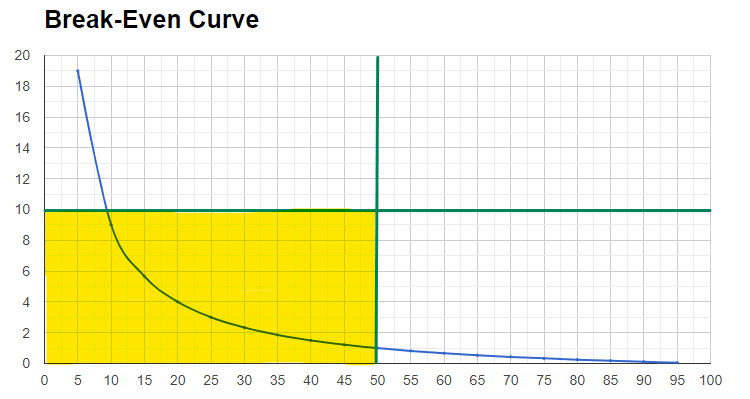
The Break-Even Curve determines if a trading system makes enough winning trades to be profitable. When trying out a new trading system and finding the best target and stop-loss settings, you can use the Break-Even Curve to figure out how many trades you need to win to break even.
You will make money if the trading strategy performs above the blue line, and you will lose money if the trading strategy performs below the blue line.
The risk/reward ratio and the win rate go together. The risk/reward shows how much you risk compared to how much you make on each trade, and the win rate shows how many trades you win in percentage.
At the bottom of this page, you can set your win rate and profit factor and see how your trading systems score on the Break-Even Curve chart.
The different zones
Zone 1
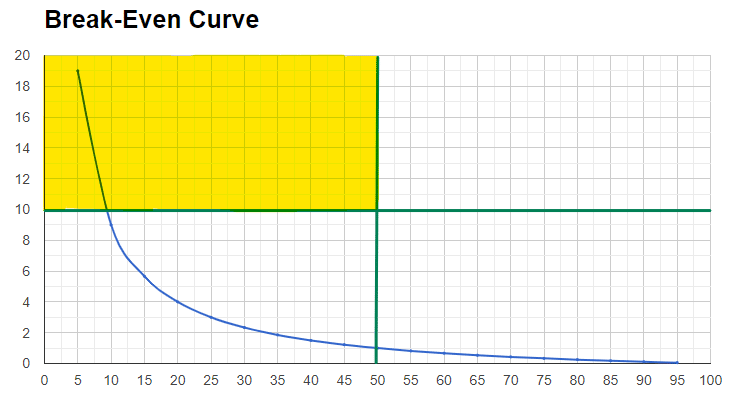
Unprofitable traders are in this zone. They lack a consistent strategy and often have several losing trades. Low win rate and lack of risk management make traders perform in this zone.
To be a profitable trader with a win rate below 50%, you must have at least a profit factor above the blue line.
Break-even curve zone 1
Zone 2
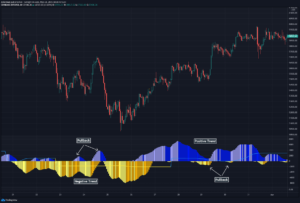
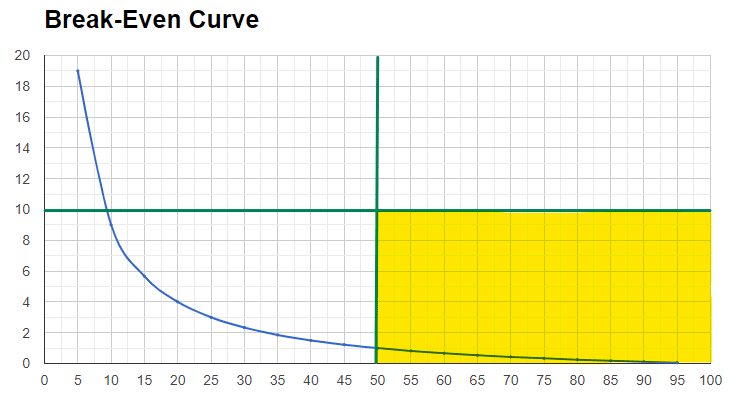
The most common area for break-out trading systems. Most break-out systems have a very tight stop loss and a high target. Or, to rephrase, a low win rate and a higher risk/reward ratio. These strategies can be hugely profitable.
To be in this zone requires patience and discipline! You must be aware that you will lose more often than you win. You have to be able to stick with your trading plan and ensure you have enough risk/reward on each trade. Once you have that winning trade, hold it until it hits your target!
The break-even curve zone 2
Zone 3
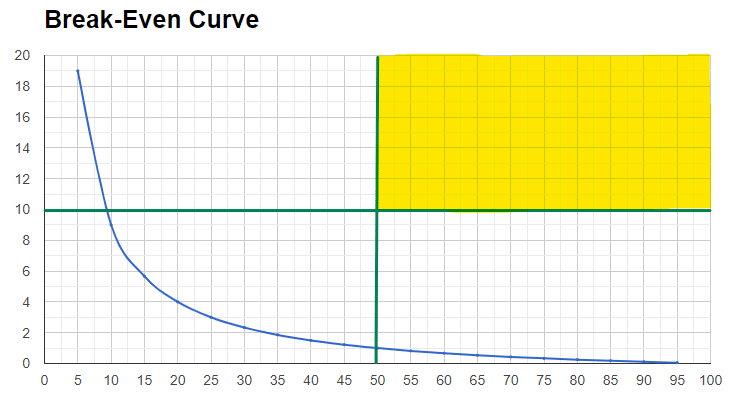
This is the best zone to be in regarding the psychological aspects. You have a high win rate, feel confident, and have consistent results. That helps your mind to stay calm and confident.
Become one of the traders performing in this area by using our proven trading signals and our Curved Stop Loss or Trade & Risk Management Tool!
Break-even curve in trading.
Zone 4: The Magic Zone
“The Magic Zone” has the highest win rate and target ratio. This area is “The Holy Grail.” Everyone wants to be in this zone. You are extremely profitable, confident, and consistent.
To be in this zone combines trading strategy, discipline, risk management, and mental health. One way to achieve this is to use proven and consistent trading indicators and strategies. Because you can’t be in this zone without a great strategy or indicator.
Significantly, few traders have reached this point, but all have been highly rewarded.
Break-even curve in trading – the magic zone
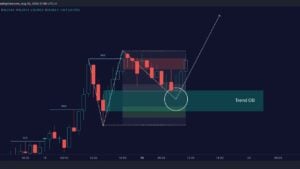
Try it out yourself.
Fill in your win rate and profit factor for your trading strategy or setup and hit “Refresh,” a green dot will appear on the chart. The dot represents in which zone your trading strategy is performing. Are you in “the Magic Zone”? – congratulation!
Zeiierman
With over 16 years in the market, Zeiierman has extensive experience as a full-time trader and risk advisory consultant for hedge funds. He has developed many profitable trading strategies, drawing on his background in risk management and strategy execution.
More from Zeiierman